
U.S. pizza sales are expected to hit $103.7 billion, with delivery taking a bigger share of total dollars. Americans also order pizza more often than the national average, with 41% eating pizza weekly. That blend of steady demand and growing delivery focus reshapes how operators forecast margin.
Key Takeaways
- 62% of Americans prefer pepperoni pizza
- U.S. pizza industry employs 800,000 people
- The U.S. pizza industry generates over $46 billion in annual sales
- U.S. pizza sales per capita $140 annually
- U.S. pizza ovens automated in 25% shops
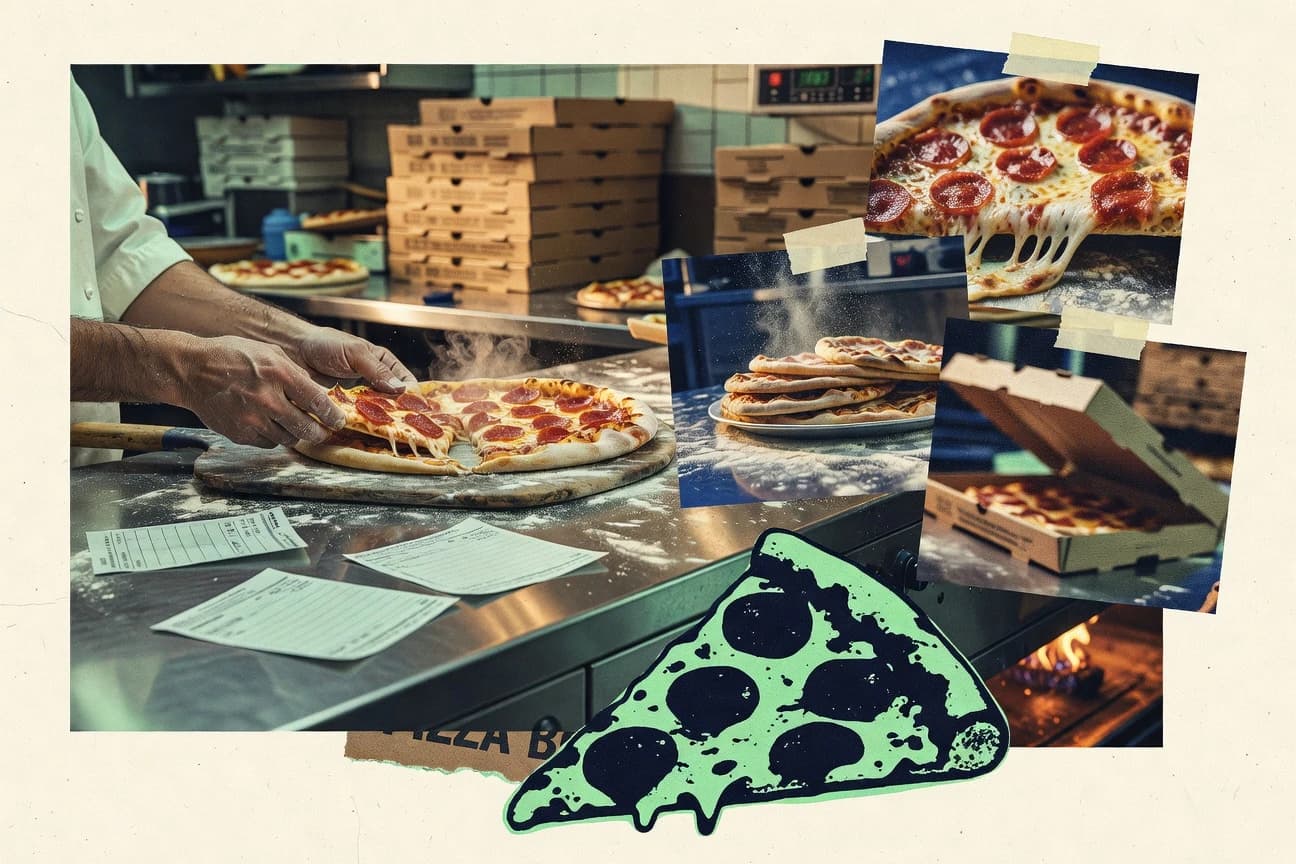
Pizza remains a beloved favorite, with steady growth in sales driven by convenience and new menu options.
Related reading
01 · Category
Consumer Preferences22 stats
01
62% of Americans prefer pepperoni pizza
02
41% of Americans eat pizza weekly
03
71% of millennials order pizza online
04
Cheese pizza most popular at 20% of orders
05
97% of Americans have eaten pizza
06
Women prefer veggie toppings 28% more than men
07
52% of consumers want gluten-free options
08
Gen Z favors Hawaiian pizza 15% higher
09
68% prefer thin crust over thick
10
45% of orders include extra cheese
11
Boomers eat pizza out 2x more than home
12
80% of pizza eaters share slices
13
Vegan pizza demand up 300% since 2014
14
37% choose pizza for kids' parties
15
Spicy toppings popular with 25% under 30
16
55% prefer delivery over dine-in
17
Pineapple on pizza supported by 24% globally
18
66% of families order pizza monthly
19
Cauliflower crust demand up 50% in 2023
20
42% avoid anchovies on pizza
21
Plant-based pepperoni sales up 40%
22
75% of pizza lovers aged 18-34 order delivery
Interpretation
Consumer Preferences Interpretation
In a nation so united by its love for pizza that 97% have tasted it, our shared devotion is only rivaled by our fierce and deliciously petty debates over crust thickness, pineapple's place, and the sacred, yet perpetually contested, supremacy of pepperoni.
02 · Category
Industry Employment23 stats
01
U.S. pizza industry employs 800,000 people
02
Average pizzeria wage $15.50/hour
03
70% of pizza workers are part-time
04
Delivery drivers 25% of pizza staff
05
U.S. pizzerias turnover rate 150% annually
06
40% of employees under 25 years old
07
Kitchen staff avg 5 years experience
08
Managers earn $50,000avg salary
09
15% of pizza jobs filled by immigrants
10
Training costs $1,500per new hire
11
Shift managers 10% of workforce
12
Female employees 45% in pizza industry
13
Labor costs 30% of pizza revenue
14
60,000 new jobs created yearly
15
Cashiers 20% of staff
16
Overtime paid to 12% of drivers weekly
17
Benefits offered to 35% full-time staff
18
Chefs turnover 120% in independents
19
80,000 pizza delivery jobs in U.S.
20
Avg tenure 18 months for cooks
21
Unionized pizza workers 5%
22
Remote order takers rising 10%
23
Seasonal hiring peaks 20% summer
Interpretation
Industry Employment Interpretation
The pizza industry, fueled by a revolving door of young, part-time employees and seasoned kitchen veterans, is a high-stakes delivery system where the only thing hotter than the oven is the annual 150% turnover rate.
03 · Category
Market Size29 stats
01
The U.S. pizza industry generates over $46 billion in annual sales
02
Global pizza market size reached $145.70 billion in 2022
03
U.S. pizza sales grew by 4.5% in 2022
04
Pizza market in Europe valued at $32 billion in 2023
05
Indian pizza market expected to grow at 12.5% CAGR to 2028
06
U.S. pizza industry market share held by independents at 58% in 2023
07
Global frozen pizza market size $18.5 billion in 2023
08
U.K. pizza market revenue $4.2 billion in 2022
09
Brazil pizza market projected to reach $2.8 billion by 2027
10
U.S. pizza delivery market $30 billion in 2023
11
Australia pizza industry $3.1 billion AUD in 2022
12
China pizza market growing at 15% annually
13
U.S. pizzeria count exceeds 80,000 in 2023
14
Global pizza restaurant market $130 billion in 2023
15
Canada pizza sales $5.2 billion CAD in 2022
16
Italy pizza export market $1.5 billion in 2022
17
U.S. pizza franchise market $15 billion
18
Mexico pizza market $1.2 billion USD in 2023
19
Japan pizza delivery market $4 billion in 2022
20
South Africa pizza industry R10 billion in 2023
21
Germany pizza consumption market €5.6 billion
22
France pizza sales €3.8 billion in 2022
23
U.S. pizza market CAGR 3.8% forecast to 2030
24
Russia pizza market 250 billion RUB in 2023
25
Turkey pizza sector 15 billion TRY
26
U.S. pizza industry contributes $37 billion to GDP
27
Global pizza ingredients market $50 billion
28
New Zealand pizza market NZ$1.2 billion
29
Spain pizza revenue €2.1 billion in 2022
Interpretation
Market Size Interpretation
Even as the U.S. remains the cheese-stuffed heart of a global pizza empire worth hundreds of billions, the future of the pie is being written by surging demand from India to China, proving that while America perfected the delivery, the world is hungry for a slice of its own.
More related reading
04 · Category
Sales Volume28 stats
01
U.S. pizza sales per capita $140annually
02
Americans eat 46 slices of pizza per person yearly
03
U.S. pizza orders total 3 billion per year
04
Domino's global sales $4.5 billion in 2022
05
Pizza Hut worldwide revenue $13 billion
06
U.S. delivery sales 20% of total restaurant sales
07
Average pizza check $20.50in U.S.
08
93% of Americans eat pizza at least once a month
09
U.S. pizzerias sell 100 acres of pizza daily
10
Papa John's U.S. sales $3.8 billion
11
Frozen pizza sales $6.5 billion U.S. 2022
12
Little Caesars sales $4.2 billion
13
Online pizza orders 50% of total U.S. sales
14
Average U.S. pizzeria annual revenue $900,000
15
Global Domino's stores sell 1.5 million pizzas daily
16
U.S. pizza sales via apps $12 billion
17
Italy pizza sales 2.5 billion units yearly
18
U.K. pizza delivery sales £2.8 billion
19
Third-party delivery 30% of pizza sales U.S.
20
Average pizza price U.S. $14.50large
21
U.S. pizza sales peak Wednesday 36%
22
Global pizza sales volume 5 billion units/year
23
Marco's Pizza sales $1.2 billion
24
U.S. takeout pizza 62% of sales
25
Canada pizza sales volume 400 million pies/year
26
Australia pizza sales AUD 1.5 billion delivery
27
U.S. pizza revenue per outlet $750,000avg
28
36% of U.S. pizza sales on Super Bowl Sunday
Interpretation
Sales Volume Interpretation
It appears America's unwavering love for pizza is a meticulously calculated, multi-billion dollar affair where we solemnly vow, slice by delivered slice, to collectively maintain a cheesy, circular economy that even Italy must respect.
05 · Category
Technological Innovations25 stats
01
U.S. pizza ovens automated in 25% shops
02
65% of pizzerias use POS systems
03
Online ordering platforms in 80% chains
04
GPS tracking on 70% deliveries
05
AI menu optimization in 15% large chains
06
Robotic dough makers in 10% factories
07
Contactless payment 90% adoption post-COVID
08
Drone delivery tested by 5 chains
09
UV sanitation robots in 20% kitchens
10
Predictive analytics for inventory 30%
11
Voice AI ordering 12% of calls
12
Blockchain for supply chain 8%
13
AR menu visualization apps 5%
14
Electric conveyor ovens 40% new installs
15
Mobile app loyalty programs 75% chains
16
IoT temp monitoring dough rising 25%
17
Self-driving delivery vehicles pilot 3%
18
3D printed custom pizzas R&D 2%
19
Big data personalization 40% top chains
20
NFC tables for ordering 10% upscale
21
Cloud kitchens for pizza 18% urban
22
Biometric loyalty scans 4%
23
VR training simulations 15% corporates
24
Sustainable packaging tech 35%
25
Automated sauce dispensers 22%
Interpretation
Technological Innovations Interpretation
The pizza industry is feverishly automating everything from oven to order, yet remains curiously human in its stubborn refusal to let us eat a hot, perfectly tracked, sustainably packaged, and eerily personalized pie without still owing the bank a small fortune for the privilege.
report visual · Comparison
U.S. pizza preference & behavior
Americans’ pizza habits skew toward familiar toppings and frequent, delivery/online ordering.
Have eaten pizza97%
Eat pizza at least once a month93%
Millennials order pizza online71%
Prefer pepperoni pizza62%
Prefer delivery over dine-in55%
Eat pizza weekly41%
Reference
Cite This Report
This report is designed to be cited. We maintain stable URLs and versioned verification dates. Copy the format appropriate for your publication below.
APA
Margot Villeneuve. (2026, February 13). Pizza Industry Statistics. Gitnux. https://gitnux.org/pizza-industry-statistics
MLA
Margot Villeneuve. "Pizza Industry Statistics." Gitnux, 13 Feb 2026, https://gitnux.org/pizza-industry-statistics.
Chicago
Margot Villeneuve. 2026. "Pizza Industry Statistics." Gitnux. https://gitnux.org/pizza-industry-statistics.
Sources & references
65 datasets cited across this report · attribution is report-level