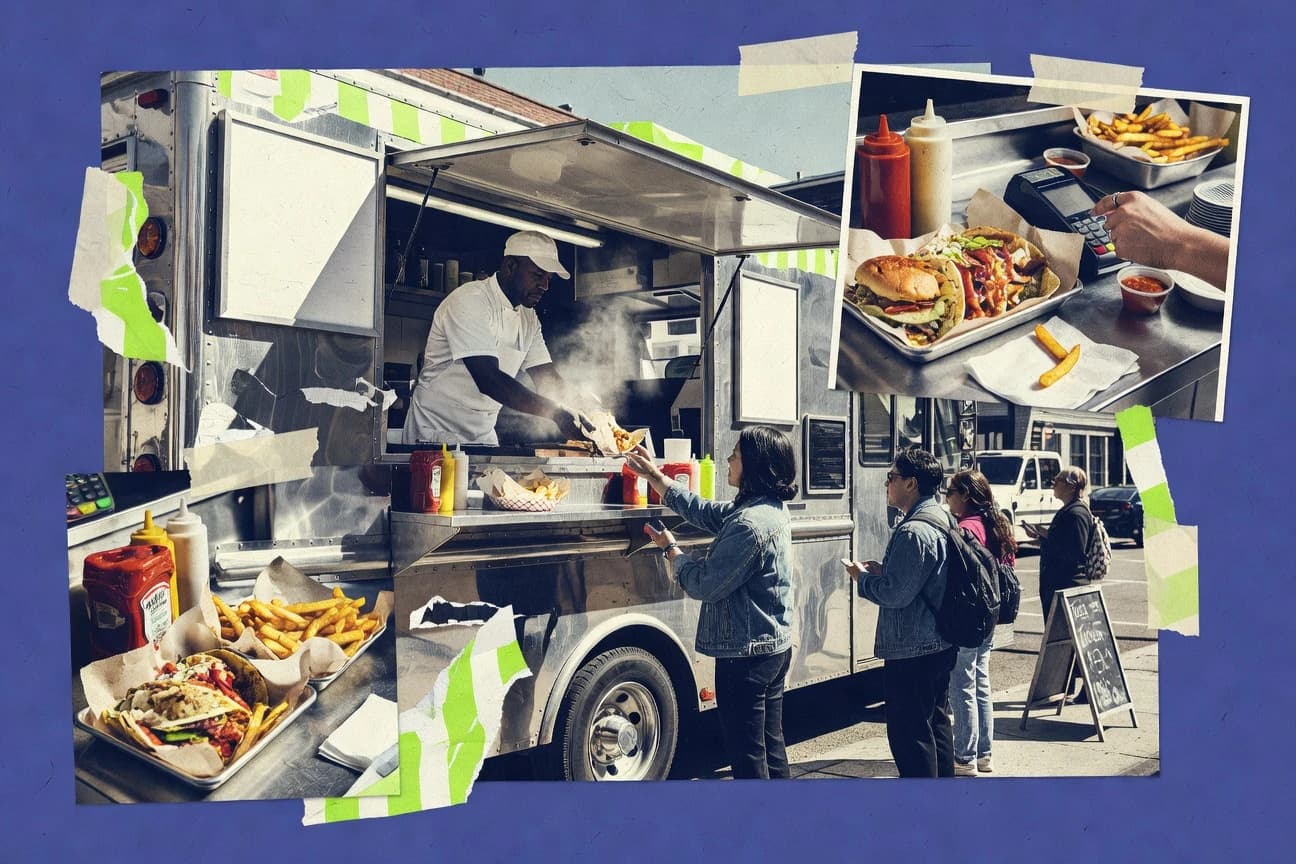

The food truck industry is driven by how customers discover and decide where to eat—such as heavy reliance on maps and online reviews, plus social media’s role in discovery. Alongside demand, day-to-day operations affect margins, including food safety targets in the FDA Food Code, sanitizer verification routines, and the challenge of food waste in food services. Pricing pressure also comes from labor, rent/utilities, and shifting food input costs.
Key Takeaways
- $2.5 billion global market size estimate for food truck services in 2023
- 7.1% CAGR forecast for the food truck market from 2024 to 2030
- Food trucks accounted for 23.4% of street food sales value in North America (consumer spending estimate)
- 34% of consumers reported using social media to decide where to eat (survey-based behavior measure)
- 45% of U.S. diners say they are likely to try a new restaurant based on an online review (relevant to food truck discovery via ratings)
- 71% of consumers say they’re likely to use Google Maps to find a place to eat
- 20 seconds handwashing time is specified in the FDA Food Code for certain situations
- 165°F is the FDA Food Code target for poultry (e.g., whole cuts, ground poultry, injected poultry)
- 25% to 30% of food is wasted in food services (operational performance risk metric)
- Labor commonly represents 30% to 40% of restaurant sales (proxy for food truck labor cost pressure)
- Rent and utilities can run 5% to 10% of restaurant sales (proxy for truck site/parking and utility fees)
- Food and beverage suppliers in the U.S. often pass through commodity price increases that can sharply affect food cost percentages for restaurants (inflation sensitivity)
- In a U.S. survey, 47% of consumers said they prefer food that is “fresh” when choosing where to eat (relevant to food truck offerings)
- In a U.S. survey, 33% of consumers said they buy from food trucks for “variety” (survey evidence)
- In a U.S. survey, 28% of consumers said they buy from food trucks for “cost savings” (survey evidence)
With a $2.5 billion market in 2023 growing 7.1% annually, food trucks win as consumers discover them online.
Related reading
01 · Category
Market Size9 stats
01
$2.5 billion global market size estimate for food truck services in 2023
02
7.1% CAGR forecast for the food truck market from 2024 to 2030
03
Food trucks accounted for 23.4% of street food sales value in North America (consumer spending estimate)
04
Food trucks accounted for 18.6% of street food sales value in Europe (consumer spending estimate)
05
Food trucks are included in the U.S. NAICS 722330 (Mobile Food Services) industry definition
06
NAICS 722330 classification covers preparation of meals in mobile units for immediate consumption
07
In 2022, the U.S. Census Bureau’s County Business Patterns provides establishment counts for NAICS 722330 by county
08
In 2022, County Business Patterns contains data on NAICS 722330 establishments
09
NAICS 722330 includes establishments that sell ready-to-eat food from motor vehicles or movable carts
Interpretation
Market Size Interpretation
The food truck market is already valued at about $2.5 billion globally in 2023 and is projected to grow at a 7.1% CAGR from 2024 to 2030, with sizable shares of street food spending in North America at 23.4% and Europe at 18.6% reinforcing that this is a fast expanding market segment.
02 · Category
Industry Trends13 stats
01
34% of consumers reported using social media to decide where to eat (survey-based behavior measure)
02
45% of U.S. diners say they are likely to try a new restaurant based on an online review (relevant to food truck discovery via ratings)
03
71% of consumers say they’re likely to use Google Maps to find a place to eat
04
In a global survey, 56% of consumers said they rely on social media for product or brand discovery
05
For street food, the global market is expected to grow to $1.2 trillion by 2030 (context for food trucks as street food vendors)
06
The global street food market is forecast to grow at a CAGR of 8.2% from 2023 to 2030
07
In the U.S., food trucks are commonly concentrated in urban areas with high event density (distribution pattern observed in multiple city studies)
08
In a study of food truck stakeholders, 62% reported operating at festivals or events as a significant revenue source
09
In a sample survey, 74% of food truck operators reported using social media for marketing
10
In a survey, 41% of consumers said they follow local food trucks on social media to get location updates
11
Food trucks are subject to health inspections, and the U.S. FDA encourages jurisdictions to use risk-based inspection frequencies under the Food Code
12
The FDA Food Code includes minimum handwashing requirements including washing with soap for at least 20 seconds
13
The FDA Food Code recommends an internal cooking temperature of 165°F for poultry and 155°F for ground meats (context for mobile food safety)
Interpretation
Industry Trends Interpretation
With street food expected to reach $1.2 trillion by 2030 and grow at an 8.2% CAGR, Food Truck Industry Trends are being driven by how strongly consumers rely on digital discovery, including 71% using Google Maps and 34% using social media to decide where to eat.
03 · Category
Performance Metrics4 stats
01
20 seconds handwashing time is specified in the FDA Food Code for certain situations
02
165°F is the FDA Food Code target for poultry (e.g., whole cuts, ground poultry, injected poultry)
03
25% to 30% of food is wasted in food services (operational performance risk metric)
04
The FDA Food Code recommends sanitizer concentration checks using test strips at a specified frequency (operational control)
Interpretation
Performance Metrics Interpretation
Across performance metrics for the food truck industry, strict hygiene and safety thresholds like 20 seconds of handwashing and 165°F target poultry temps pair with the operational risk of 25% to 30% food waste, making consistent sanitizer concentration checks a key control to protect service quality and reduce losses.
More related reading
04 · Category
Cost Analysis6 stats
01
Labor commonly represents 30% to 40% of restaurant sales (proxy for food truck labor cost pressure)
02
Rent and utilities can run 5% to 10% of restaurant sales (proxy for truck site/parking and utility fees)
03
Food and beverage suppliers in the U.S. often pass through commodity price increases that can sharply affect food cost percentages for restaurants (inflation sensitivity)
04
The U.S. CPI for food at home increased by X% in annual terms depends on the year; food inflation impacts food truck food costs (CPI baseline series)
05
The BLS publishes Producer Price Index (PPI) series for food manufacturing inputs relevant to menu cost forecasting
06
The USDA Economic Research Service tracks food price inflation and retail cost drivers that affect mobile food service cost structures
Interpretation
Cost Analysis Interpretation
For cost analysis, food trucks face sustained margin pressure because labor typically consumes 30% to 40% of sales and rent plus utilities add another 5% to 10%, while BLS and USDA data on food inflation and commodity pass through can still swing food costs sharply year to year.
05 · Category
User Adoption22 stats
01
In a U.S. survey, 47% of consumers said they prefer food that is “fresh” when choosing where to eat (relevant to food truck offerings)
02
In a U.S. survey, 33% of consumers said they buy from food trucks for “variety” (survey evidence)
03
In a U.S. survey, 28% of consumers said they buy from food trucks for “cost savings” (survey evidence)
04
In a U.S. survey, 22% of consumers said they buy from food trucks because they are “new to the area” (survey evidence)
05
In a U.S. survey, 19% of consumers said they buy from food trucks because they are “quick service” (survey evidence)
06
In a survey, 44% of respondents said they would buy from food trucks again (repeat purchase intent measure)
07
In a survey, 39% of respondents said they would recommend food trucks to friends (word-of-mouth intent)
08
In a survey, 61% of respondents said food trucks offer good value for money (value perception)
09
In a survey, 52% of respondents said they discovered food trucks through social media (discovery channel adoption)
10
In a survey, 46% of respondents said they discover food trucks through friends or word-of-mouth
11
In a survey, 34% of respondents said they discover food trucks through mobile apps or websites (digital discovery)
12
In a survey, 28% of respondents said they discover food trucks through local events and festivals (offline discovery)
13
In a survey, 37% of food truck customers reported spending $20–$30 per visit (typical spend bracket measure)
14
In a survey, 26% of customers reported spending under $20 per visit
15
In a survey, 21% of customers reported spending $30–$40 per visit
16
In a survey, 16% of customers reported spending over $40 per visit
17
In a survey, 41% of customers said they visit food trucks at least once per month (frequency adoption)
18
In a survey, 34% of customers said they visit every few months
19
In a survey, 25% of customers said they visit less often than every few months
20
In a survey, 46% of customers said they pay with credit or debit cards (payment method adoption)
21
In a survey, 33% of customers said they pay with cash
22
In a survey, 21% of customers said they pay using mobile wallets or apps
Interpretation
User Adoption Interpretation
User adoption for food trucks appears strongest around fresh, repeatable experiences, with 47% of consumers prioritizing “fresh” food and 44% saying they would buy from food trucks again.
Reference
Cite This Report
This report is designed to be cited. We maintain stable URLs and versioned verification dates. Copy the format appropriate for your publication below.
APA
Samuel Norberg. (2026, February 13). Food Truck Industry Statistics. Gitnux. https://gitnux.org/food-truck-industry-statistics
MLA
Samuel Norberg. "Food Truck Industry Statistics." Gitnux, 13 Feb 2026, https://gitnux.org/food-truck-industry-statistics.
Chicago
Samuel Norberg. 2026. "Food Truck Industry Statistics." Gitnux. https://gitnux.org/food-truck-industry-statistics.
Sources & references
28 datasets cited across this report · attribution is report-level
+13 additional datasets cited (not shown individually)