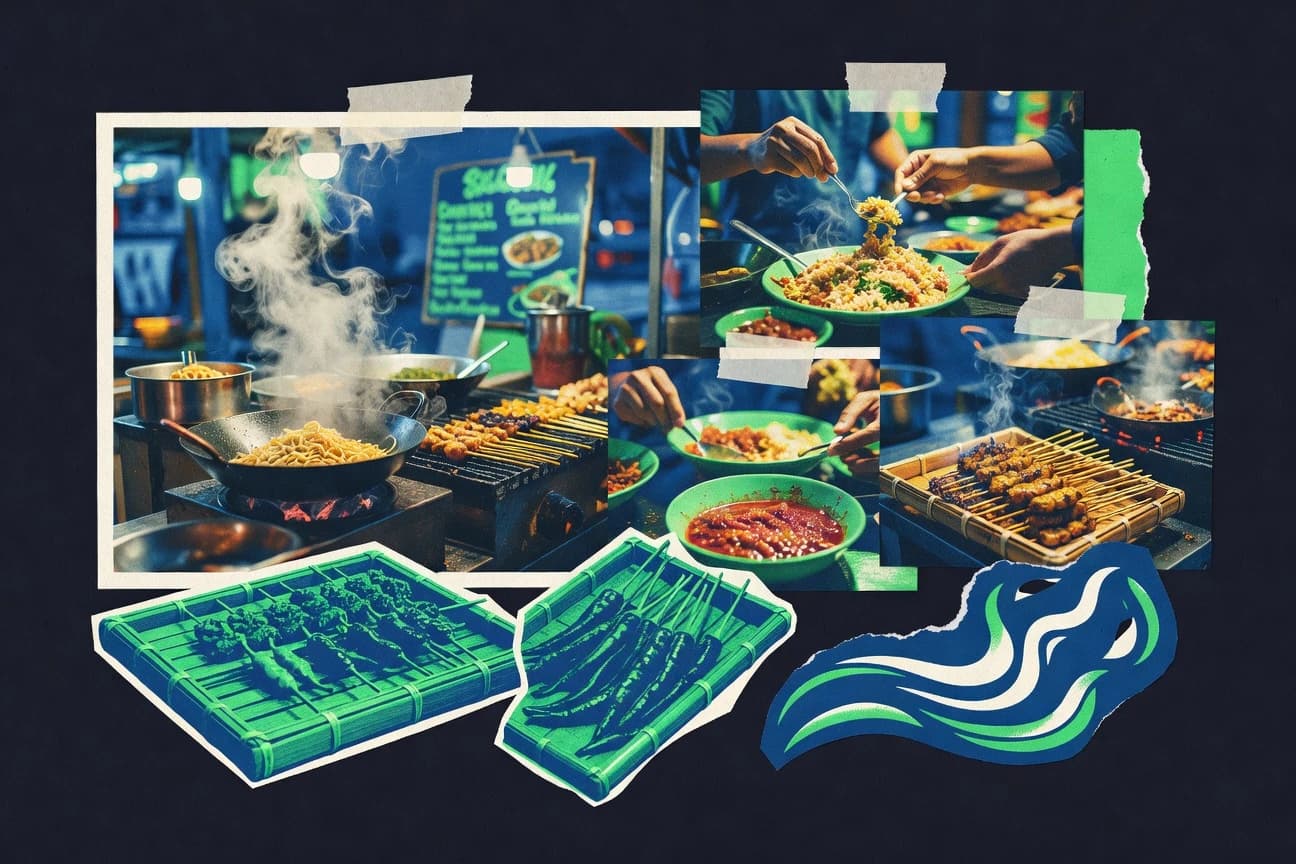

The Indonesian restaurant industry is evolving as customer segments reshuffle demand. Among 18–35-year-olds, 65% dine out at least twice a week and often look for local favorites like nasi goreng. Urban millennials account for 52% of patrons and spend about IDR 150,000 per visit, while female consumers’ halal preferences shape menu choices nationwide. These shifts connect with broader revenue growth, segment mix, and workforce realities across formal and informal outlets.
Key Takeaways
- 65% of Indonesians aged 18-35 dine out at least twice weekly, preferring local flavors like nasi goreng
- Urban millennials represent 52% of restaurant patrons, spending average IDR 150,000 per visit in 2023
- 78% of female consumers prefer halal-certified restaurants, influencing menu choices nationwide
- In 2023, the Indonesian restaurant industry generated total revenue of IDR 450 trillion, reflecting a 15% year-over-year growth fueled by post-pandemic recovery and rising disposable incomes in urban areas
- The quick-service restaurant (QSR) segment accounted for 42% of the total restaurant market share in Indonesia as of 2023, driven by chains like McDonald's and local brands like CFC
- Fine dining establishments contributed IDR 67.5 trillion to the industry revenue in 2022, representing 15% of the market amid luxury spending recovery
- In 2023, the industry employed 12.5 million workers, with 60% in informal warungs
- Average monthly wage for cooks is IDR 4.5 million, 20% higher in Jakarta
- Female workforce comprises 48% of restaurant staff, led by service roles at 65%
- The restaurant industry is projected to grow at 12% CAGR to IDR 800 trillion by 2028
- FDI in F&B reached USD 2.5 billion in 2023, targeting 200 new QSR outlets
- Sustainability investments to hit IDR 50 trillion by 2025 for green packaging
- Average table turnover rate in urban restaurants is 2.8 times per day, highest in QSR at 5.2
- Food cost percentage averages 32% of revenue in Indonesian restaurants, lowest in street food at 25%
- Delivery platforms handle 40% of orders, with average fulfillment time of 28 minutes in 2023
Indonesia’s restaurant industry is surging with strong urban and delivery demand, reaching IDR 450 trillion in 2023.
Related reading
01 · Category
Employment And Labor12 stats
01
In 2023, the industry employed 12.5 million workers, with 60% in informal warungs
02
Average monthly wage for cooks is IDR 4.5 million, 20% higher in Jakarta
03
Female workforce comprises 48% of restaurant staff, led by service roles at 65%
04
Youth employment (18-24) at 35%, with training programs covering 2 million annually
05
Turnover rate averages 28% yearly, highest in entry-level positions at 40%
06
Skilled chef shortage affects 25% of fine dining, with salaries up 15% YoY
07
Migrant workers from rural areas fill 20% of urban restaurant jobs
08
Union membership in 15% of chains improves benefits for 500,000 workers
09
Part-time staff ratio is 40%, peaking during holidays at 60%
10
Vocational training graduates supply 30% new hires, focusing on hygiene skills
11
Post-COVID, 1.2 million jobs recovered in 2023, with 70% in QSR segments
12
Delivery riders employed 800,000, earning average IDR 6M/month with incentives
Interpretation
Employment And Labor Interpretation
In Indonesia’s restaurant sector in 2023, 12.5 million workers relied heavily on informal warungs making up 60%, while youth employment sits at 35% and wages for cooks average IDR 4.5 million with Jakarta 20% higher, underscoring how labor informality and regional pay gaps are shaping Employment and Labor outcomes.
02 · Category
Consumer Demographics10 stats
01
65% of Indonesians aged 18-35 dine out at least twice weekly, preferring local flavors like nasi goreng
02
Urban millennials represent 52% of restaurant patrons, spending average IDR 150,000 per visit in 2023
03
78% of female consumers prefer halal-certified restaurants, influencing menu choices nationwide
04
Gen Z (born 1997-2012) accounts for 30% of delivery orders, favoring spicy and fusion foods
05
Middle-class households (income IDR 10-25M/month) drive 60% of casual dining visits, per 2023 survey
06
45% of restaurant-goers are families with children, seeking kid-friendly menus in Jakarta and Surabaya
07
Muslim consumers, 87% of population, prioritize sharia-compliant outlets, boosting 70% of market demand
08
Tourists contribute 22% of high-end restaurant visits, preferring international cuisines in Bali
09
Office workers aged 25-40 make up 35% of lunch-time crowds, averaging IDR 50,000 spend
10
55% of seniors (55+) opt for traditional warungs for health-focused local dishes daily
Interpretation
Consumer Demographics Interpretation
Within consumer demographics, Indonesians aged 18 to 35 and urban millennials dominate restaurant demand, with 65% dining out at least twice weekly and urban millennials making up 52% of patrons, while halal preferences and kid-friendly needs further shape what restaurants succeed in offering.
03 · Category
Investments And Future Projections10 stats
01
The restaurant industry is projected to grow at 12% CAGR to IDR 800 trillion by 2028
02
FDI in F&B reached USD 2.5 billion in 2023, targeting 200 new QSR outlets
03
Sustainability investments to hit IDR 50 trillion by 2025 for green packaging
04
Plant-based menu expansions expected in 40% of restaurants by 2026
05
Ghost kitchen networks to multiply 3x to 10,000 by 2027 amid urbanization
06
Halal tourism boosts restaurant investments by 25% annually to 2025
07
EV charging stations in 30% mall food courts by 2026 to attract eco-shoppers
08
VR dining experiences projected for 10% luxury outlets by 2028
09
Labor automation investments to save IDR 20 trillion opEx by 2030
10
Health-tech integrations like calorie trackers in 50% apps by 2027
Interpretation
Investments And Future Projections Interpretation
Indonesia’s restaurant sector is set to accelerate investment as it projects 12% CAGR to reach IDR 800 trillion by 2028, with foreign direct investment in F&B hitting USD 2.5 billion in 2023 and sustainability spending climbing toward IDR 50 trillion by 2025, signaling strong future growth momentum in the Investments and Future Projections category.
More related reading
04 · Category
Operational Statistics10 stats
01
Average table turnover rate in urban restaurants is 2.8 times per day, highest in QSR at 5.2
02
Food cost percentage averages 32% of revenue in Indonesian restaurants, lowest in street food at 25%
03
Delivery platforms handle 40% of orders, with average fulfillment time of 28 minutes in 2023
04
Staff-to-seat ratio is 1:12 in mid-tier restaurants, improving efficiency by 15% via training
05
Waste generation per restaurant averages 15kg/day, with 60% food waste recycled in Jakarta
06
Peak hour occupancy reaches 95% in malls from 12-2pm, dropping to 30% post-10pm
07
POS system adoption stands at 75%, reducing billing errors by 40% per outlet
08
Average check size grew 12% to IDR 120,000 in 2023 due to upselling desserts and drinks
09
Kitchen equipment maintenance costs 8% of opEx, highest for chains with imported gear
10
Customer satisfaction score averages 4.2/5, led by service speed in QSR segments
Interpretation
Operational Statistics Interpretation
Operationally, Indonesian restaurants are running with fast movement and tight cost control, with average table turnover at 2.8 times per day and food costing about 32% of revenue while delivery already accounts for 40% of orders.
05 · Category
Regional Distribution10 stats
01
Java island hosts 62% of all 1.2 million restaurants, with Jakarta alone having 150,000 outlets
02
Bali's restaurant density is 45 per 10,000 tourists, focusing on beachfront seafood spots
03
Sumatra contributes 18% of national outlets, led by Medan with 25,000 warungs
04
Sulawesi has 8% share, growing 20% YoY in Makassar due to port trade
05
Kalimantan restaurants number 45,000, 70% informal tied to oil industry workers
06
Papua region sees 5% growth in outlets, focusing on Papuan specialties in Jayapura
07
East Java (Surabaya) holds 12% national share with 140,000 establishments
08
Yogyakarta's 20,000+ cafes cater to students, 80% vegetarian-friendly
09
Bandung has 30,000 outlets, 40% street food emphasizing Sundanese cuisine
10
35% of restaurants in lesser Sunda islands are tourist-oriented seafood shacks
Interpretation
Regional Distribution Interpretation
Regional distribution is heavily concentrated as Java hosts 62% of Indonesia’s 1.2 million restaurants, while the rest of the archipelago plays catch up with faster pockets of growth like Sulawesi’s 20% year over year rise in Makassar and Papua’s 5% outlet expansion in Jayapura.
06 · Category
Overview29 stats
01
Casual dining chains expanded to 15,000 outlets nationwide in 2023, capturing 25% market
02
Coffee shops grew to 50,000 venues, 80% independent with Kopi Kenangan leading chains
03
Fine dining limited to 2,500 high-end spots, mostly in 5-star hotels in Java
04
Warung and street food dominate with 900,000 outlets, 75% in rural areas
05
Fast-casual segment at 8,000 outlets, growing 18% with healthy options
06
Buffet restaurants number 1,200, popular in corporate events with 90% halal
07
Bakery-cafes reached 12,000, integrating with 40% restaurant hybrids
08
Seafood specialists at 15,000 outlets, concentrated in coastal Sumatra and Sulawesi
09
Vegan/vegetarian eateries surged to 3,500, urban millennials driving 50% growth
10
Mall-based food courts host 40% of chain outlets, 20,000+ stalls total
11
Online ordering penetration is 68% in urban areas, with apps integrated in 85% of modern outlets
12
QR code menus used by 72% of restaurants, reducing paper costs by 50% since 2022
13
AI-powered inventory systems adopted by 25% of chains, cutting waste by 30%
14
Contactless payments account for 55% of transactions, peaking at 80% in Jakarta malls
15
Social media marketing drives 40% of bookings, with Instagram reels boosting 25% traffic
16
Cloud POS systems in 60% of mid-sized eateries enable real-time sales tracking
17
Delivery drone trials in Bali cover 15% of coastal orders, reducing time by 20 mins
18
Big data analytics used by 18% of chains for demand forecasting, improving accuracy 35%
19
NFT loyalty programs piloted in 5% premium restaurants, increasing repeat visits 22%
20
IoT sensors for fridge monitoring in 12% outlets prevent 40% spoilage losses
21
In 2023, the Indonesian restaurant industry generated total revenue of IDR 450 trillion, reflecting a 15% year-over-year growth fueled by post-pandemic recovery and rising disposable incomes in urban areas
22
The quick-service restaurant (QSR) segment accounted for 42% of the total restaurant market share in Indonesia as of 2023, driven by chains like McDonald's and local brands like CFC
23
Fine dining establishments contributed IDR 67.5 trillion to the industry revenue in 2022, representing 15% of the market amid luxury spending recovery
24
Street food vendors and warungs generated over IDR 200 trillion in informal revenue in 2023, comprising 45% of the overall F&B consumption
25
The cloud kitchen segment grew by 28% in revenue to IDR 35 trillion in 2023, boosted by delivery apps like GoFood
26
Hotel restaurants saw a 22% revenue increase to IDR 50 trillion in 2023 due to tourism rebound
27
Casual dining chains like Solaria reported IDR 12 billion in average annual revenue per outlet in 2023 across 500+ locations
28
Independent restaurants held 55% market share by revenue in 2023, outperforming chains in rural penetration
29
Beverage sales in restaurants surged 18% to IDR 90 trillion in 2023, led by coffee shop boom
Interpretation
Industry Overview Interpretation
Indonesia’s restaurant landscape in 2023 was overwhelmingly driven by everyday formats, with warung and street food reaching 900,000 outlets while casual dining chains expanded to 15,000 and coffee shops grew to 50,000, showing how mass market consumption continues to outpace niche fine dining at just 2,500 high end spots.
Reference
Cite This Report
This report is designed to be cited. We maintain stable URLs and versioned verification dates. Copy the format appropriate for your publication below.
APA
Elif Demirci. (2026, February 13). Indonesia Restaurant Industry Statistics. Gitnux. https://gitnux.org/indonesia-restaurant-industry-statistics
MLA
Elif Demirci. "Indonesia Restaurant Industry Statistics." Gitnux, 13 Feb 2026, https://gitnux.org/indonesia-restaurant-industry-statistics.
Chicago
Elif Demirci. 2026. "Indonesia Restaurant Industry Statistics." Gitnux. https://gitnux.org/indonesia-restaurant-industry-statistics.
Sources & references
56 datasets cited across this report
bps.go.id statista.com
 euromonitor.com
 worldbank.org
 mckinsey.comkemenparekraf.go.ididx.co.id
 nielsen.com
 kenresearch.commui.or.id
 gojek.comtripadvisor.co.id
 pewresearch.orgjobstreet.co.id
 who.intrestaurantbusinessasia.com
 fnbindonesia.com
 grab.comphri.or.iddlh.jakarta.go.id
 mallsindo.comitb.ac.id
 qsrmagazine.asia
 indofnb.comzomato.co.iddisparda.bali.go.idbpssumatra.go.idbpssulawesi.go.idbpskalimantan.go.idbpspapua.go.idbpsjawatimur.go.iddisparyogya.go.idbandung.go.id
 ibm.combankindonesia.go.id
 hootsuite.commoka.co.id
 google.com
 coindesk.com
 siemens.combkpm.go.id
 mordorintelligence.com
 globalmuslimtraveltourismindex.compln.co.id
 deloitte.comkemnaker.go.idprakerja.go.idakpar.or.idksbsi.or.idkemdikbud.go.id
 ilo.orgmichelin-guide.comeventindustrynews.asia
 ibisworld.comkkp.go.id
 happycow.net