GITNUX MARKETDATA
Browse Our Category
Food Service Restaurants
Latest update:

Ontario Restaurant Industry Statistics
Ontario diners stayed weekly at a 72% rate in 2023, even as average profit margins slid to 4.8% and restaurant costs kept climbing, making this page a sharp look at what is keeping the floor busy versus what is squeezing the bottom line. From 41% of Toronto area bookings made online to loyalty driving 18% of repeat visits, plus delivery reaching 22% of urban sales, these Ontario specific signals help operators spot where demand is shifting and where budgets must follow.
Philippines Restaurant Industry Statistics
See why weekly eating out has held steady at 15.0% of Filipino consumers and the QSR market is now pegged at PHP 35.0 billion while online food delivery is forecast to grow 12.0% annually through 2027, even as labor slack and payment delays squeeze restaurant operations. The page links consumer spend, loyalty behavior, and food safety compliance to pinpoint where demand is strongest and where restaurants in the Philippines still struggle to keep up.

Bbq Restaurant Industry Statistics
Monthly BBQ regulars are no small crowd since 68% of U.S. consumers ate BBQ at least once a month in the latest 2023 survey, yet what they order and how they want it is shifting fast. Between 61% hunting for gluten free options, satisfaction averaging 4.3 out of 5, and mobile ordering used by 81% of diners, this page connects consumer cravings, operational pressure points, and industry momentum like $12.4 billion in 2023 revenue and chains holding 42% market share into one clear picture of where BBQ restaurants are headed next.
South Africa Restaurant Industry Statistics
South Africa’s restaurant scene is recalibrating fast, with 2023 data showing online bookings taking 42% of reservations while the average lunch bill sits at R180 and the typical restaurant visit lands at R450. Follow how tipping, vegetarian and halal demand, load shedding, and delivery habits like R220 transactions are reshaping everything from menus to staffing and how much diners actually spend.
Brazil Food Service Industry Statistics
With Brazil’s electricity tariffs up 20.2% year over year in 2023 and food inflation running at 8.0% that same year, restaurant operating cost pressure is showing up fast, and 62% of operators are adjusting menu prices at least monthly. This page connects the full business squeeze to the scale behind it, from 1.016 million “restaurants e similares” and labor and social security baselines like the 20% employer INSS rate to delivery momentum with 1.47 billion orders in 2024 and 29% of food away from home spending shifting off premise.
Restaurant Revenue Statistics
Restaurant Revenue tracks where margins are really won and lost, from 12% of major delivery platforms using dynamic pricing pilots in 2024 to loyalty members now driving 34% of transactions for major U.S. brands. See how pay trends, hiring momentum, and revenue leakage from guest no shows and third party delivery fees are reshaping what restaurants can expect next.

Foodservice Distribution Industry Statistics
Track how a $4.9 trillion global foodservice market is reshaping US distribution, from 3.0 million contractor workers and 2.1 billion pounds of cold chain handling demand to faster, cleaner flows like a 14% jump in order accuracy from barcode scanning and a 46% cost hit from inventory carrying. The page also contrasts warehouse reality with planning signals, including 46% of logistics firms targeting more visibility investment while rework and returns still drive 3.9% of warehouse operating expenses.

Casual Dining Industry Statistics
Casual dining moves on thin margins and sharper tradeoffs, with median EBITDA at 12.0% in 2023 and food and beverage costs running 31% of restaurant sales on average. You will also find what is driving staffing and service decisions, including 5.4 million people employed in April 2024 and 38% of managers relying on formal temperature logs, alongside business pressure points like cost stress and the $1.2B annual fraud losses estimate.
Restaurant Success Statistics
Turn your restaurant into a 18 to 24 month profit story with margin benchmarks that separate the top 10 percent from everyone else, where 15 to 20 percent profit margins typically follow $2M+ revenue and tighter labor and food control. This page connects the numbers you can act on, from prime cost under 60 percent to online ordering up 30 percent, so you can see exactly which levers protect profit and which ones silently erase it.
Restaurants Industry Statistics
U.S. restaurant sales climbed to about $1.1 trillion in 2023, yet day to day choices are being reshaped by faster value demands and stricter expectations, from 55% of visits prioritizing value meals and 42% of diners seeking allergen free options to 67% reading online reviews before they arrive. Loyalty apps are already monthly for 73% of consumers, while off premise momentum still hits delivery orders averaging $28.50 and 54% preferring dine in after the pandemic, making the biggest question who wins the next meal.
Taiwan Restaurant Industry Statistics
Taiwan’s restaurant economy is being reshaped by a sharp mix of demand and cost pressure, from 67% of diners ordering by smartphone app and 92% on time same day delivery to a 8.6% 2023 jump in restaurant and catering service prices and a 26% share of consumers trading down as menus get pricier. You will also see how labor and hygiene expectations intersect, including 1.321 million workers in accommodation and food services, a 74% push for transparent online food safety information, and forecast momentum toward a 2028 foodservice market size of TWD 22.1 billion.
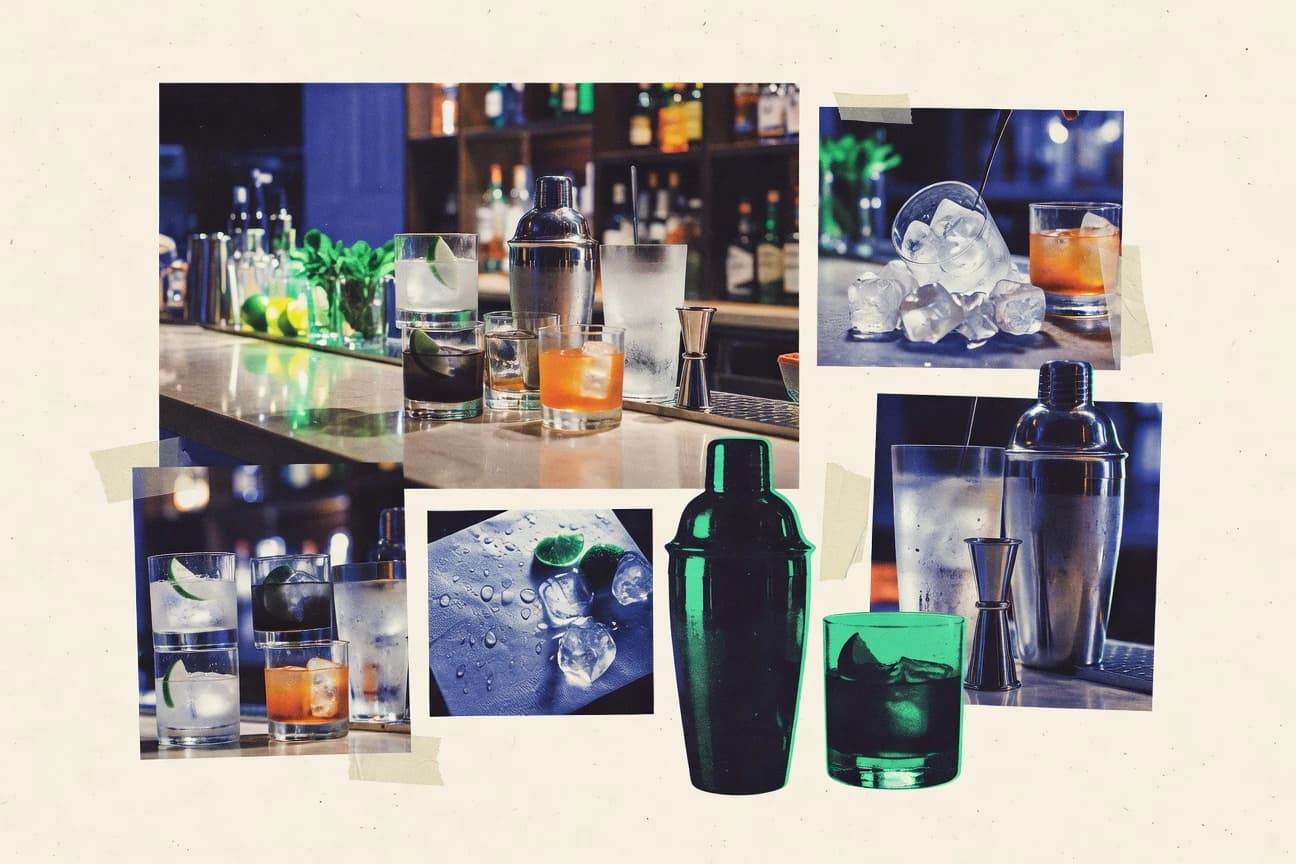
Cocktail Bar Industry Statistics
With the U.S. bar and nightclub industry pulling in $26.8 billion in 2024, cocktail bars have a clear category benchmark even as costs and consumer behavior shift, from food away from home up 4.1% in 2023 to alcoholic beverages up 7.5% the same year. You will also see why 86.8 million U.S. adults who drank in the past month are only part of the picture, with staffing pressure, binge drinking and responsible serving expectations, and reservation no show rates that can quietly swing a night’s bottom line.
China Catering Industry Statistics
China’s catering market keeps upgrading at a fast clip, with 4.0% year over year revenue growth in 2024 and chains holding 39.7% of the market in 2023, while day to day operations are being reshaped by real time tracking expectations and digital workflow gains like 12% higher order accuracy from kitchen display systems and 12% better table turnover from queue management. If you want to understand why margins, refunds, and even ingredient waste are shifting across Chinese restaurants and delivery platforms, these statistics connect customer behavior, merchant adoption, and cost control into one current performance snapshot.

Uae Restaurant Industry Statistics
UAE QSR revenue is projected to reach AED 3.0 billion by 2028, but restaurants are trying to keep pace as delivery coverage topped 4,000 locations by mid 2024 and 74% plan to add online ordering in 2025. This page connects what drives demand and pricing, including a 5% VAT and 9% corporate tax, with the cost pressures that can swing margins fast.
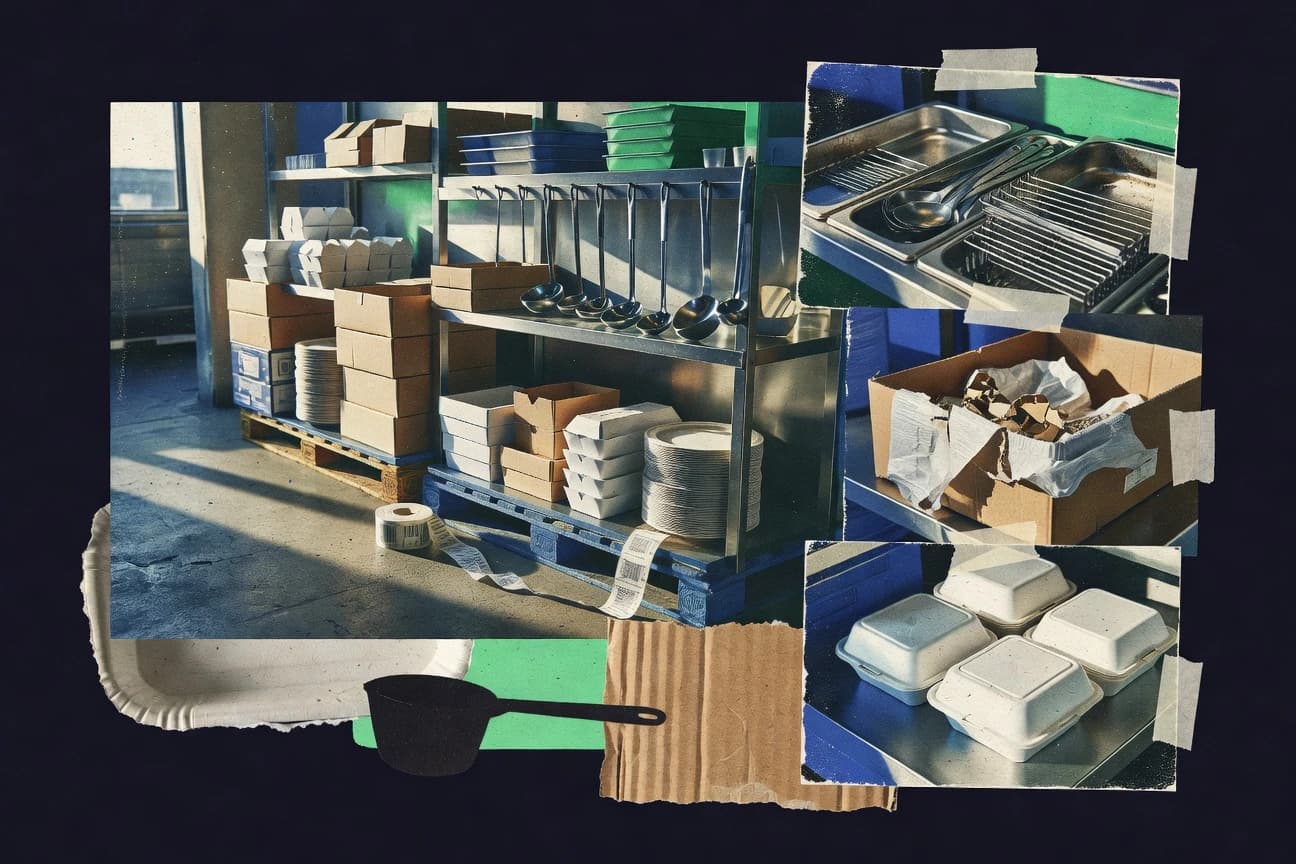
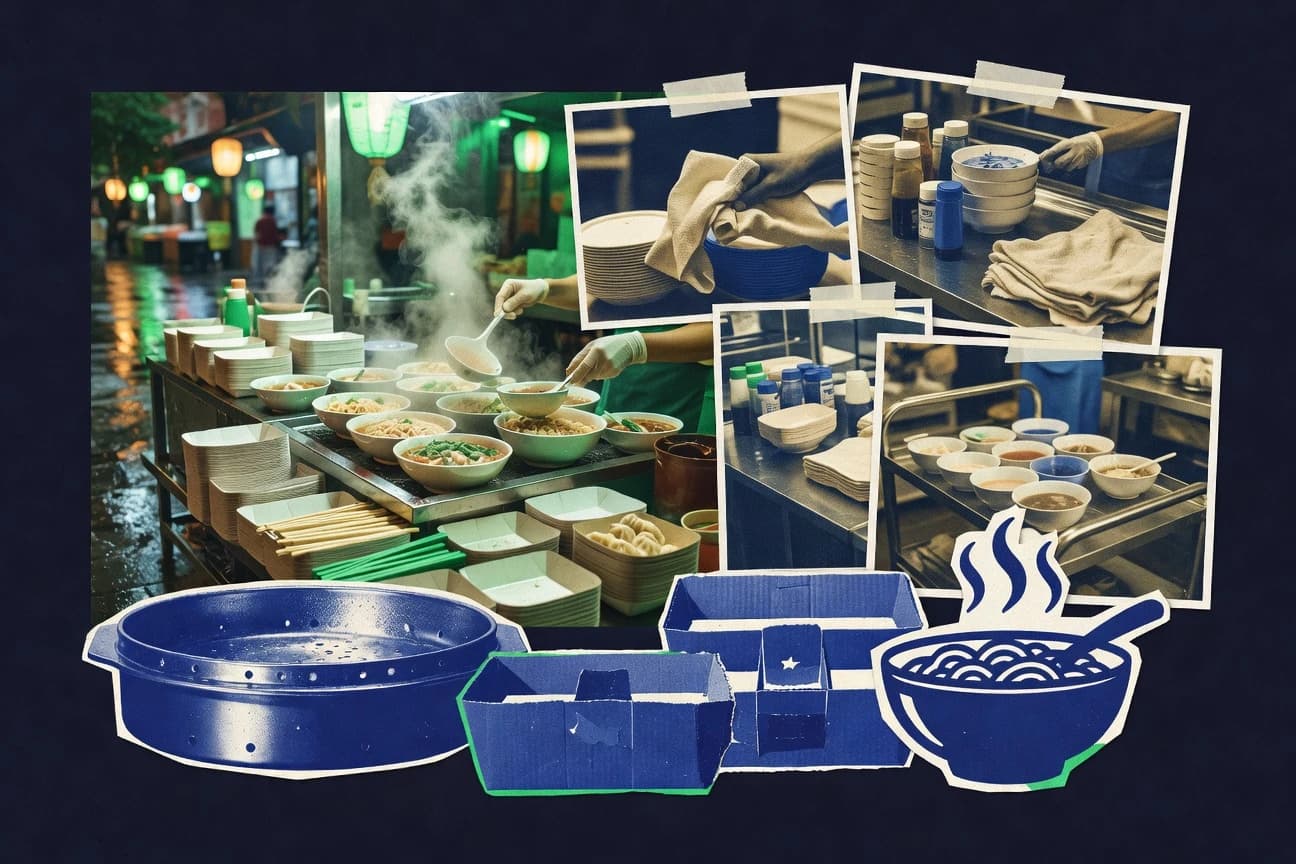
Restaurant Supply Industry Statistics
With the U.S. restaurant supply and equipment market still at $20.8 billion in 2024, operators are pushed to modernize everything from cloud back-of-house reporting and supplier portals to refrigeration and dishwashing that can cut water use and boost uptime. The page pairs hard procurement pressure drivers such as rising producer prices and labor cost spikes with quantified efficiency gains, showing exactly where the next investments are likely to land.
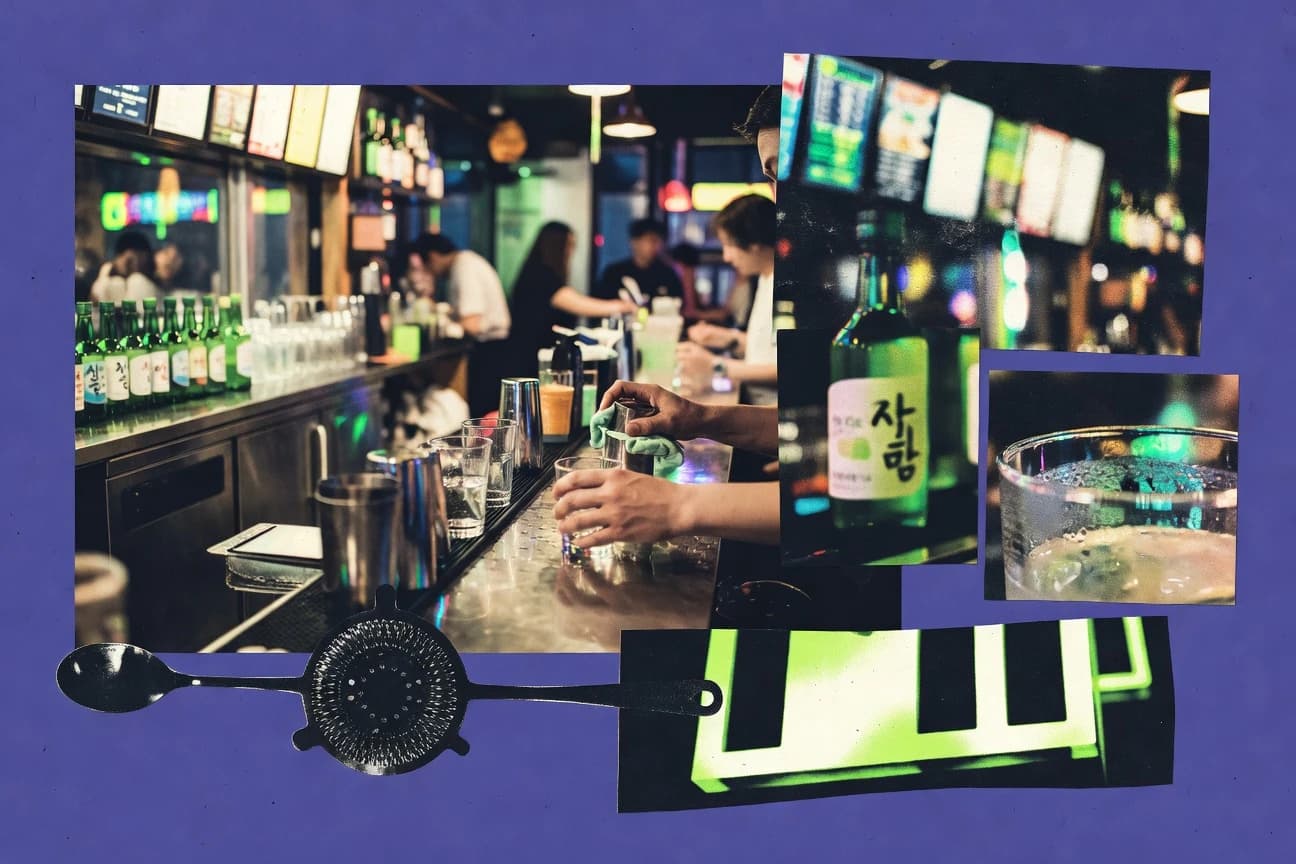
Korea Bar Industry Statistics
With South Korea’s alcohol specific CPI climbing 5.6% year over year in 2023 while corporate tax stays at 24.2% and commercial rents rise 3.8%, this page shows exactly how margin pressure is reshaping bar pricing and costs. It pairs that with the reality that 86% of consumers order via delivery apps and 21.5% of retail is online, so bar operators can benchmark where on premise demand holds and where it is being pulled off site.
Chef Statistics
Cloud and platform budgets are still climbing fast, with Gartner projecting worldwide public cloud end user spending to reach $675.4 billion in 2023 and PaaS spending hitting $151.1 billion in 2024, while containers are already mainstream at 75% of large enterprises. This makes Chef’s approach to configuration, compliance, and continuous automation feel less like a “nice to have” and more like the practical way to keep security and delivery from slipping into costly drift and audit drag.

Restaurant Customer Statistics
Nearly three in four restaurant consumers use online reviews to choose where to eat, yet a majority won’t return after poor ratings, and even a half star improvement can lift revenue by 5 to 9 percent. This page also weighs the real money behind delivery and operations, from $38.5 billion in 2023 online ordering sales to labor, utilities, and churn signals like a one hour service delay that raises the likelihood of losing customers by 20 percent.

Canada Restaurant Industry Statistics
Canadian restaurants moved fast in 2025, with loyalty programs shaping 55% of repeat visits and contactless payments now used by 88% of diners, while off premise sales reached 35% in suburbs and food costs averaged 32.5% of total expenses. See what that means for operators trying to balance higher mobile app use, rising energy costs, and shifting tastes for sustainable, gluten free, and plant based choices.
Texas Restaurant Industry Statistics
Texas diners stayed busy, dining out 4.8 times per week and spending $52 per outing in 2023, but the real shift shows up in how they buy with 32% takeout share and delivery orders up 28% to 1.2 billion. You will also find what drives choices and costs in Texas restaurants, from loyalty app habits and price sensitivity to $28.50 average full service checks and labor realities that shaped jobs across a market with 62,400 locations and over $128.5 billion in sales.