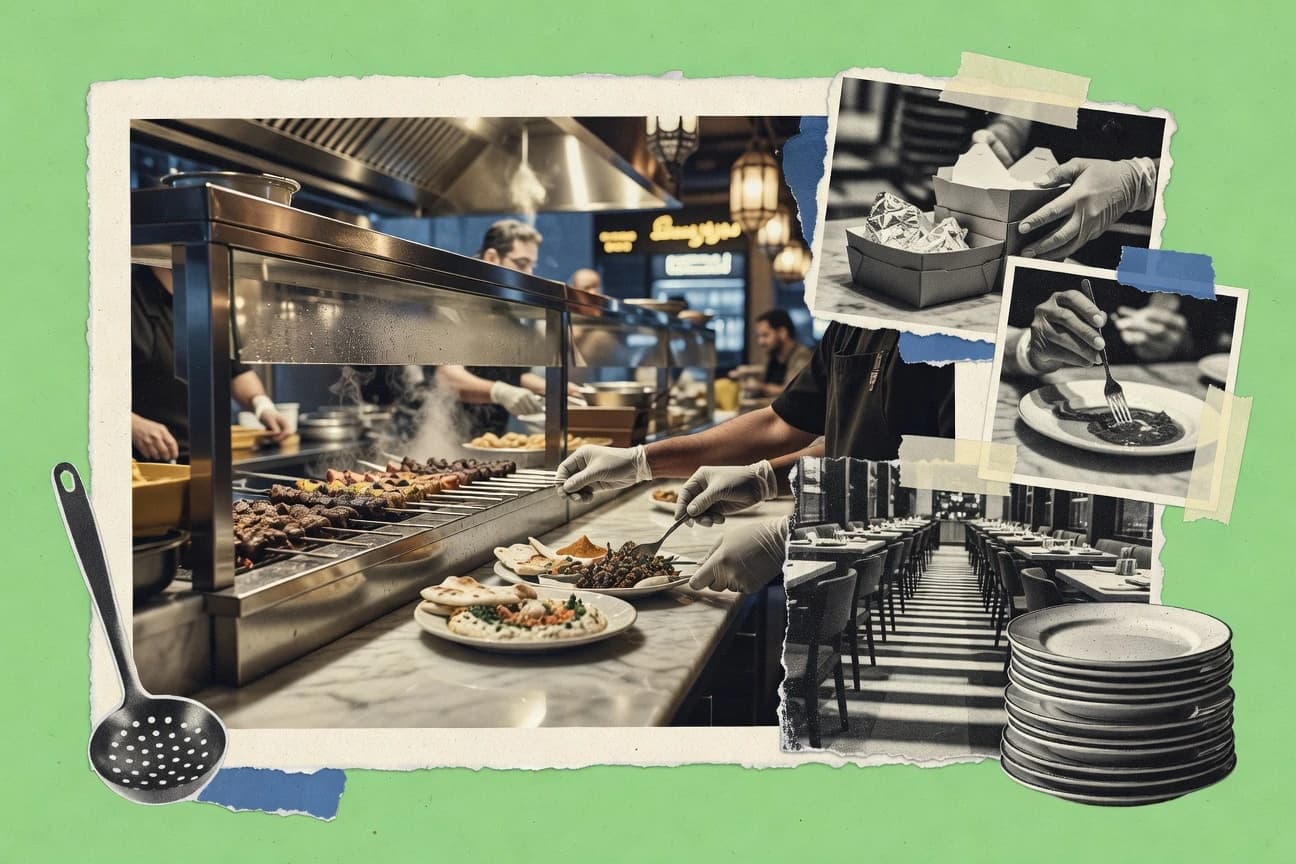

Dubai’s restaurant sector brought in AED 28.5 billion in 2023 and still keeps evolving fast, with quick service alone taking 42% of the market share worth AED 12 billion. Behind the growth, preferences are shifting, vegan orders via apps jumped 55%, and staffing remains a defining feature with 65% expatriate workers and chefs averaging AED 18,500 a month. This mix of demand, sustainability expectations, and operating realities makes the industry statistics worth a closer look.
Key Takeaways
- 62% of Dubai diners aged 25-44 in 2023 surveys.
- 78% of consumers prefer sustainable sourcing in Dubai restaurants 2023.
- Average dining out frequency: 4.2 times/month per person in Dubai 2023.
- Dubai restaurant industry employed 250,000 workers in 2023.
- 65% of Dubai restaurant staff were expatriates in 2023.
- Average salary for chefs in Dubai restaurants: AED 18,500/month in 2023.
- Dubai had 13,500 licensed restaurants as of end-2023.
- Fine dining establishments in Dubai numbered 1,200 in 2023.
- Quick service restaurants (QSR) outlets reached 4,200 in Dubai by 2023.
- Dubai's restaurant sector contributed AED 28.5 billion to the economy in 2023, representing 8.2% of the city's total GDP.
- The F&B market in Dubai grew by 15.4% annually from 2022 to 2023, driven by tourism recovery post-COVID.
- Dubai's restaurant industry is projected to reach AED 35.2 billion by 2027, with a CAGR of 11.2%.
- Dubai F&B sector generated AED 28.5 billion in total revenue in 2023.
- Average revenue per restaurant in Dubai: AED 2.1 million in 2023.
- Profit margins for Dubai QSRs averaged 18% in 2023.
Dubai’s booming restaurant sector in 2023 saw strong demand, sustainability preferences, and rapid vegan and QSR growth.
Related reading
01 · Category
Consumer And Trends25 stats
01
62% of Dubai diners aged 25-44 in 2023 surveys.
02
78% of consumers prefer sustainable sourcing in Dubai restaurants 2023.
03
Average dining out frequency: 4.2 times/month per person in Dubai 2023.
04
55% growth in vegan meal orders via apps in Dubai 2023.
05
92% of tourists dine out at least once during Dubai visit in 2023.
06
Health-conscious meals demand up 34% in Dubai 2023.
07
Online reservations account for 68% of bookings in Dubai 2023.
08
45% of diners seek Instagrammable dishes in Dubai 2023.
09
Family dining visits: 52% of total restaurant traffic in Dubai 2023.
10
Alcohol-free mocktail orders rose 41% in Dubai 2023.
11
73% prefer contactless payments in Dubai restaurants 2023.
12
Brunch is top meal choice for 61% of millennials in Dubai 2023.
13
Fusion cuisine popularity: 48% preference increase in Dubai 2023.
14
82% of expats dine out weekly in Dubai 2023.
15
Low-carb/keto options demanded by 29% of diners in Dubai 2023.
16
67% use delivery apps monthly for restaurant food in Dubai 2023.
17
Sustainable packaging preferred by 71% in Dubai 2023.
18
Group dining (4+ people): 39% of visits in Dubai 2023.
19
Plant-based meat adoption: 25% trial rate in Dubai 2023.
20
54% seek Michelin-starred experiences in Dubai 2023.
21
Peak dining time: 8-10 PM for 58% of Dubai customers 2023.
22
Allergy-friendly menus requested by 36% in Dubai 2023.
23
Live music dining boosts visits by 27% in Dubai 2023.
24
49% of Gen Z prioritize eco-friendly restaurants in Dubai 2023.
25
Seafood consumption per capita up 15% in Dubai diners 2023.
Interpretation
Consumer And Trends Interpretation
Dubai’s consumer trends are clearly moving toward health and values, with 78% of diners preferring sustainable sourcing in 2023 and demand for health-conscious meals rising 34% alongside a surge in vegan app orders of 55%.
02 · Category
Employment And Labor25 stats
01
Dubai restaurant industry employed 250,000 workers in 2023.
02
65% of Dubai restaurant staff were expatriates in 2023.
03
Average salary for chefs in Dubai restaurants: AED 18,500/month in 2023.
04
Female workforce in Dubai F&B rose to 28% in 2023.
05
Waitstaff jobs in Dubai restaurants: 85,000 positions in 2023.
06
Kitchen staff turnover rate: 22% in Dubai restaurants 2023.
07
15,000 new jobs created in Dubai F&B in 2023.
08
Managers in Dubai restaurants averaged AED 32,000/month salary 2023.
09
UAE nationals in Dubai F&B: 12% of total workforce 2023.
10
Bartenders employed: 12,500 in Dubai 2023.
11
Training programs completed by 45,000 F&B workers in Dubai 2023.
12
Part-time workers in Dubai restaurants: 35% of staff in 2023.
13
Sous-chefs salary average: AED 22,000/month in Dubai 2023.
14
Unemployment rate in Dubai F&B sector: 1.8% in 2023.
15
Delivery riders for restaurants: 28,000 in Dubai 2023.
16
Sommeliers employed: 1,200 in Dubai fine dining 2023.
17
Average work hours for F&B staff: 48 hours/week in Dubai 2023.
18
Skilled migrant workers visas for F&B: 65,000 issued in 2023.
19
Hostess/host positions: 18,000 in Dubai restaurants 2023.
20
Executive chefs: 3,500 employed in Dubai 2023.
21
F&B staff with certifications: 62% in Dubai 2023.
22
Cleaners and support staff: 40,000 in Dubai F&B 2023.
23
Pastry chefs: 4,200 in Dubai restaurants 2023.
24
Average age of F&B workers: 32 years in Dubai 2023.
25
Overtime pay compliance: 95% in Dubai restaurants 2023.
Interpretation
Employment And Labor Interpretation
In 2023, Dubai’s restaurant industry employed 250,000 workers and relied heavily on expatriate staff with 65% of the workforce, while female participation climbed to 28% and kitchen staff turnover reached 22%, signaling both a growing and highly mobile labor force within the sector.
03 · Category
Establishments And Outlets28 stats
01
Dubai had 13,500 licensed restaurants as of end-2023.
02
Fine dining establishments in Dubai numbered 1,200 in 2023.
03
Quick service restaurants (QSR) outlets reached 4,200 in Dubai by 2023.
04
Casual dining spots in Dubai totaled 3,800 in 2023.
05
Cloud kitchens operating in Dubai hit 1,500 in 2023.
06
Hotel-based restaurants in Dubai numbered 2,100 in 2023.
07
Asian cuisine restaurants in Dubai: 2,500 outlets in 2023.
08
Italian restaurants in Dubai reached 850 in 2023.
09
New restaurant openings in Dubai: 1,200 in 2023.
10
Coffee shops and cafes in Dubai: 3,200 in 2023.
11
Vegan/plant-based restaurants: 350 in Dubai 2023.
12
Mall-based food courts in Dubai had 450 outlets in 2023.
13
Street food stalls licensed in Dubai: 1,100 in 2023.
14
Arabic/Middle Eastern restaurants: 1,800 in Dubai 2023.
15
Seafood specialists in Dubai: 420 outlets in 2023.
16
Rooftop dining venues in Dubai: 250 in 2023.
17
Family-style restaurants in Dubai: 2,900 in 2023.
18
Pop-up restaurants hosted in Dubai: 180 in 2023.
19
Brunch spots in Dubai exceeded 500 outlets in 2023.
20
Japanese/Sushi bars in Dubai: 650 in 2023.
21
Bakery and patisserie shops: 1,050 in Dubai 2023.
22
Healthy eating outlets in Dubai: 780 in 2023.
23
Indian cuisine restaurants: 950 in Dubai 2023.
24
French bistros in Dubai: 320 outlets in 2023.
25
BBQ and grill houses: 580 in Dubai 2023.
26
Dessert-only shops in Dubai: 420 in 2023.
27
Fusion cuisine venues: 750 in Dubai 2023.
28
Lebanese restaurants: 1,200 in Dubai end-2023.
Interpretation
Establishments And Outlets Interpretation
Dubai’s “Establishments and Outlets” landscape is expanding quickly, with 13,500 licensed restaurants in 2023 and a strong spread across formats including 4,200 QSR outlets and 1,500 cloud kitchens.
More related reading
04 · Category
Market Size And Growth30 stats
01
Dubai's restaurant sector contributed AED 28.5 billion to the economy in 2023, representing 8.2% of the city's total GDP.
02
The F&B market in Dubai grew by 15.4% annually from 2022 to 2023, driven by tourism recovery post-COVID.
03
Dubai's restaurant industry is projected to reach AED 35.2 billion by 2027, with a CAGR of 11.2%.
04
In 2023, quick-service restaurants accounted for 42% of Dubai's F&B market share valued at AED 12 billion.
05
Dubai's fine dining segment expanded by 18.7% in 2023, generating AED 4.8 billion in sales.
06
The overall UAE F&B sector, with Dubai holding 55%, reached AED 52 billion in 2023.
07
Dubai restaurants saw a 22% increase in turnover in H1 2023 compared to H1 2022.
08
Cloud kitchen market in Dubai valued at AED 1.2 billion in 2023, growing 28% YoY.
09
Dubai's casual dining sector hit AED 9.5 billion in 2023, up 14% from previous year.
10
F&B investments in Dubai totaled AED 3.4 billion in 2023 for new openings.
11
Dubai restaurant market CAGR projected at 10.8% from 2023-2028.
12
In 2023, Dubai's F&B sector attracted 17 million tourist visits contributing to growth.
13
Dubai's restaurant revenue per capita reached AED 1,850 in 2023.
14
Full-service restaurants in Dubai generated AED 16.7 billion in 2023.
15
Dubai F&B market share in MENA region stood at 12.5% in 2023.
16
Street food vendors in Dubai contributed AED 850 million to F&B in 2023.
17
Dubai's restaurant industry recovery post-2022 was 125% of pre-pandemic levels.
18
Premium dining outlets in Dubai saw 20.3% growth to AED 3.2 billion in 2023.
19
Dubai F&B digital sales grew to AED 4.1 billion in 2023, 25% of total.
20
Dubai's restaurant sector employed capital worth AED 42 billion in 2023.
21
F&B market in Dubai expected to grow 13% in 2024 to AED 32.2 billion.
22
Dubai held 65% of UAE's total restaurant market value in 2023.
23
Vegan restaurant segment in Dubai reached AED 450 million in 2023.
24
Dubai's F&B export-related dining revenue was AED 2.1 billion in 2023.
25
Hotel restaurants in Dubai generated 38% of total F&B revenue in 2023.
26
Dubai restaurant industry saw 16.5% inflation-adjusted growth in 2023.
27
Independent restaurants in Dubai captured 55% market share in 2023.
28
Dubai F&B sector's productivity rose 9.2% to AED 250,000 per outlet in 2023.
29
Chain restaurants grew 19% in Dubai, adding AED 5.6 billion in 2023.
30
Dubai's restaurant market valuation hit USD 7.8 billion equivalent in 2023.
Interpretation
Market Size And Growth Interpretation
Dubai’s restaurant sector is not only a major GDP driver, contributing AED 28.5 billion in 2023, but is also expanding rapidly with the F and B market growing 15.4% from 2022 to 2023 and projected to reach AED 35.2 billion by 2027, reflecting strong market size and growth momentum.
05 · Category
Revenue And Financials24 stats
01
Dubai F&B sector generated AED 28.5 billion in total revenue in 2023.
02
Average revenue per restaurant in Dubai: AED 2.1 million in 2023.
03
Profit margins for Dubai QSRs averaged 18% in 2023.
04
Fine dining profit margins: 12.5% average in Dubai 2023.
05
Online delivery sales: AED 6.8 billion for Dubai restaurants in 2023.
06
Cost of goods sold (COGS) averaged 32% of revenue in Dubai F&B 2023.
07
Average check size in casual dining: AED 85 in Dubai 2023.
08
Fine dining average check: AED 450 per person in Dubai 2023.
09
Rental costs for prime locations: 15% of revenue in Dubai 2023.
10
EBITDA for top Dubai chains: 22% average in 2023.
11
Alcohol sales revenue: AED 3.2 billion in licensed Dubai venues 2023.
12
Breakfast/brunch revenue: AED 2.4 billion in Dubai 2023.
13
Lunch sales peak: 35% of daily revenue in Dubai restaurants 2023.
14
Dinner revenue share: 45% of total in Dubai F&B 2023.
15
Catering revenue for events: AED 1.9 billion in Dubai 2023.
16
Loyalty program revenue boost: 14% higher sales in Dubai 2023.
17
Tax contributions from F&B: AED 1.2 billion VAT in Dubai 2023.
18
Break-even occupancy rate: 65% for Dubai restaurants 2023.
19
Merchandise sales add-on: 5% of revenue in top Dubai spots 2023.
20
Private dining revenue: AED 850 million in Dubai 2023.
21
Seasonal promotions lifted revenue by 11% during Dubai Food Festival 2023.
22
Coffee/tea sales: AED 1.5 billion annually in Dubai cafes 2023.
23
Dessert upsell contribution: 8% of bill value in Dubai 2023.
24
Corporate event catering: AED 1.1 billion revenue Dubai 2023.
Interpretation
Revenue And Financials Interpretation
In Dubai’s Revenue and Financials landscape, the sector brought in AED 28.5 billion in 2023 with COGS at 32% of revenue and QSR profit margins averaging 18%, while online delivery sales reached AED 6.8 billion and helped support restaurants earning about AED 2.1 million on average.
report visual · Projection
Dubai diners and industry signals (2023)
Key consumer preferences and tech-driven behaviors show strong demand signals alongside industry growth markers.
15.4 Share / growth indicators (2022–2027, 2023 signals)
Start
-6.17%
CAGR · 5y
11.2 Share / growth indicators (2022–2027, 2023 signals)
Projected
20232028
Reference
Cite This Report
This report is designed to be cited. We maintain stable URLs and versioned verification dates. Copy the format appropriate for your publication below.
APA
Ryan Townsend. (2026, February 13). Dubai Restaurant Industry Statistics. Gitnux. https://gitnux.org/dubai-restaurant-industry-statistics
MLA
Ryan Townsend. "Dubai Restaurant Industry Statistics." Gitnux, 13 Feb 2026, https://gitnux.org/dubai-restaurant-industry-statistics.
Chicago
Ryan Townsend. 2026. "Dubai Restaurant Industry Statistics." Gitnux. https://gitnux.org/dubai-restaurant-industry-statistics.
Sources & references
100 datasets cited across this report · attribution is report-level