Market data
Facilities Property Services
Explore verified facilities property services statistics and market research reports with sourced data and trend analysis.
Latest update:
 Maya Johansson
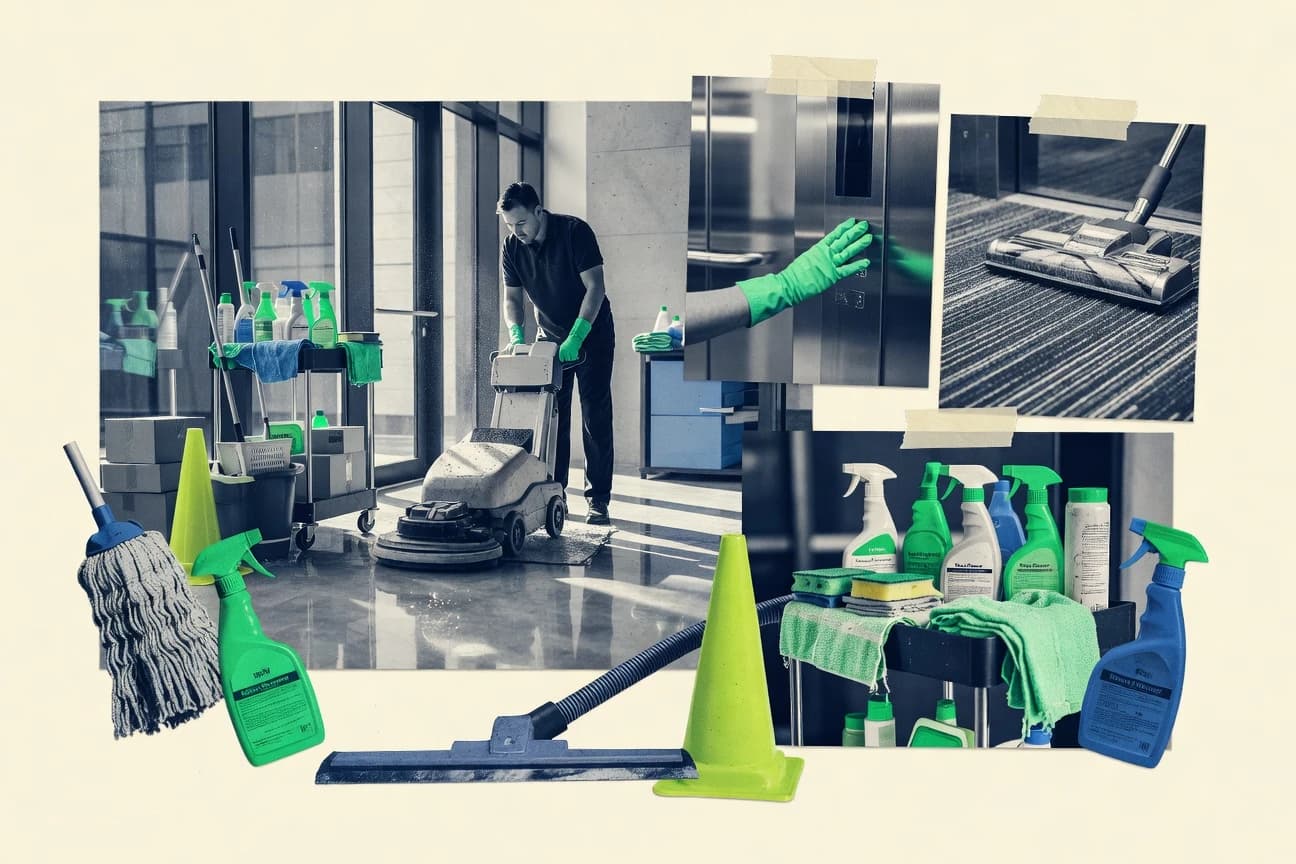
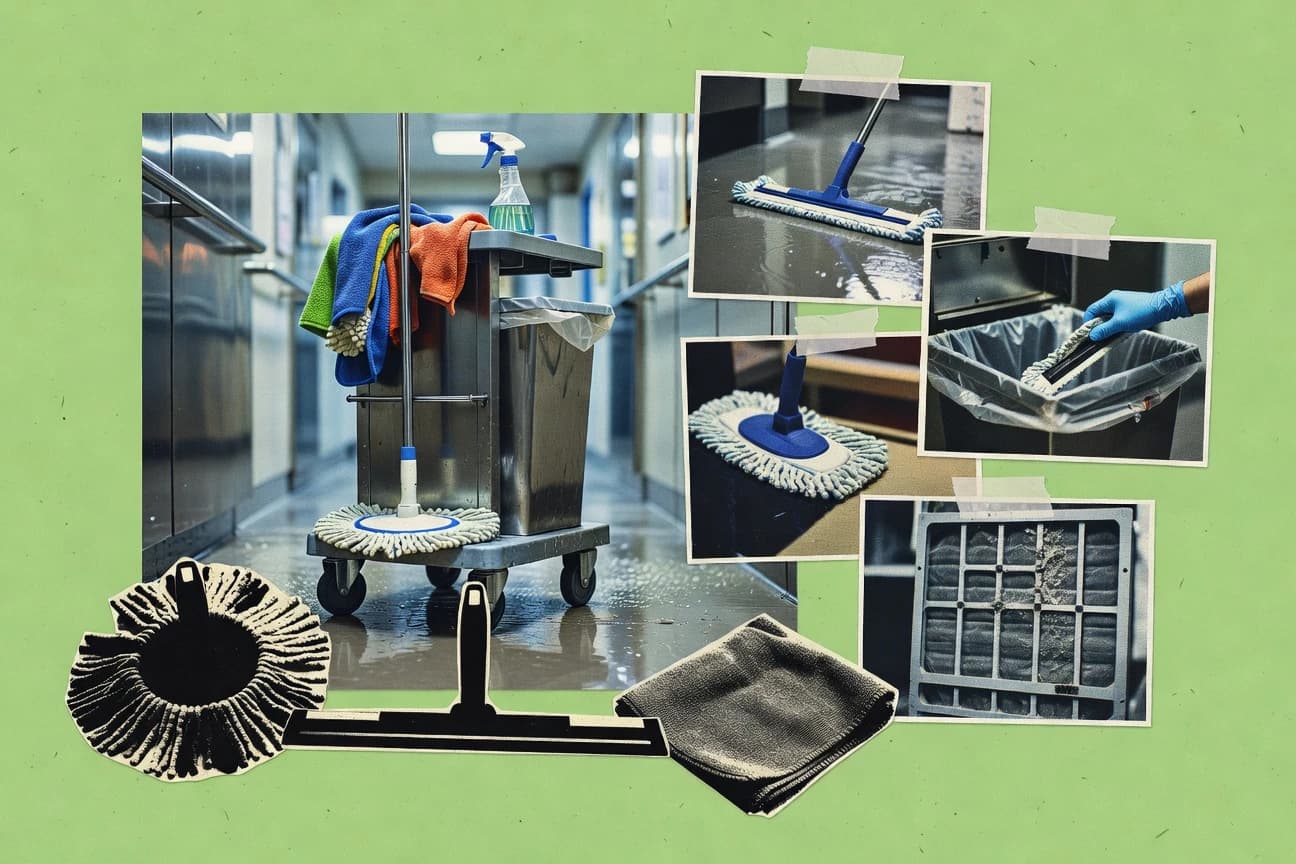
Cleaning Services Industry Statistics
Global industrial cleaning chemicals reached $36.2B in 2023—how today’s chemical and disinfection demand reshapes cleaning services.

Home Service Industry Statistics
Global home services reached $1.2T in 2023—see what’s driving growth and how homeowners book, from apps to online scheduling.

Landscaping Statistics
54% of U.S. homeowners hire landscapers in 2022—boost curb appeal without overspending. Discover typical costs, workforce trends, and eco options.
Japan Cleaning Industry Statistics
Online booking reached 28% of cleaning service bookings in 2023—see how demand shifts, key players operate, and tech and regulation are changing services.
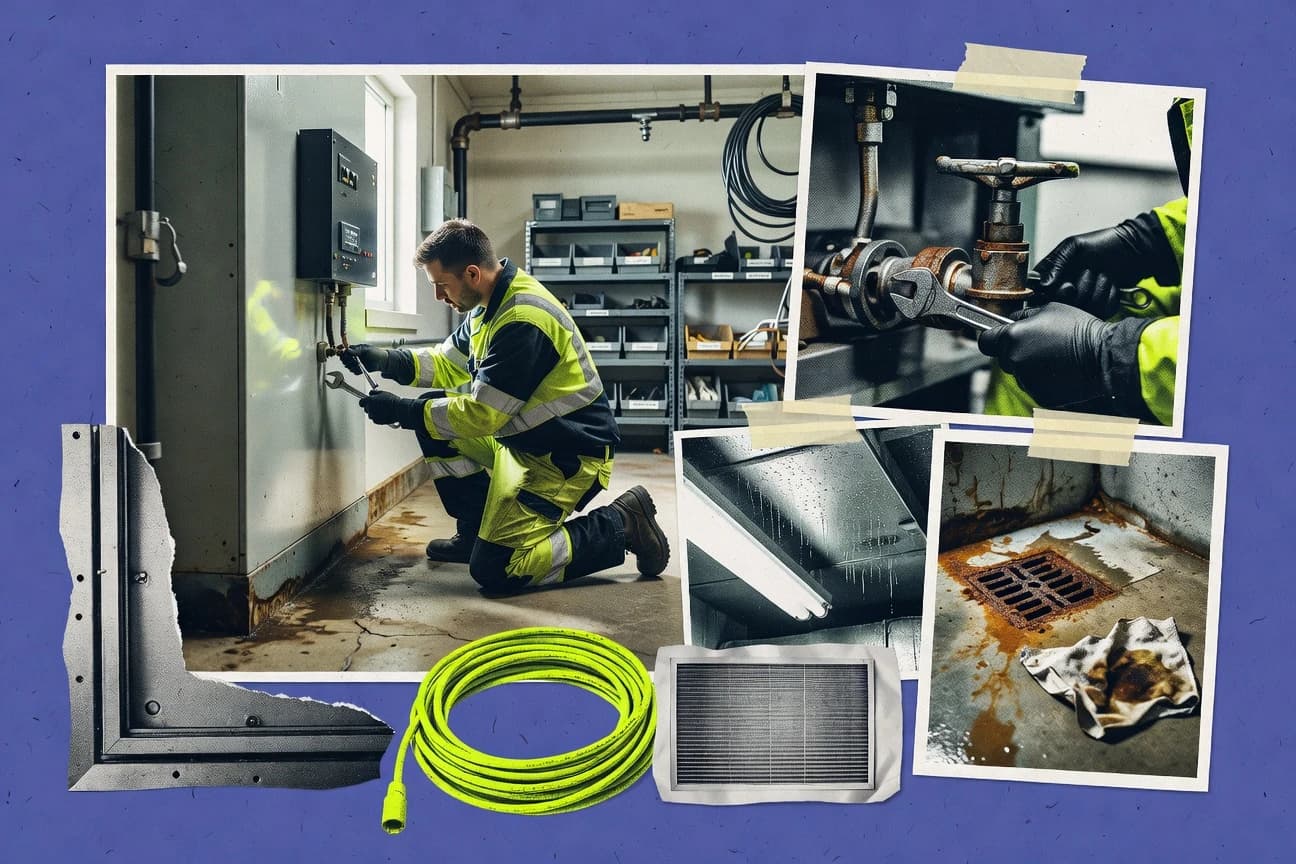
Facility Maintenance Industry Statistics
Global FM outsourcing can cut operational costs by 20–30%—average savings reach $1.2M per year. Explore what makes it work.

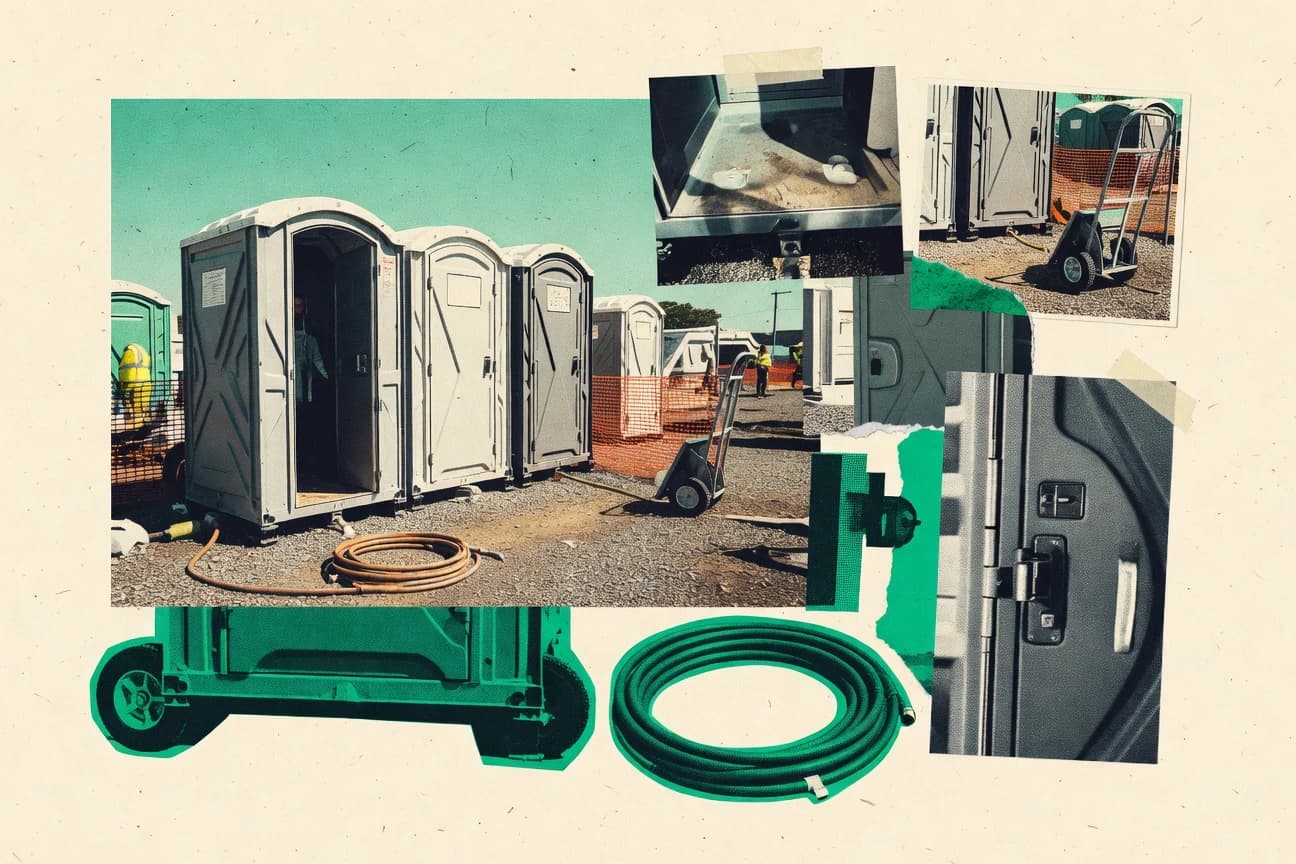
Portable Sanitation Industry Statistics
In the US, construction sites rent 4.2 million portable toilets each year—backing a $1.8B rental industry. Explore the numbers behind demand.
Portable Toilets Industry Statistics
Construction sites account for 45% of global portable toilet demand. Discover key market growth, hygiene upgrades, and regional trends—2023 to 2030.

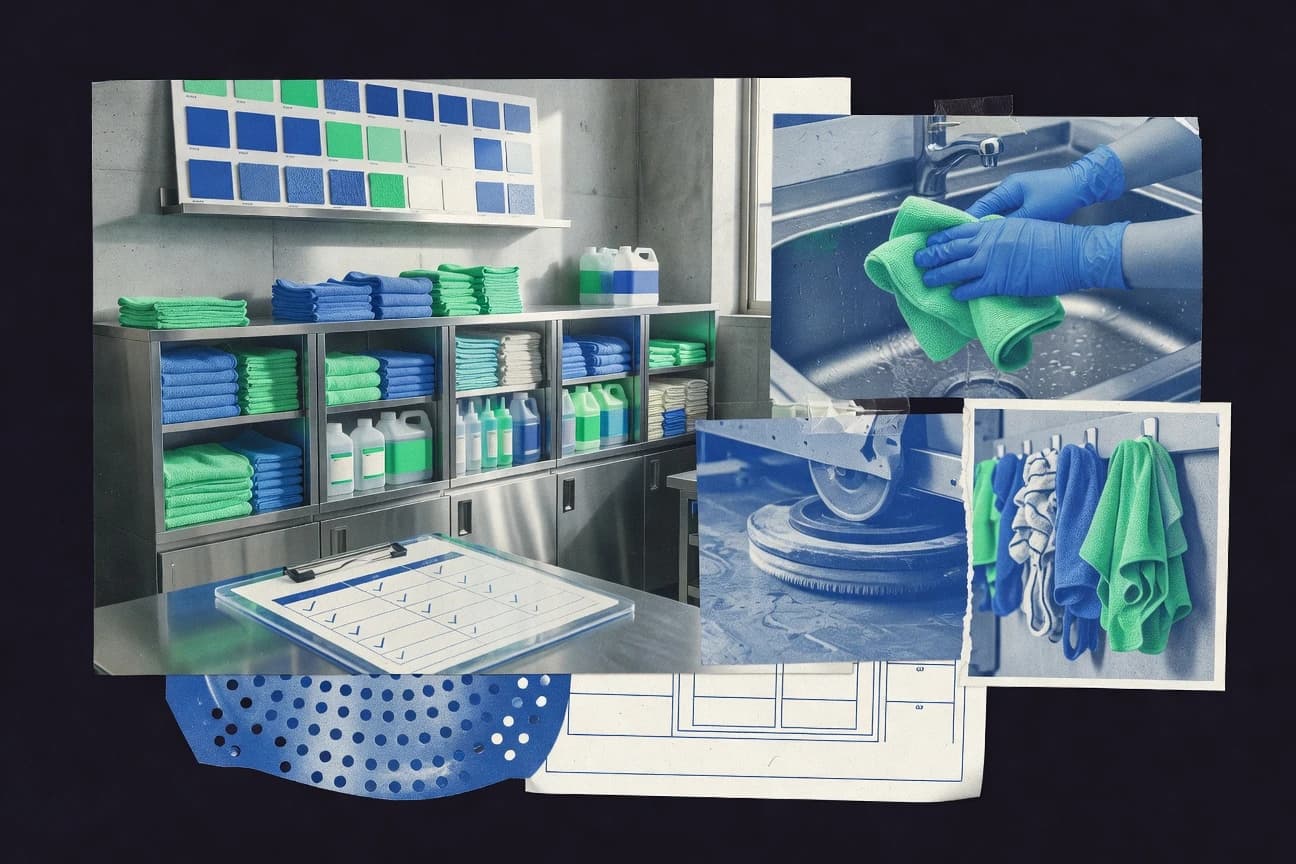
Sweden Cleaning Industry Statistics
SEK 45.2B in revenue in 2022 and up 4.8%—discover what’s fueling growth in Sweden’s cleaning market.

Robotics Cleaning Industry Statistics
iRobot leads robot vacuums with a 32% global market share in 2023—plus what that means for buying decisions and pricing in robotics cleaning.

Landscape Industry Statistics
Facility Services Industry Statistics
68% of facility managers use IoT for operations in 2023—see what smarter monitoring means for costs and service reliability in Facility Services.
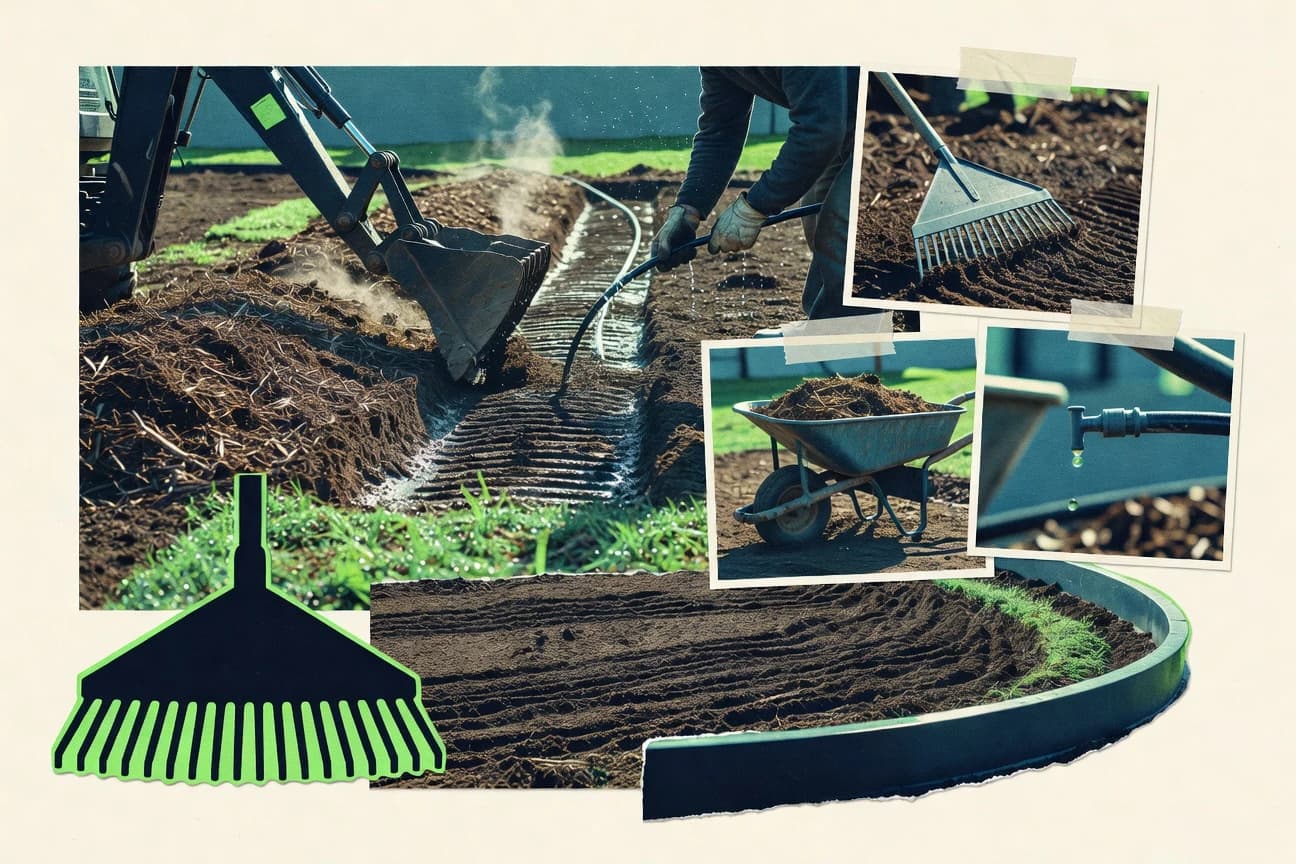
Landscaping Industry Statistics
72% of homeowners prefer eco-friendly landscaping—see how that shapes hiring, spend, and local job demand.
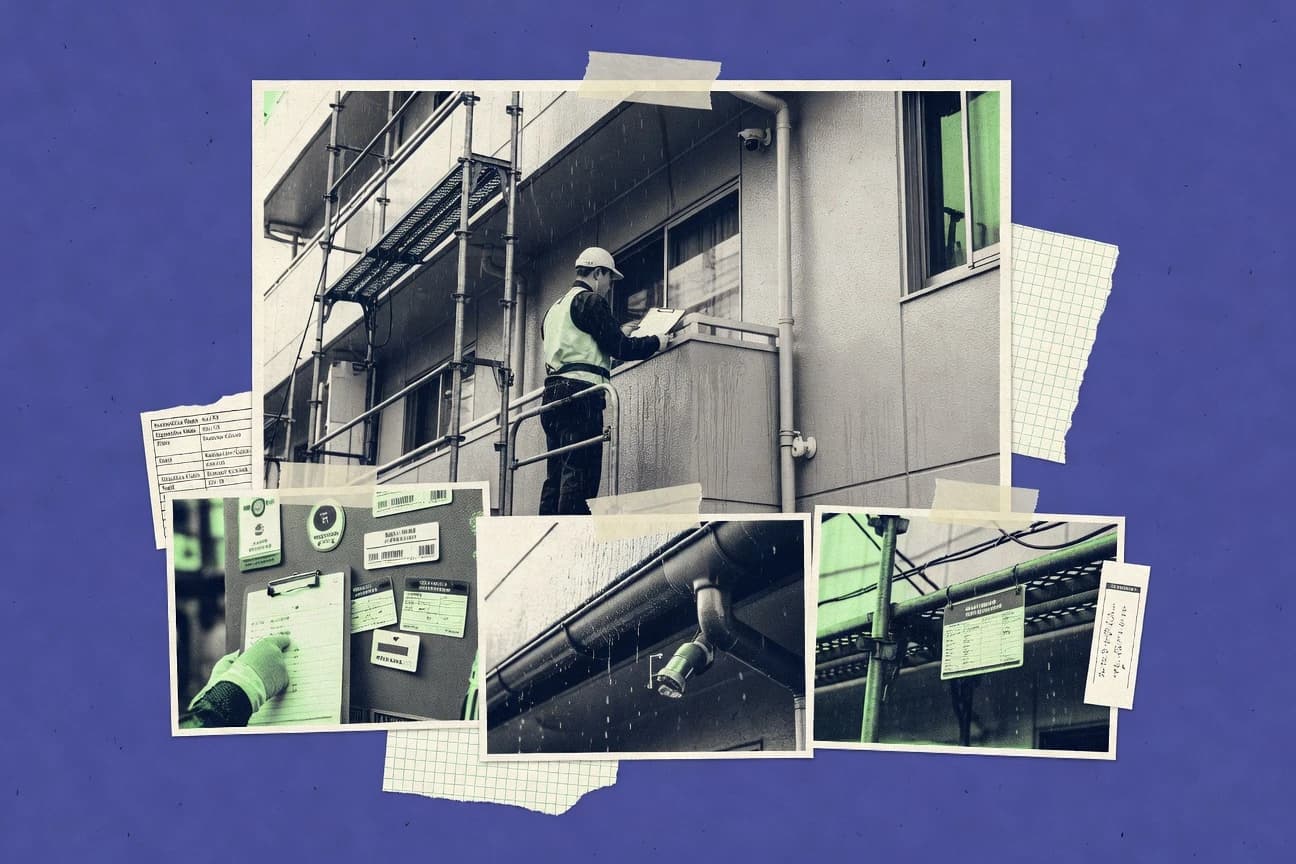
Japan Building Maintenance Industry Statistics
Japan’s building maintenance firms run on an 8.2% average profit margin—see how margins link to equipment spending, compliance demand, and smarter maintenance strategies.
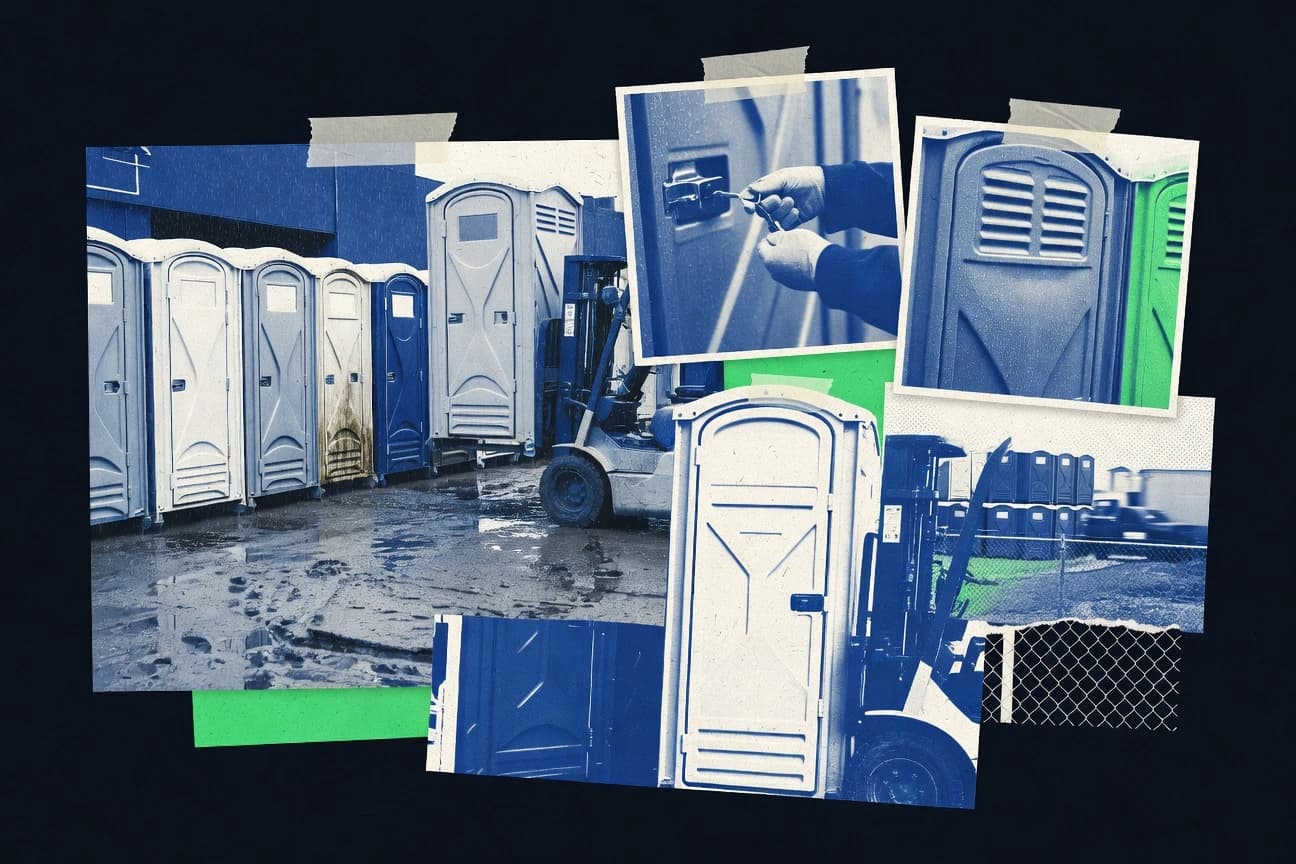
Portable Restroom Industry Statistics
U.S. portable restroom rental revenue hit about $1.2 billion in 2023—see how costs, servicing, and demand shape the market.

Window Cleaning Industry Statistics
From a $45.2 billion global market valued in 2022 that is forecast to reach $68.7 billion by 2030, window cleaning is growing fast while working conditions lag, with 40% of window cleaners worldwide still lacking formal certification. See how U.S. services generated $2.8 billion in 2023 alongside 5,200 annual job openings, and where safety risks and new tools like water-fed poles and robotic systems are reshaping the trade.
Pest Control Statistics
With European market share holding at 25.0% and North America at 30.0%, the page connects regional demand to real pricing, where a U.S. bed bug treatment can run $1,500 to $3,000 but heat trials report 98% reduction after one cycle. You will also see how integrated pest management lands near a 70% average efficacy and why growers of tech are the ones most likely to adopt digital tools across their service operations by 2024.

Home Services Industry Statistics
Residential home services are pushing into next year with a 3.7% forecast growth for U.S. home improvement in 2024 and a $432.0 billion remodeling market, but customer expectations are tightening fast so speed, estimating accuracy, and customer experience can make or break profitability. With 75% of consumers relying on online reviews and 84% searching online for providers, while only 31% of field workers use mobile apps and contractors report 21% of profitability trouble tied to estimating accuracy, this page shows exactly where demand meets operational gaps.
Elevator Maintenance Industry Statistics
With the US Elevator & Escalator Services market projected to reach $6.2B, this page tracks how shifting from reactive to preventive and predictive maintenance is cutting downtime by up to 31% and raising MTBF by 15%, even as the installed base keeps expanding. It also puts hard safety pressure front and center, from response time targets of 4 hours and thousands of entrapment incidents in state and European datasets to reliability findings showing 80% of downtime can hinge on a small set of components.
Facility Management Industry Statistics
From a 20% rise in facilities management software spend intent in 2024 to 61% of FM software users reporting better integration and 48% using mobile work order tools for faster repairs, this page pinpoints what actually moves performance. It also contrasts cost pressure and operational reality with 9.6% higher US maintenance and repair costs and the safety stakes behind 3.1 million occupational injuries, so you can see where IWMS and CMMS adoption is helping and where it is not.

Pool Maintenance Industry Statistics
With the U.S. pool maintenance industry up 12% since 2020 and employing 45,000 workers in 2023, the biggest surprise is how hard it still is to keep talent steady, with 18% annual technician turnover and seasonal demand sending jobs from 60,000 in summer down 40% off-season. From CPO certification boosting earnings by 15% to service tech wages averaging $22.50 an hour and automation software lifting productivity by 30%, this page puts the real cost of doing pool work beside the fastest ways companies are improving schedules, compliance, and margins.