GITNUX MARKETDATA
Browse Our Category
Facilities Property Services
Latest update:

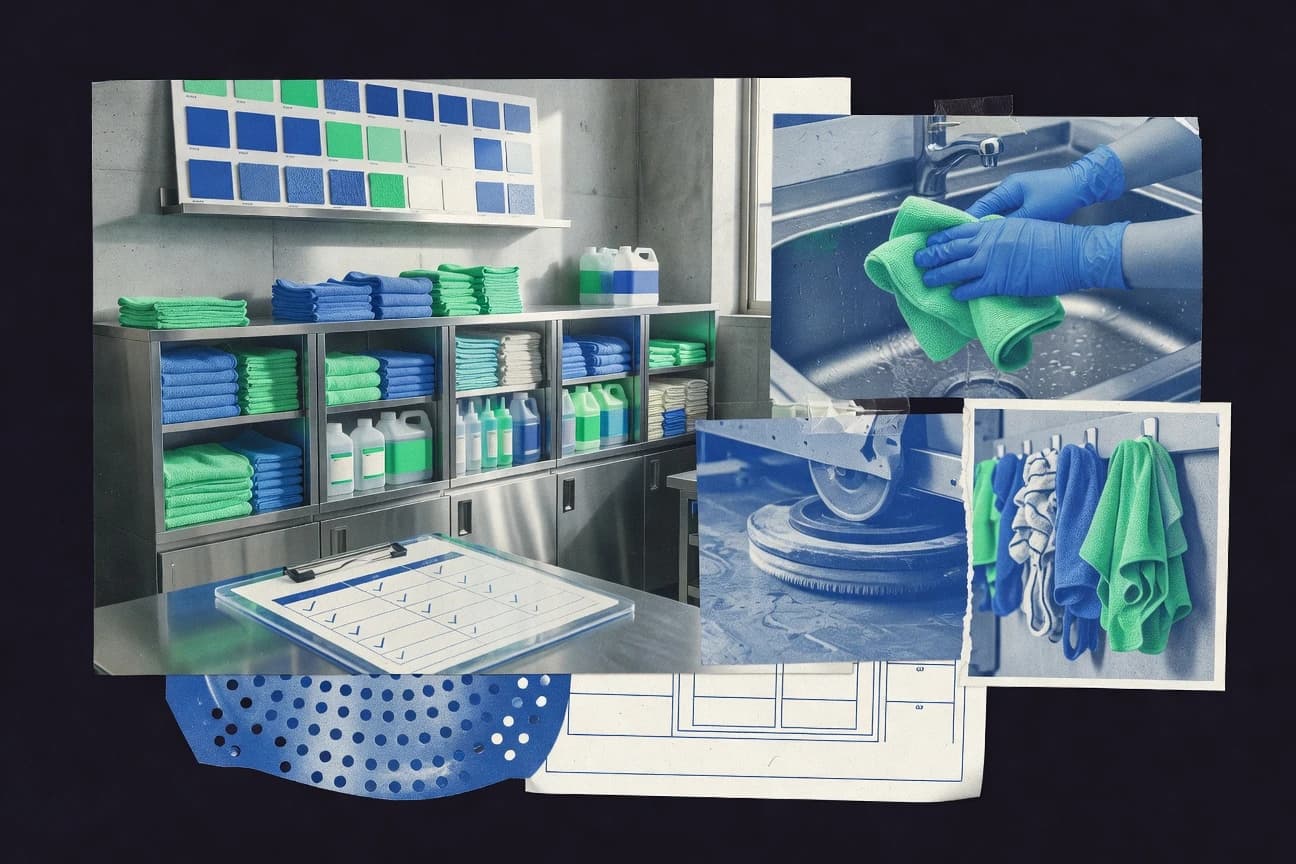
Japan Cleaning Industry Statistics
Japan’s cleaning industry is bigger than many expect, employing 2.8 million workers and driving a market projected to grow steadily from 2023 to 2030, while household behavior shifts fast with online booking at 28% of all reservations and eco-friendly product preference hitting 42%. Use this page to see how giants and innovators are reshaping everything from 8% facility cleaning share and 450 billion yen cleaning agents sales to UV-C robots, waterless tech growth, and tougher hygiene and sustainability rules that now reach the supply chain.
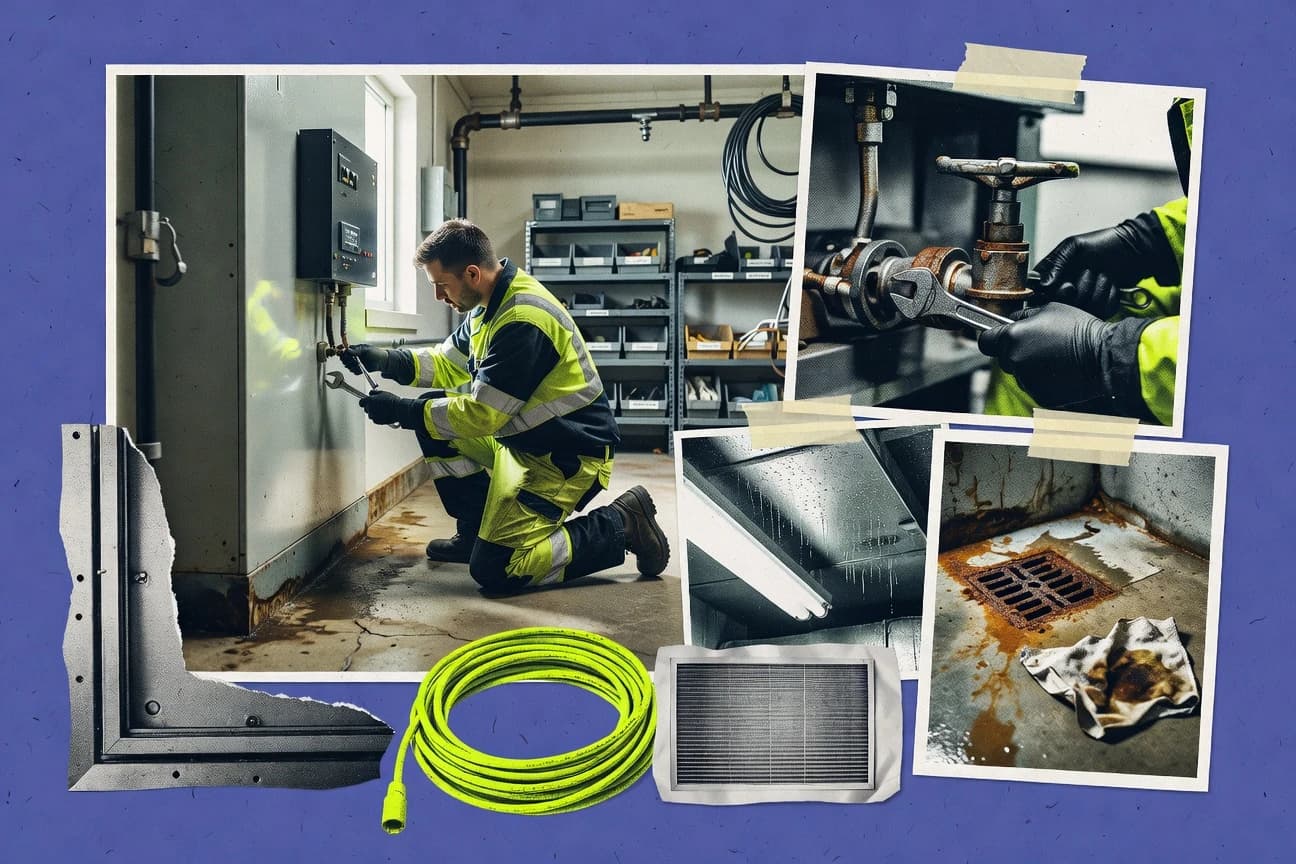
Facility Maintenance Industry Statistics
Facilities are paying attention to efficiency and risk, with predictive maintenance delivering an average 10:1 ROI and $630K saved per facility in 2023, even as cyber threats to FM systems jumped 47% that same year. This page connects the cost pressures, workforce realities, and fast-rising tech adoption from IoT sensor coverage growing to 65% of US facilities in 2023 to global reactive maintenance still taking 52% of spend, so you can see where savings are most likely to stick.
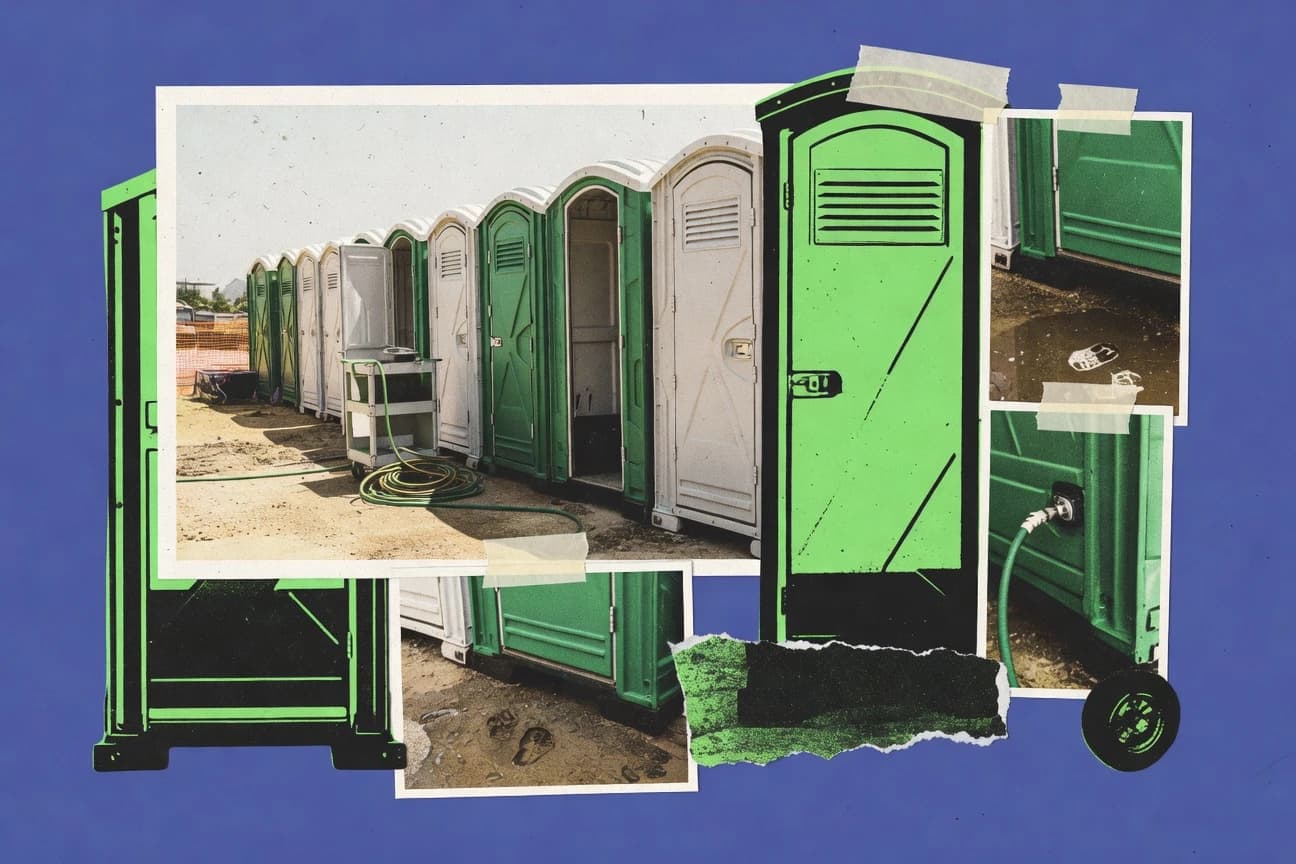
Portable Sanitation Industry Statistics
Portable sanitation is a 2022 to 2023 workforce and revenue engine, employing 45,000 people in the US in 2023 and 250,000 workers globally in 2022 while the market hit USD 12.5 billion worldwide in 2022 and is projected to climb to USD 18.7 billion by 2030. But behind that growth sit concrete tradeoffs like a US 18% annual turnover rate and a 65% US certification rate that explain why training and safety metrics matter as much as new unit and equipment demand.
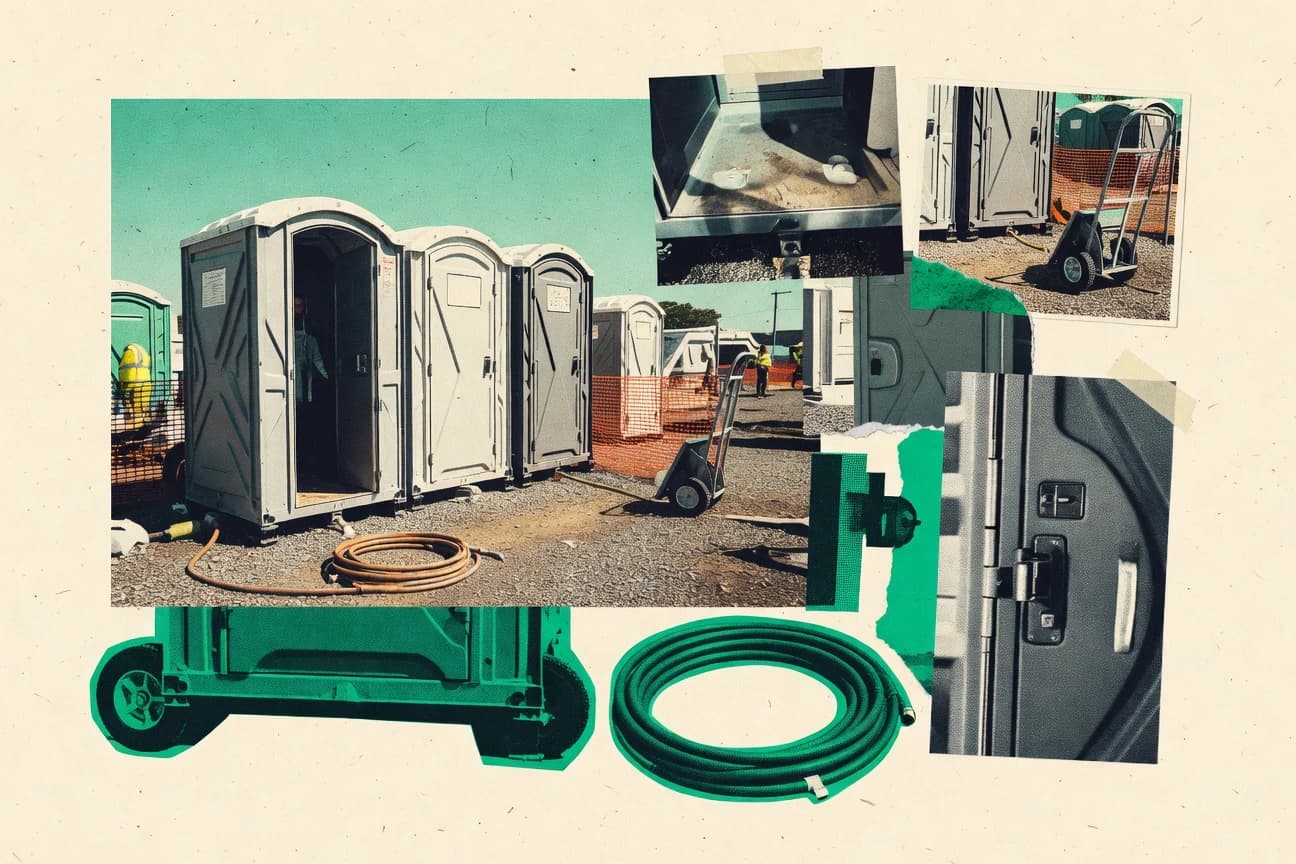
Portable Toilets Industry Statistics
Portable toilets demand is shifting fast as the global market is projected to reach USD 20.45 billion by 2030 at a 6.1% CAGR, with construction still driving 45% of usage while events take 28% and disaster relief remains a smaller but critical 5%. See how that plays out on the ground, from Europe music festivals needing 300,000 units per season to the rising standard features like hand sanitizer in 65% of portable toilets and IoT monitoring in 15% of new units in 2023.

Sweden Cleaning Industry Statistics
With Sweden’s cleaning market projected to reach SEK 49.8 billion by 2025, this page maps how concentration and scale coexist with a business base of mostly local SMEs, from top firms and IS service share to 12,450 registered companies in 2023. You also get practical workforce and service signals, including 85,000 full time equivalents in 2022, 92% of firms with websites, and rising demand shifts like office cleaning down 25% from remote work impacts.
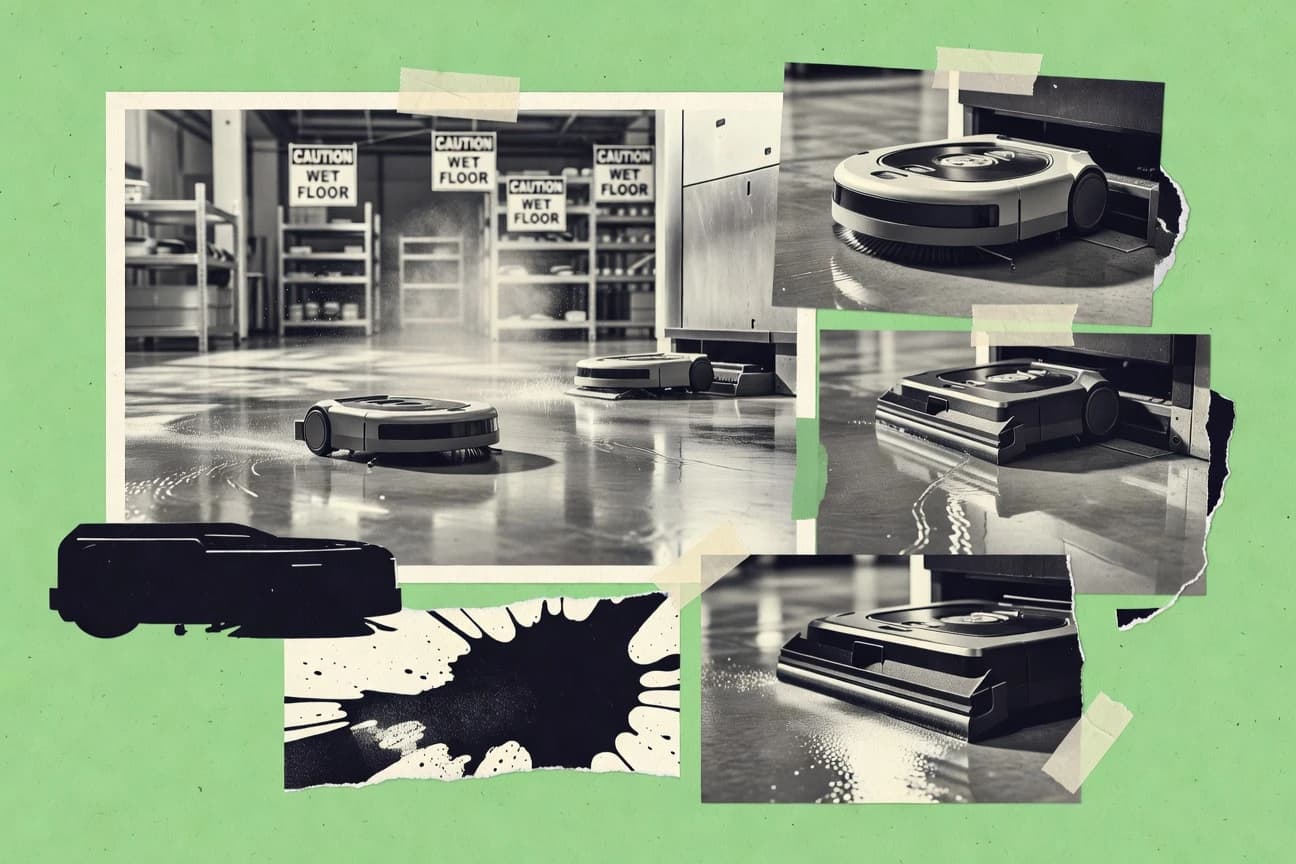
Robotics Cleaning Industry Statistics
Robot cleaning is no longer a novelty with 45% of US households owning a robot vacuum and 22% shipment growth in North America in 2023, yet offices still report a 42% drop in manual cleaning time, reshaping expectations beyond home floors. Track how adoption spreads from UV disinfection in 35% of US hospitals to solar cleaning at 32.4% CAGR through 2029, plus who is winning the race with Roomba at 45% US share and a fast surge in Asia Pacific robot vacuum momentum.
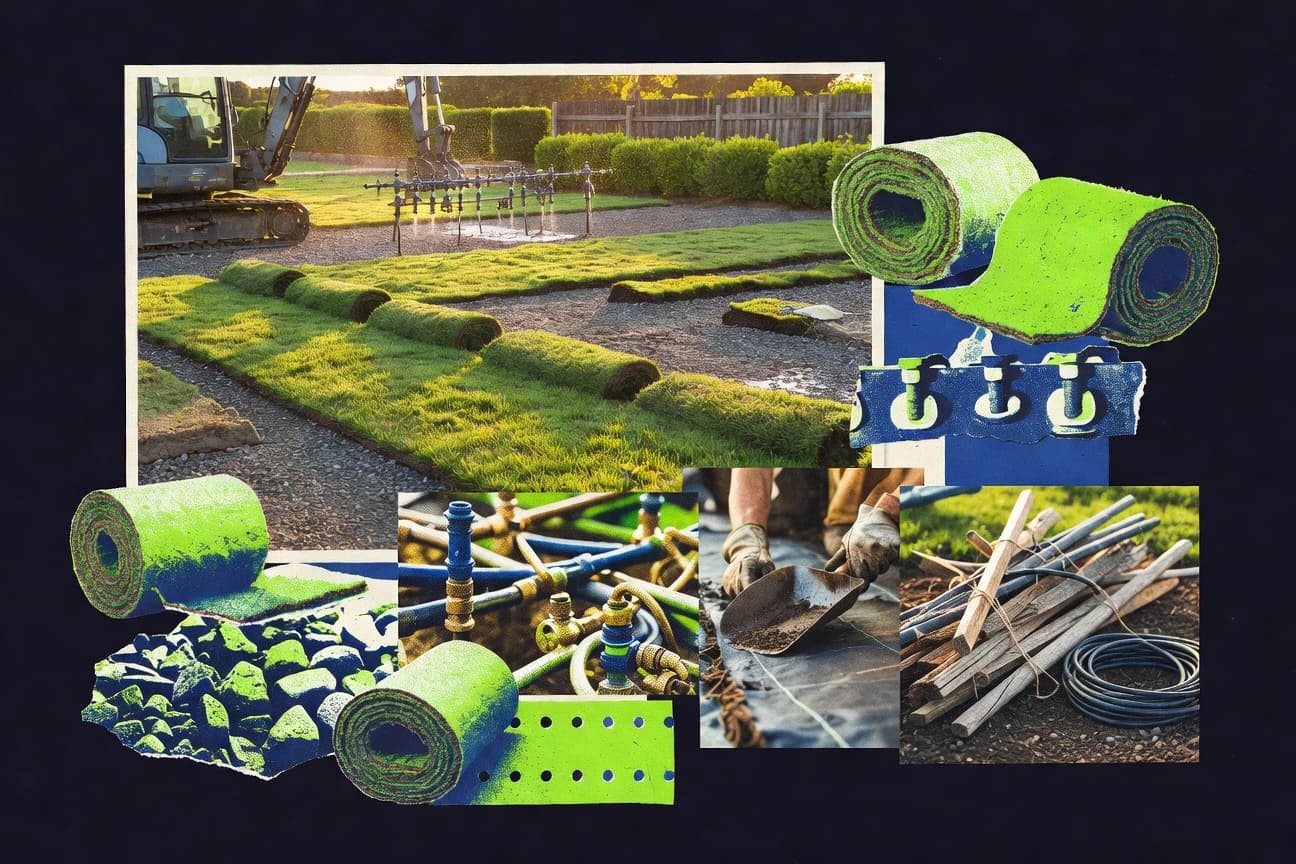
Landscape Industry Statistics
With 1.2 million people employed in US landscaping in 2023 and a 45% annual turnover rate, this page tracks how firms keep operating while 65% report labor shortages and wages average $18.50 per hour, alongside growth signals like 22% job projection for 2022 to 2032. It also connects sustainability and smart equipment to real market pressure, from 80% water use reduction with smart irrigation to soaring adoption of electric gear and AI design tools, showing where the next competitive advantage will come from.
Facility Services Industry Statistics
Facility management is forecast to grow from USD 1,557.66 billion in 2023 to USD 2,693.93 billion by 2030 at an 8.1% CAGR, while facility services are getting pulled into a new operating model where 65% of global FM is outsourced and 68% of facility managers already rely on IoT. This page puts the pressure points side by side with the upside, from AI driven helpdesks resolving tickets 30% faster and energy dashboards used by 65% of operations to the workforce reality of skill shortages that 42% of FM professionals report.
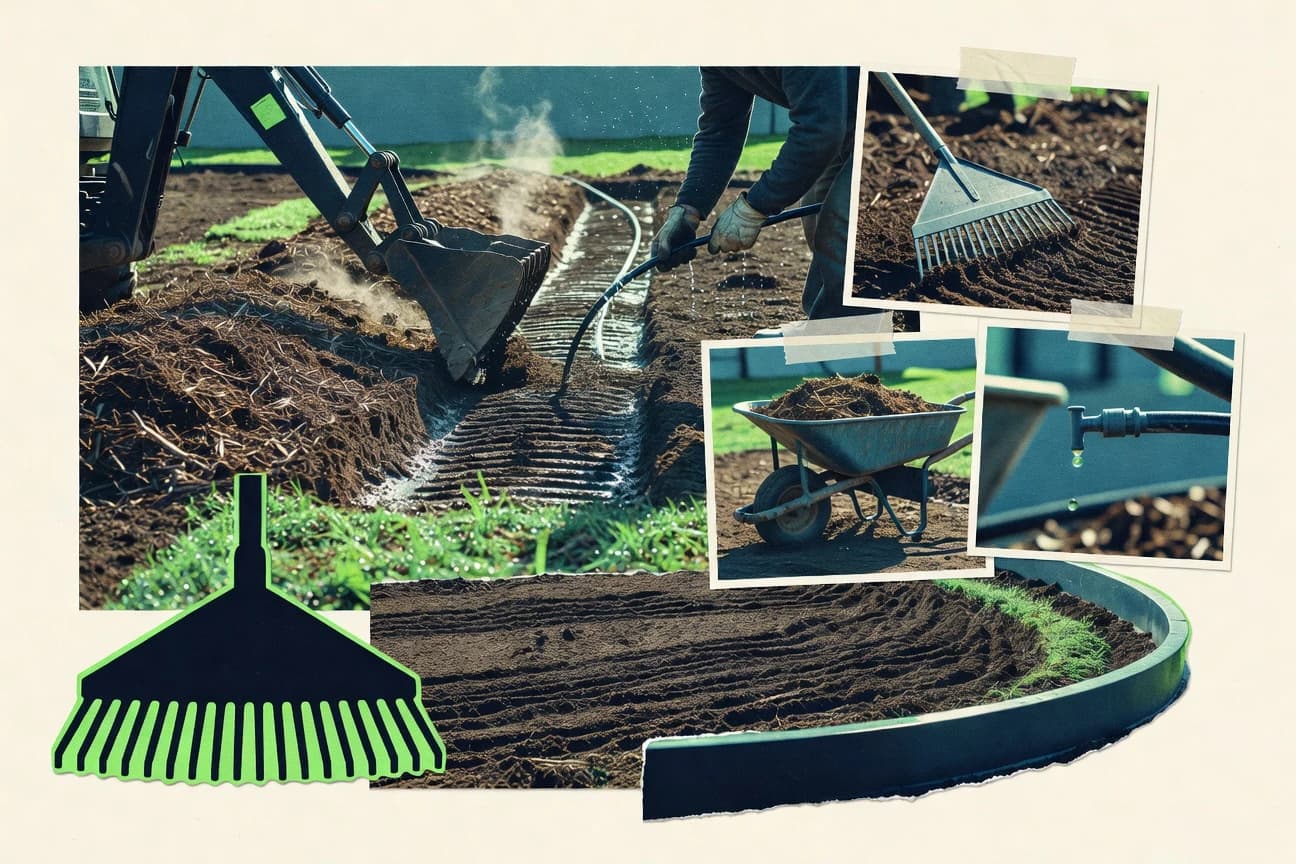
Landscaping Industry Statistics
Professional landscapers pull in 55% of homeowners annually, yet demand is shifting fast with outdoor living up 25% since 2020 and smart irrigation adopted by 35% of upscale homeowners. From 67% of homeowners favoring native plants to 88% satisfaction and an 80% maintenance renewal rate for commercial clients, these Landscaping Industry statistics explain what clients want, what they will pay for, and where the next growth is likely to land.
Japan Building Maintenance Industry Statistics
Japan building maintenance is projected to climb to 8.5 trillion JPY by 2028 with a 4.2% CAGR, even as profit margins sit at just 8.2% and costs are squeezed by a 45 28 27 labor materials overhead mix. You will see where the pressure is easing such as bankruptcy rates falling to 1.8% and where it is intensifying with 85 billion JPY in maintenance tech VC, 320 billion JPY in ESG-linked financing, and rapid BIM and IoT adoption that are reshaping productivity and contract pricing.
Portable Restroom Industry Statistics
The portable restroom industry moved nearly 15 million event attendees through rented units in 2023 while OSHA requirements still pushed 85% of large U.S. construction sites to provide facilities, making compliance and logistics inseparable. From UK festivals deploying 150,000 toilets to oil and gas crews running 45,000 monthly in Texas, the page connects who needs portable sanitation, how often, and what modern service fleets and equipment are changing behind the scenes.
Window Cleaning Industry Statistics
From a $45.2 billion global market valued in 2022 that is forecast to reach $68.7 billion by 2030, window cleaning is growing fast while working conditions lag, with 40% of window cleaners worldwide still lacking formal certification. See how U.S. services generated $2.8 billion in 2023 alongside 5,200 annual job openings, and where safety risks and new tools like water-fed poles and robotic systems are reshaping the trade.
Uk Cleaning Industry Statistics
With 1.07 million people working in UK cleaning and 285,000 cleaners in London making up 27% of the total, the workforce picture is both vast and sharply uneven. Yet wages still run £10.42 an hour and profit margins sit at 6.8% in 2023, while 42% of public contracts and 69% of large tenders push green procurement, turning sustainability pressure into a real cost and staffing tension.
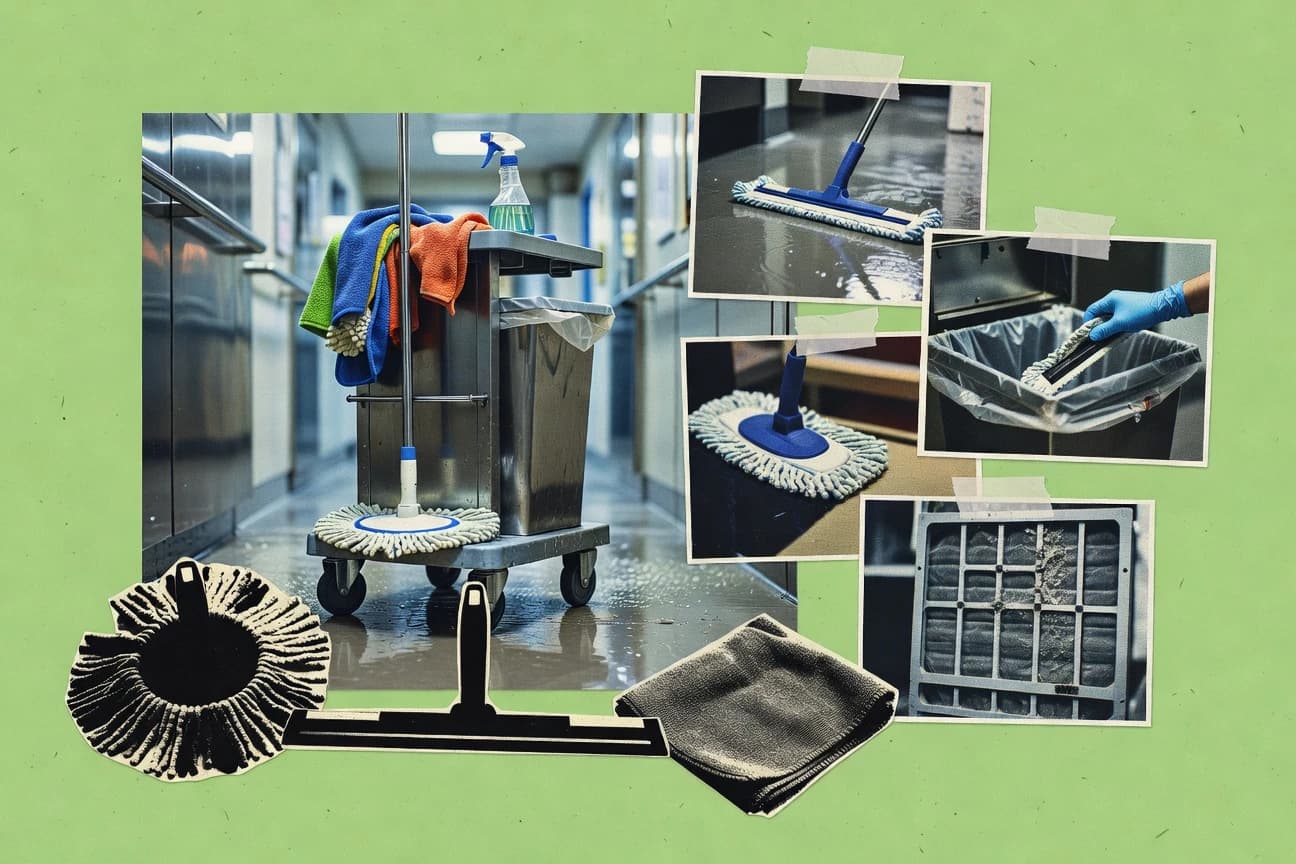
Janitorial Services Industry Statistics
With the U.S. janitorial services and building maintenance market projected to reach $140.0 billion in 2024 and 1.1 million job openings expected for janitors and cleaners over 2023 to 2033, this page puts labor reality and hiring demand front and center. It also tracks the modern contract pressure behind the scenes, from green cleaning adoption at 67% and touchless workflow use at 23% to technology driven pay and cost signals like a 2.1% average annual increase in labor costs and a 4.8% SLA failure rate.

Luxury Landscape Design Industry Statistics
Luxury landscaping is no niche sideshow with a $110.2B U.S. market and a 3.2% growth expectation, but margins and marketing discipline are separating the contenders from the rest, from top contractors at 7.1% gross margin to customers who respond to smart, review driven booking at 78%. Use these benchmarks to price like a studio, sell like a retailer, and build outdoor value that can lift property premiums by up to 30%.

Property Restoration Industry Statistics
U.S. property loss restoration is tied to a $95.7 billion disaster recovery market and a $76.9 billion insurance claims pipeline, but the pressure hits where it matters for crews and contractors. From long-tail mold and fire remediation to rising labor and supply costs, these restoration relevant figures explain why water related damage alone accounts for 15% of home insurance claims and why the work never really “wraps up” after the storm.
Home Cleaning Industry Statistics
See how home cleaning is reshaping fast, from a 36% share of US households using paid help and $9.2 billion spent on housekeeping services to a 67% rebooking lift when jobs include a satisfaction guarantee, plus what that means for pricing, labor, and safety. You will also spot the productivity and hygiene pressure points behind the scenes, including 84% of facilities using ATP testing and the cost swings that hit crews through energy and gas, not just wages.
Fm Industry Statistics
FM budgets are being pulled in two directions at once as the global facilities management market is forecast to reach $2,150 billion by 2032 alongside a 12.7% 2024 to 2030 smart building CAGR, while day to day operations are pressured by a US inflation rate of 0.9% that raises labor and maintenance costs. This page connects that macro pressure to what facility leaders actually do, from 61% IoT monitoring and 74% energy benchmarking to a reported 2.6x drop in maintenance backlog from computerized work management and sharply lower emergency callouts from risk based inspections.
Handyman Industry Statistics
With e commerce at 15.6% of U.S. retail in 2023 and 78% of consumers checking online reviews before hiring, handyman demand is being shaped as much by screens and scheduling as by square footage, repairs, and tools. This page connects the signals behind that shift, from 1.52 million U.S. residential building permits and 3.0 construction injury rates to the $625 billion U.S. home improvement market and the $19.87 median hourly pay for maintenance and repair work.
Germany Cleaning Industry Statistics
Germany cleaning businesses account for about EUR 50.5 billion in revenue projected for 2035 while 12,000+ enterprises and roughly 1.7 million employees keep the sector running today, and the mix of “other cleaning services” makes up 55.8% of market value. The page also connects staffing and compliance pressures like the EU Detergents and Biocidal Products rules, where even small protocol choices can swing outcomes toward up to 99.9% bacterial reduction and shape what contracts in Germany will actually demand.