GITNUX MARKETDATA
Browse Our Category
Facilities Property Services
Latest update:

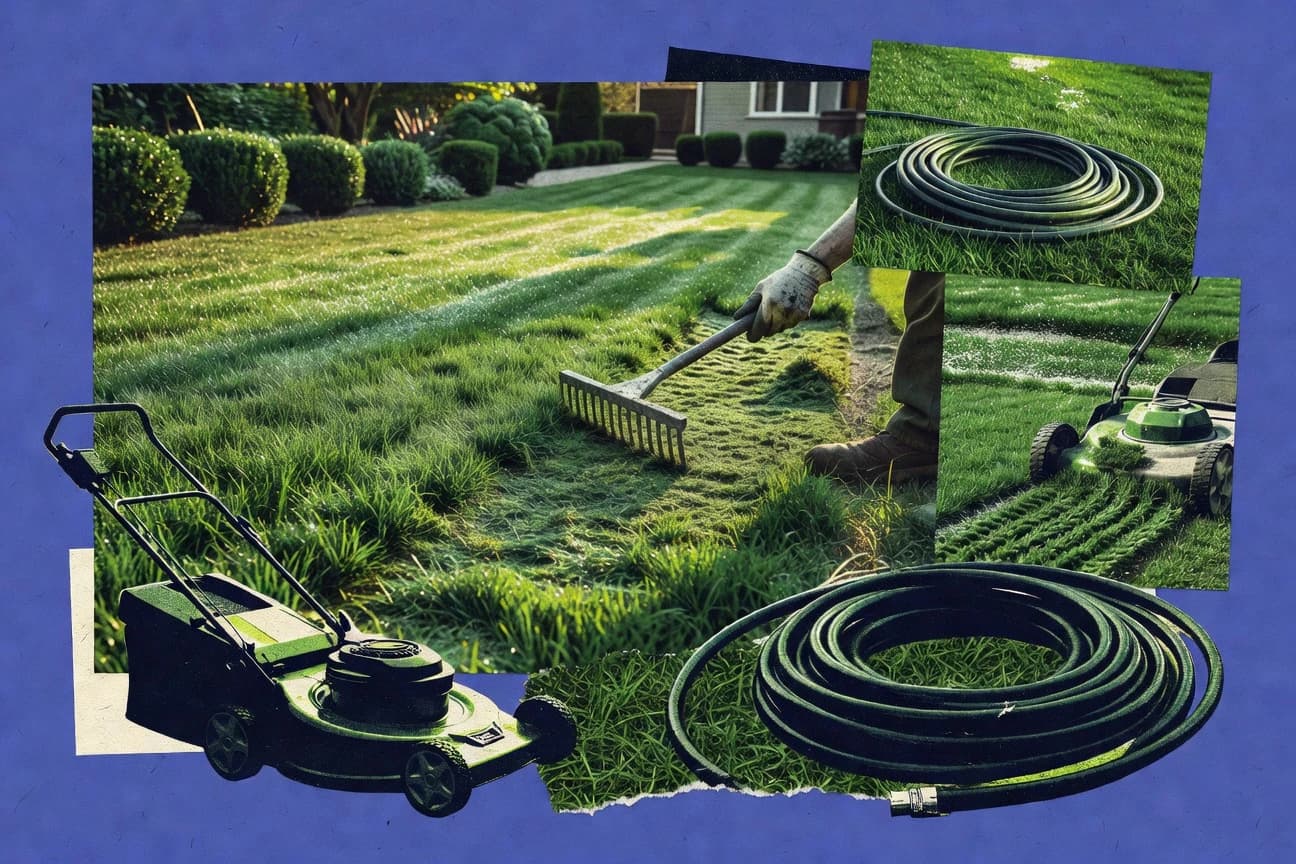
Residential Lawn Care Industry Statistics
Smartphone access is nearly universal at 92% of US adults, yet more than a third of lawn care customers in 2023 still expected live chat or immediate messaging and 43% booked through websites or apps instead of calling. Get the practical cost, labor, and input signals behind residential turf work, including $95 average mowing on 1.5 acres and wage benchmarks that reach $24.87 at the 90th percentile, plus what regulations like FIFRA mean for herbicide use and nitrogen runoff.
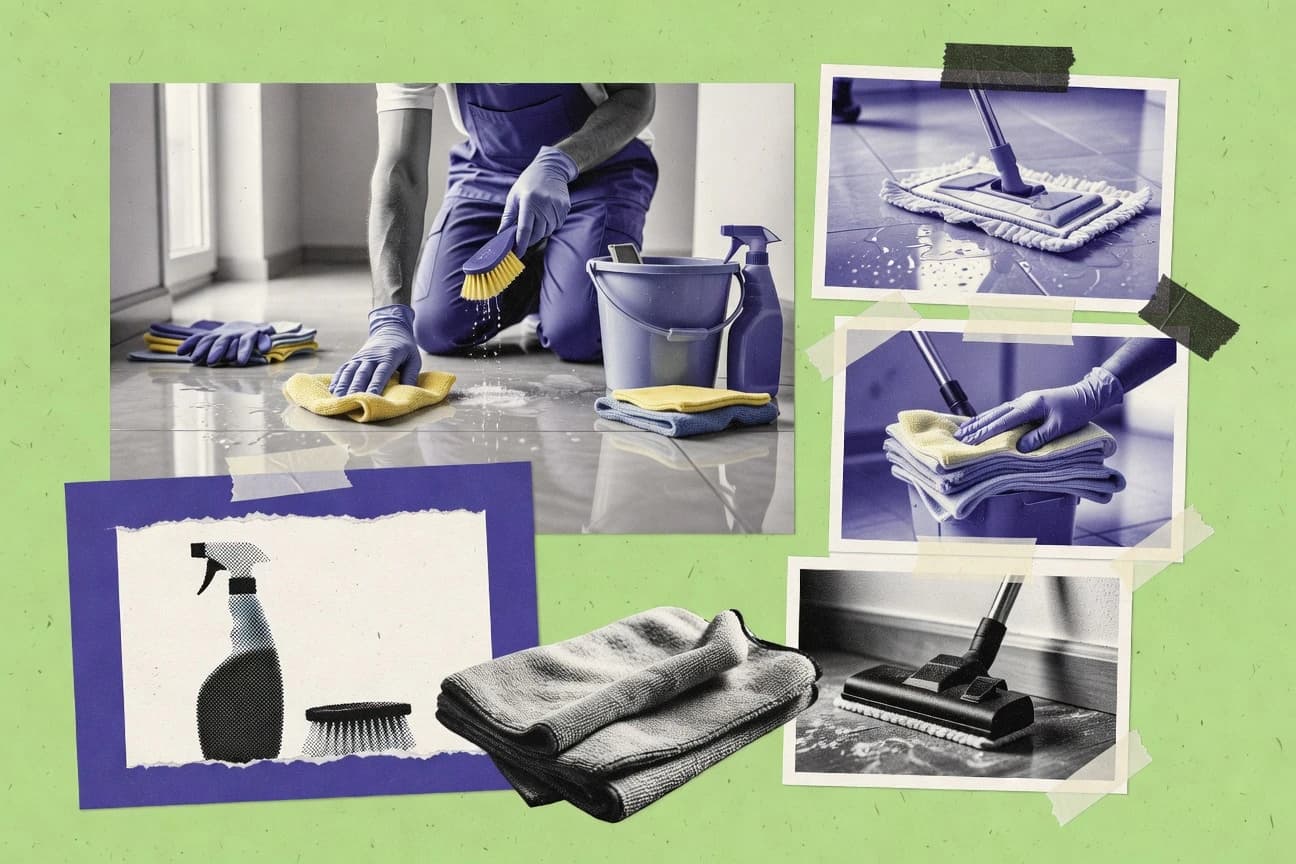
House Cleaning Industry Statistics
House Cleaning Industry data in 2025 shows how fast shopper expectations and cleaning demand are shifting, with costs and service choices moving in noticeably different directions than many households assume. Read the statistics to see what changed and where the biggest opportunities and pressure points are showing up right now.

Maintenance Statistics
See how Maintenance teams shifted from reactive fixes to measurable reliability, with 2026 statistics pointing to faster turnaround and steadier uptime than most would expect. The page puts the overlooked drivers behind the numbers side by side so you can spot where your workflow is costing you time and where small changes are already paying off.
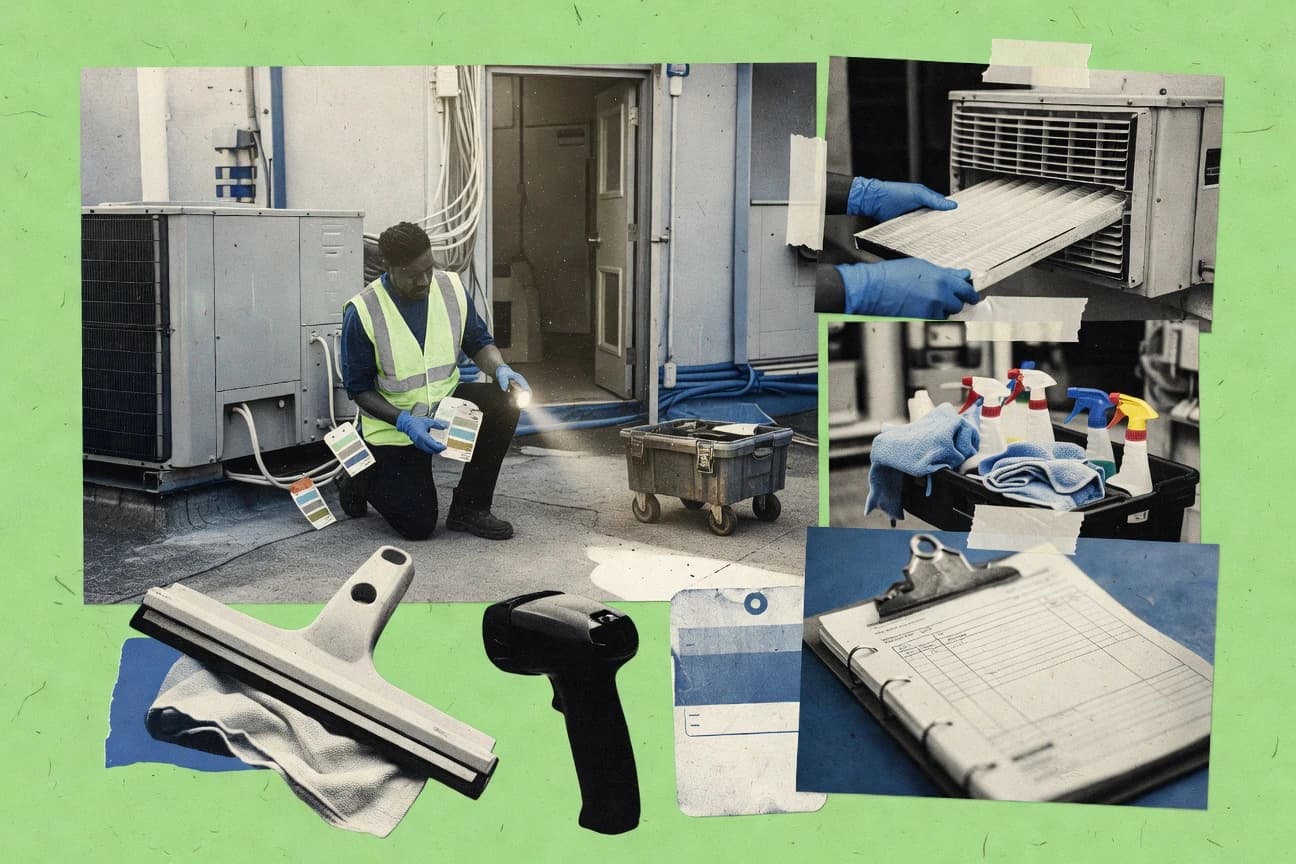
Facilities Services Industry Statistics
With the US projected to grow real GDP by 2.0% through 2026 while US inflation is forecast at 3.0% in 2025, facilities services providers are managing tighter cost and staffing realities, from labor force participation of 62.6% to wage and safety pressures that show up in hiring, incidents, and contracting. Technology is no longer optional either, with 71% of teams already digitizing maintenance workflows and cloud CAFM adoption reaching 68% in 2024, a shift that helps explain why energy, downtime, and cyber risk are being treated like core operating levers rather than background expenses.
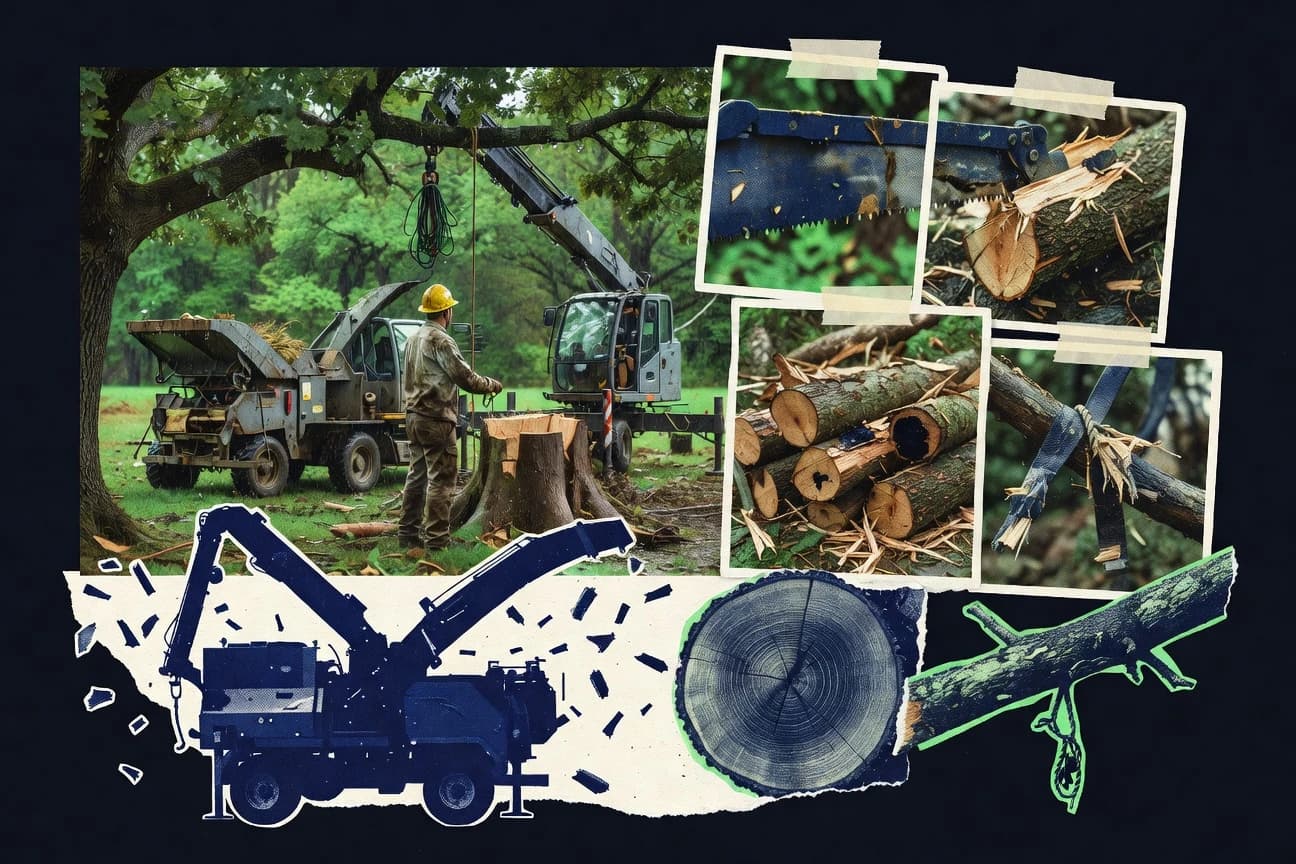
Tree Service Industry Statistics
From 2024’s $420B U.S. home improvement spend to a forecast that the tree care market keeps growing at a 6.5% CAGR through 2033, this page explains why tree services are getting pulled tighter into weather response, technology, and utility work. You will also see the demand jump behind downed tree cleanup and how mobile search, SEO, and field software are reshaping who wins calls after storms.

France Cleaning Industry Statistics
France Cleaning Industry statistics reveal a sharp 2025 shift in how households and contract cleaners allocate time and spend, pointing to a very different cleaning footprint than just a year earlier. If you want to understand where demand is tightening and which segments are growing fastest, these up to date figures will give you a clearer map than general estimates.
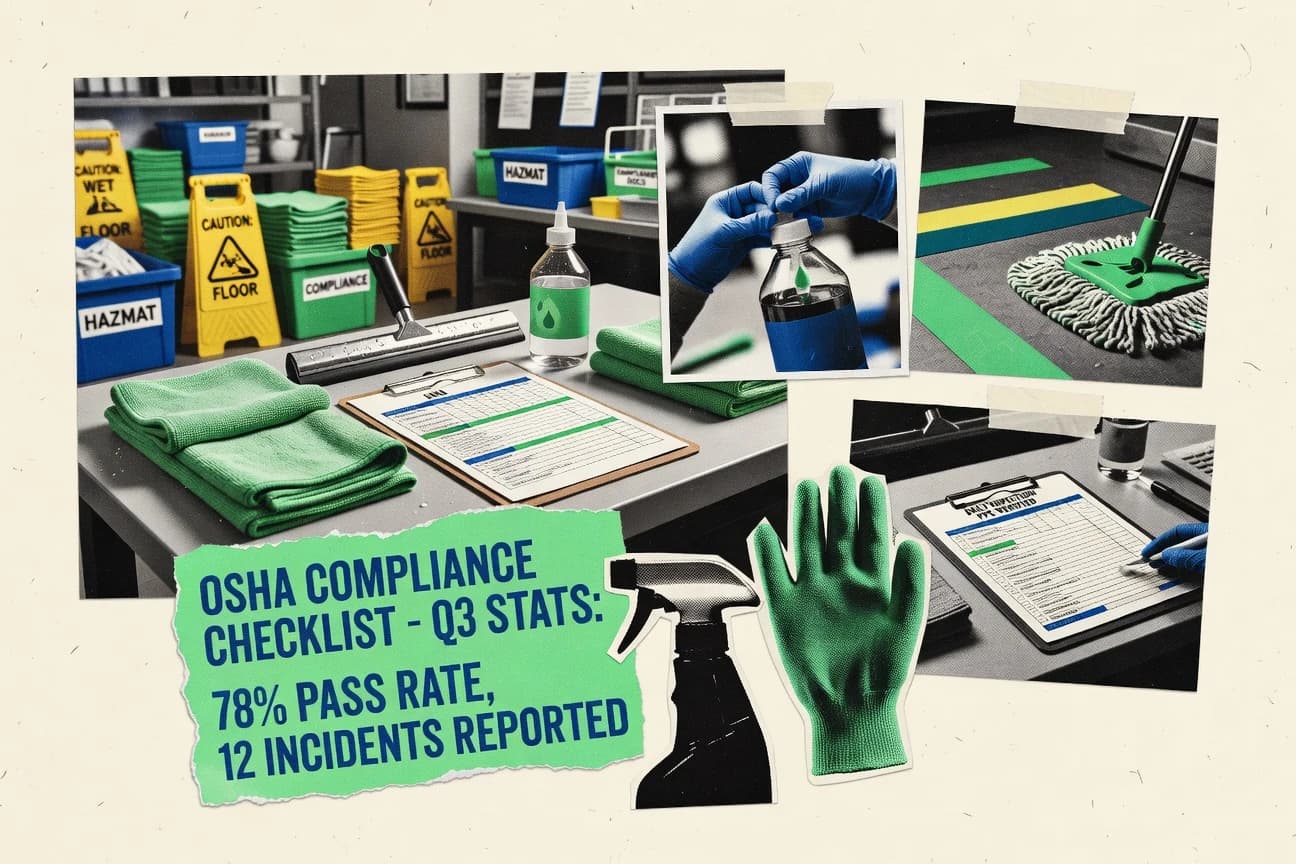
Osha Cleaning Industry Statistics
Fatal workplace injuries in the US jumped 136% from 2014 to 2023, and the spillover is landing directly in cleaning and sanitation work where falls, PPE gaps, and chemical exposure still get cited hardest under OSHA rules like Walking-Working Surfaces and Hazard Communication. You will also see how workforce economics and staffing pressures collide with prevention, from 10% projected job growth for Building and Grounds Cleaning and Maintenance to evidence based controls for safer handling, respirators, and even microfiber and room cleaning outcomes.
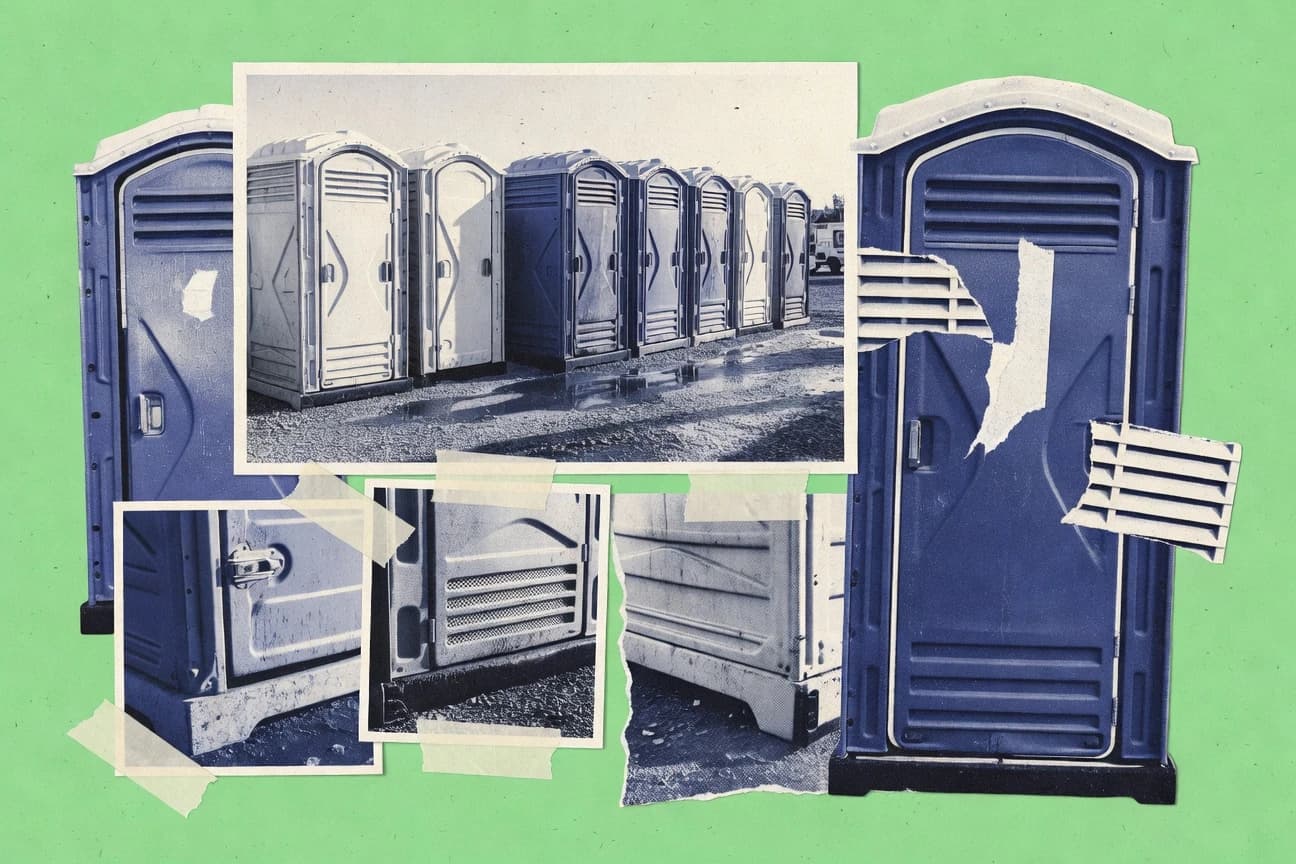
Portable Toilet Industry Statistics
Get a clear, numbers-first view of how portable sanitation scales globally, from China’s 18.5 million units produced in 2023 to the worldwide market projected to jump from USD 14.2 billion in 2022 to USD 21.8 billion by 2030. If you need evidence for planning, investing, or procurement, this page connects major manufacturers, rental and event demand, and fast-growing service trends, including the fact that U.S. rental revenue reached $1.8 billion in 2023.
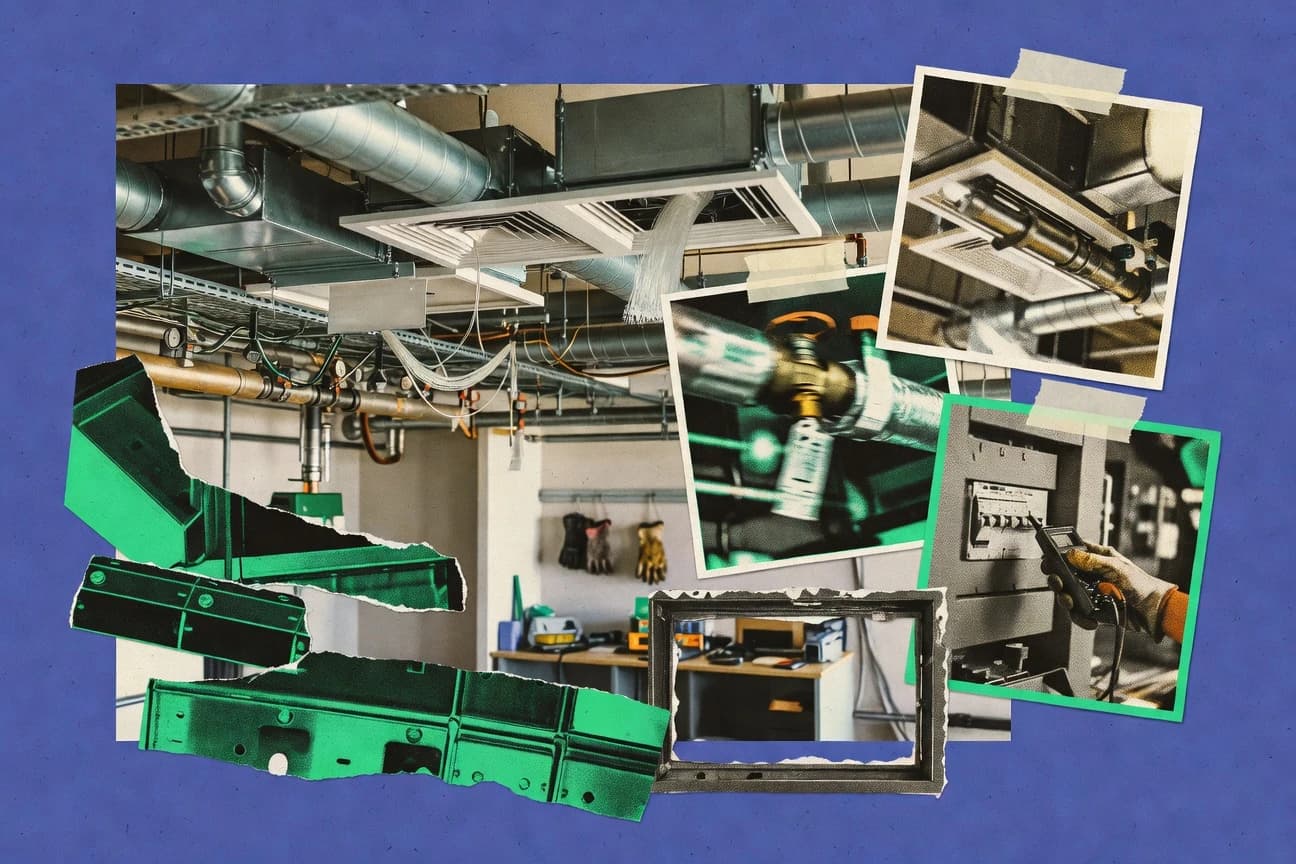
Building Services Industry Statistics
From 2025 to 2026, Building Services Industry metrics shift fast, with tighter margins, changing workloads, and evolving demand pressures that can’t be explained by tradition alone. Get the key statistics that separate what’s changing from what’s merely moving on paper, so you know where to plan next.
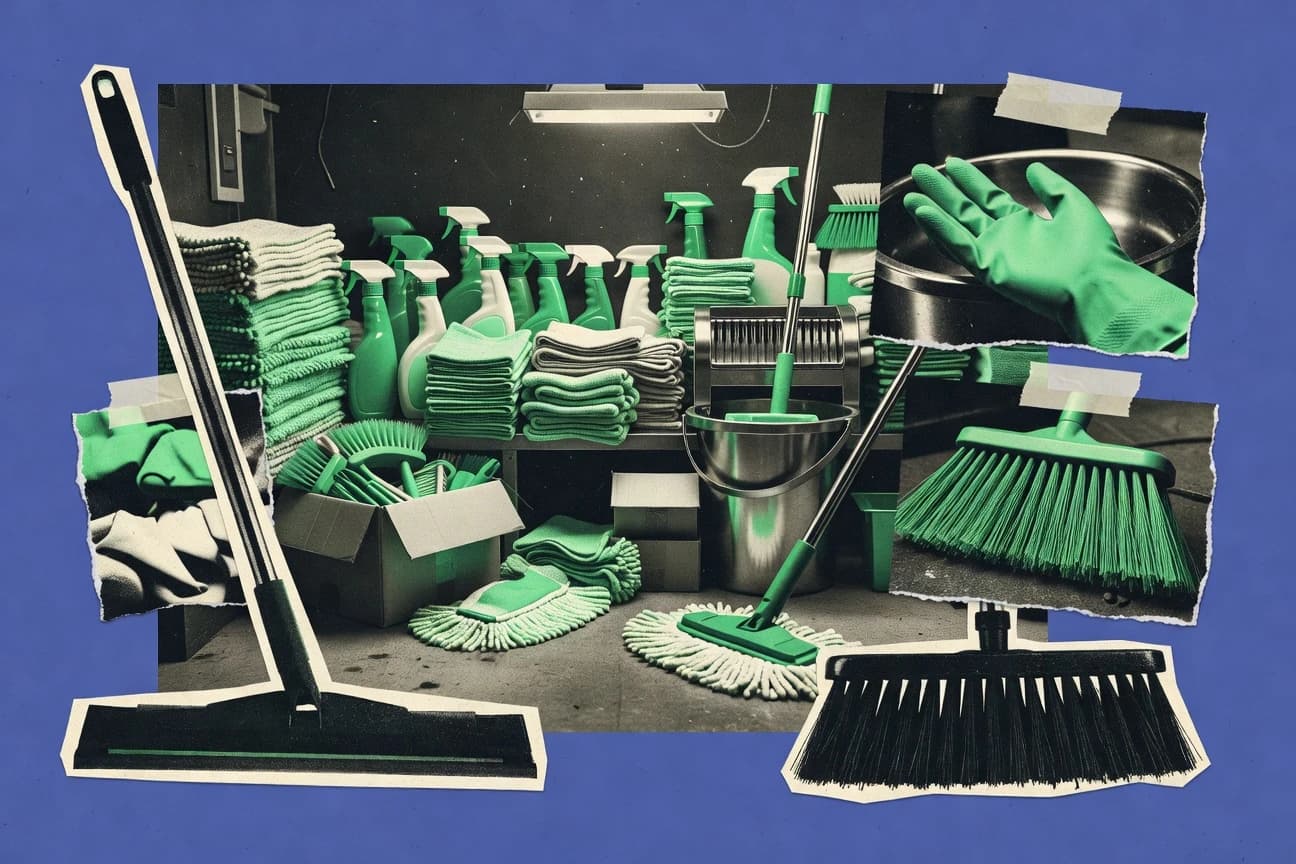
Janitorial Supplies Industry Statistics
With the U.S. janitorial paper supply price index up 18% from 2020 to 2022 and sodium hypochlorite spiking in 2021 to 2022, this page shows why cleaning costs have been anything but predictable alongside rising labor, including an 8.2% jump in U.S. janitorial service costs from 2021 to 2022. It also ties performance and procurement realities together, from disinfectant efficacy benchmarks like ASTM E1153 to the shift toward microfiber and color coded workflows, plus market signals such as the cleaning robots surge to $8.6 billion by 2030.

Snow Removal Industry Statistics
See how the latest Snow Removal Industry numbers show demand shifting fast, with 2026 data highlighting where budgets are moving and which regions are feeling the pressure most. If you track plow capacity, labor, and equipment costs, these statistics reveal the gap between winter plans and real world snowfall outcomes.
Property Restoration Services Industry Statistics
See how property restoration teams are being reshaped by the latest 2025 and 2026 shifts in demand, timelines, and recovery costs, where the biggest surprises often sit behind the same damage types. This page connects the hardest metrics to what they mean for faster mitigation, cleaner rebuild planning, and smarter budgeting when every day counts.
Housekeeping Industry Statistics
Housekeeping Industry statistics for 2025 highlight a sharp split between rising demand and the uneven capacity to staff clean and care, reshaping everything from scheduling to customer expectations. You will see which operational metrics are moving fastest and what that shift means for costs, service quality, and staying competitive.
Water Damage Restoration Industry Statistics
With home prices still rising and water intrusion staying stubbornly common, the page turns operational speed into measurable cost and mold risk, including a 45 percent boost in electronic documentation signatures and a 4.5 day drying finish that drives how big claims get. You will see why moisture meters, thermal imaging, and faster insurance ready estimates now sit alongside drying timelines as the real competitive edge in water damage restoration.