GITNUX MARKETDATA
Browse Our Category
Facilities Property Services
Latest update:

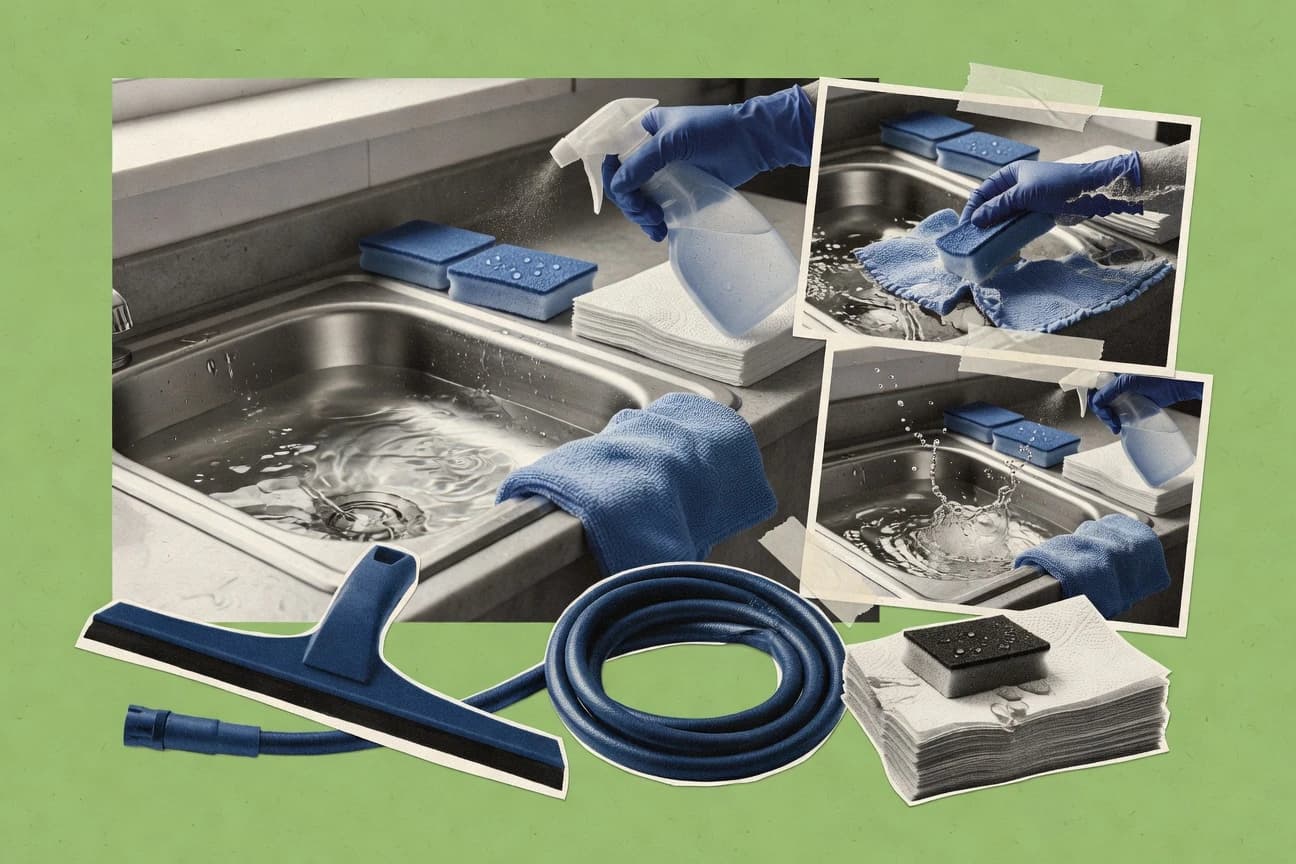
Cleaning Statistics
From microfiber textiles that can cut detergent use by about 60% and steam cleaning that drops viable bacteria by 2 to 6 log10, to HPV systems delivering more than 99.9% spore reduction and UV C doses from 10 to 100 mJ/cm², this page connects cleaning methods to measurable outcomes. You will also see what safety and cost pressures look like at work scale, including 2022 BLS data on 4,764 workplace amputations requiring days away from work and current industry spending, so you can judge which interventions are worth the operational lift.

Repair Industry Statistics
Repairing is winning on both cost and convenience, from U.S. HVAC owners choosing repair over replacement to save an average $1,200 to smartphone repair demand rising 12% since 2020 and adding 450,000 electronics repair jobs projected by 2030. At the same time, affordability pressures are reshaping behavior worldwide, with 72% of U.S. car owners delaying fixes and turning to DIY while 61% of Indian consumers still favor local repair shops.

Snow And Ice Management Industry Statistics
Snow and ice management is a labor and tech balancing act, with wages and workforce scale tightening even as operations modernize. From $2.8 billion revenue in 2023, to snow tech jobs still churning with a 35% average annual turnover, this page connects the $22.50 hourly plow operator wage, labor shortages reported by 65% of firms, and fast growing dispatch and equipment trends to explain what it really takes to keep roads, runways, and sidewalks moving when winter hits.
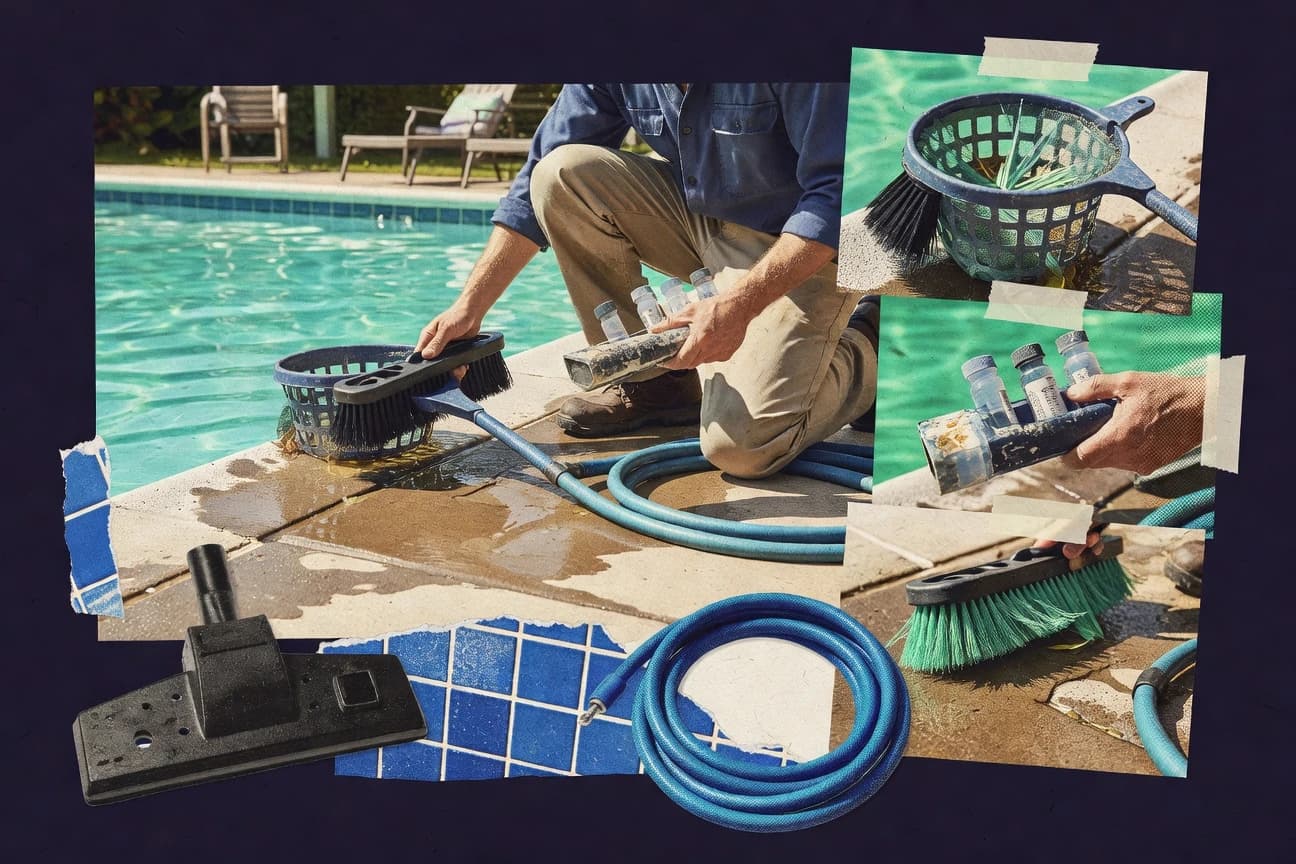
Pool Service Industry Statistics
U.S. residential pool services sit on a real demand base with the residential swimming pool market at about $6.7 billion in 2023 and the U.S. pool chemicals market at about $1.8 billion in 2023, while broader services spending rose about 16% from 2019 to 2023 to support recurring maintenance. But pricing and margins are tugged both ways as service input costs and related goods inflate, including BLS producer prices up 3.4% year over year for household and institutional furnishings and services, so the page shows exactly how labor, local search intent, and equipment and consumable costs shape what a pool route can earn.
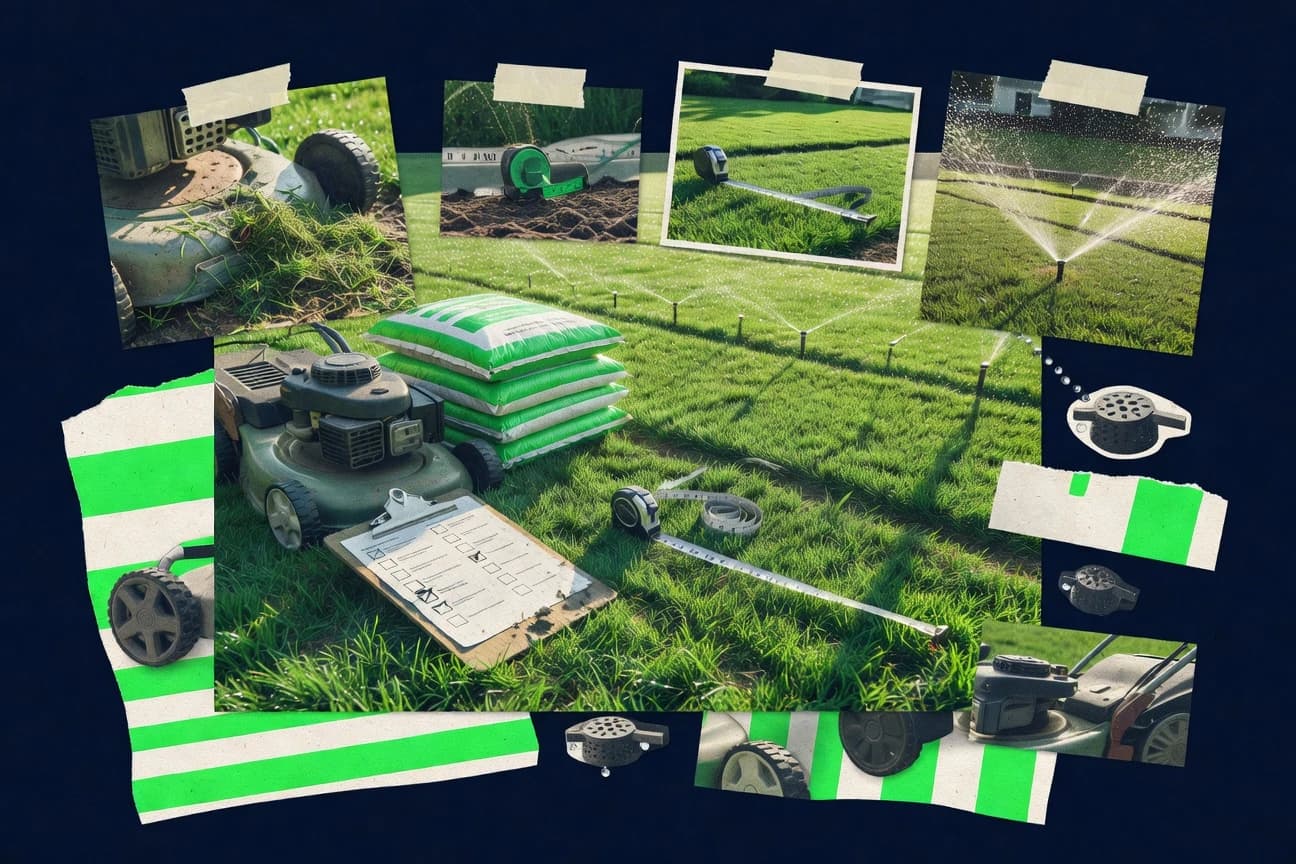
Lawn Care Industry Statistics
Seventy two percent of U.S. households hire lawn pros at least once a year, spending an average of $450 annually, yet demand keeps shifting fast toward greener, smarter care such as 39% higher interest in organic treatments since 2020 and 47% of lawns owners already using smart apps for scheduling. From 25 mowings a year to robots cutting labor needs by 40% and electric gear that reached 33% preference in 2023, these Lawn Care Industry stats explain exactly where buyers are going and what that means for services, equipment, and pricing.

Commercial Cleaning Industry Statistics
Commercial Cleaning Industry employment and pay look solid at first glance, with US janitorial services at 2.4 million workers in 2023 and an average hourly wage of $15.25, but the workforce reality gets sharper: 65% part time in commercial settings and turnover of 50 to 100% annually. This page also connects demand and job risk with global workforce scale from 20 million cleaners in 2023 to rising green and tech practices, so you can see exactly what shapes cleaner schedules and contractor costs.
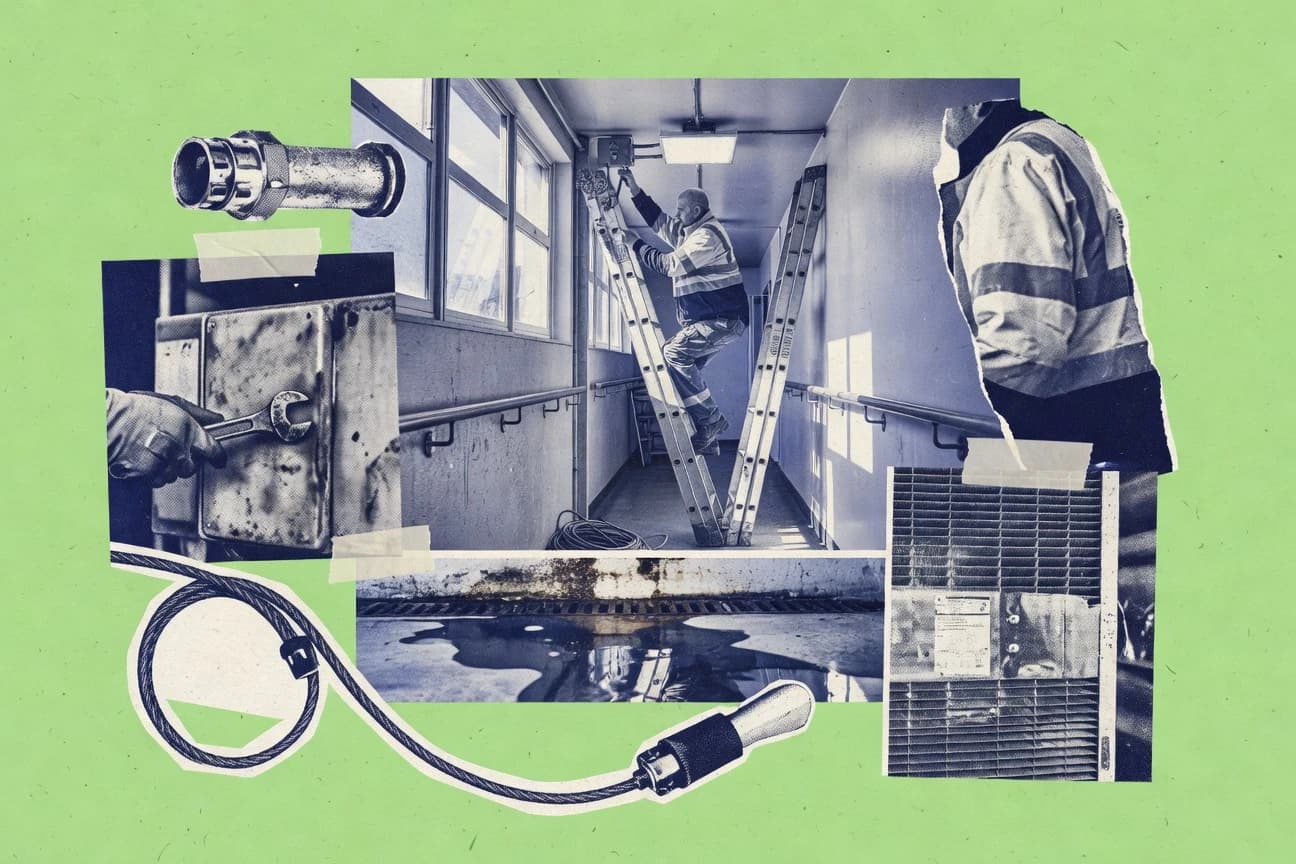
Building Maintenance Industry Statistics
From 4.2 million US workers keeping facilities running in 2023 to predictive maintenance delivering a 10:1 ROI and up to 40% less downtime in surveyed US buildings, this page connects roles, pay, costs, and safety pressure with the tech reshaping building maintenance. You will also see why the talent gap is still sharp, with 650,000 skilled trade openings unfilled in the US, even as outsourcing and automation push budgets toward smarter, more accountable maintenance.

Carpet Cleaning Statistics
Professional carpet cleaning leans on hot water extraction, yet the most modern results come from faster, drier systems such as encapsulation that can cut drying time to under 1 hour and is growing 8% annually. Learn how methods like rotary extraction, ozone post-flood sanitizing, and neutral pH rinses translate into cleaner carpets, healthier indoor air, and measurable outcomes across both home and industry.
Pest Control Statistics
With European market share holding at 25.0% and North America at 30.0%, the page connects regional demand to real pricing, where a U.S. bed bug treatment can run $1,500 to $3,000 but heat trials report 98% reduction after one cycle. You will also see how integrated pest management lands near a 70% average efficacy and why growers of tech are the ones most likely to adopt digital tools across their service operations by 2024.
Home Services Industry Statistics
Residential home services are pushing into next year with a 3.7% forecast growth for U.S. home improvement in 2024 and a $432.0 billion remodeling market, but customer expectations are tightening fast so speed, estimating accuracy, and customer experience can make or break profitability. With 75% of consumers relying on online reviews and 84% searching online for providers, while only 31% of field workers use mobile apps and contractors report 21% of profitability trouble tied to estimating accuracy, this page shows exactly where demand meets operational gaps.

Cleaning Industry Statistics
The cleaning industry is still growing fast, with Allied Market Research forecasting a 12.5% CAGR for global cleaning services from 2024 to 2033, while U.S. janitorial and commercial cleaning markets sit at $11.3 billion and $13.2 billion respectively in 2023. But the page also puts sharper limits on “just keep it tidy,” tying big demand and cost pressures to real worker risks and compliance realities, from a 4.2x higher COVID-19 infection risk for cleaners to OSHA SDS requirements and REACH registrations across the EU.
Elevator Maintenance Industry Statistics
With the US Elevator & Escalator Services market projected to reach $6.2B, this page tracks how shifting from reactive to preventive and predictive maintenance is cutting downtime by up to 31% and raising MTBF by 15%, even as the installed base keeps expanding. It also puts hard safety pressure front and center, from response time targets of 4 hours and thousands of entrapment incidents in state and European datasets to reliability findings showing 80% of downtime can hinge on a small set of components.

Tree Care Industry Statistics
Between the 2023 global arboriculture market estimated at $129.2 billion and the utility side of the business where 46 states mandate tree trimming near power lines, tree care is clearly more than local lawn work. The page connects that demand to what it takes to operate safely and win customers now, including a $500 average U.S. cost to trim a medium tree, 27% of customers using online reviews, and fall protection risks that still drive 5,333 fatal falls across all industries in 2022.

Janitorial Sanitation Industry Statistics
U.S. janitorial services are projected to grow at a 2.0% CAGR through 2027 while disinfecting and sanitizing services still reach $23.4 billion in 2022, putting real scale behind why standardized cleaning programs now show dramatic results such as terminal cleaning compliance rising from 10% to 95% and meta-analyses linking better disinfection to about a 30% reduction in HAIs. With up to log level contamination changes from targeted interventions, plus the practical realities of dwell time, pathogen survival, and the workforce that keeps healthcare and facilities moving, this page connects market pressure to the infection control outcomes procurement teams need to justify spend.
Facility Management Industry Statistics
From a 20% rise in facilities management software spend intent in 2024 to 61% of FM software users reporting better integration and 48% using mobile work order tools for faster repairs, this page pinpoints what actually moves performance. It also contrasts cost pressure and operational reality with 9.6% higher US maintenance and repair costs and the safety stakes behind 3.1 million occupational injuries, so you can see where IWMS and CMMS adoption is helping and where it is not.

Snowplow Industry Statistics
See what happens when observability priorities collide with security budgets and cost. From $28.4 billion in cloud infrastructure services to $17.7 billion for SIEM and 37% of organizations running SIEM, the page connects telemetry and logging adoption with real-world constraints like latency targets under 500 ms, MTTR gains up to 24%, and governance pressure that can turn analytics and event tracking into a compliance problem.

Parking Management Services Industry Statistics
Smart parking is no longer a niche add on, with the smart segment growing 18.4% YoY to $6.8 billion globally, while 78% of airport facilities already use automated payment systems to keep arrivals moving. This page connects those operational shifts to the money trail, from $24 billion in US parking revenue in 2023 to a market projected to climb to $11.8 billion by 2030, showing exactly where demand, technology, and pricing models are converging and where capacity is still the bottleneck.

Pool Maintenance Industry Statistics
With the U.S. pool maintenance industry up 12% since 2020 and employing 45,000 workers in 2023, the biggest surprise is how hard it still is to keep talent steady, with 18% annual technician turnover and seasonal demand sending jobs from 60,000 in summer down 40% off-season. From CPO certification boosting earnings by 15% to service tech wages averaging $22.50 an hour and automation software lifting productivity by 30%, this page puts the real cost of doing pool work beside the fastest ways companies are improving schedules, compliance, and margins.
Maid Service Industry Statistics
A 2023 snapshot of the maid service boom reveals a striking split between demand and who books, from 67% weekly hires among Americans aged 65 to 74 to 49% of German clients booking through apps and a sharp rise in low income U.S. renters, up 18% in maid usage. Follow the money and the workforce too, with women making up 87% of the U.S. workforce and global employment reaching 85 million workers, showing how technology, income, and aging are reshaping both service styles and labor behind the scenes.
Issa Cleaning Industry Statistics
See what today’s ISSA Cleaning Industry numbers reveal about a workforce under pressure and being retooled fast, from 12.5 million global cleaning workers in 2023 to 76% of firms reporting labor shortages and 42% annual turnover. Then track how tech and training are reshaping operations with remote monitoring staff in 55% of member companies and average training rising to 28 hours per year, alongside market growth pushing global cleaning jobs toward 1.5 million new roles by 2028.