GITNUX MARKETDATA
Browse Our Category
Marketing In Industry
Latest update:

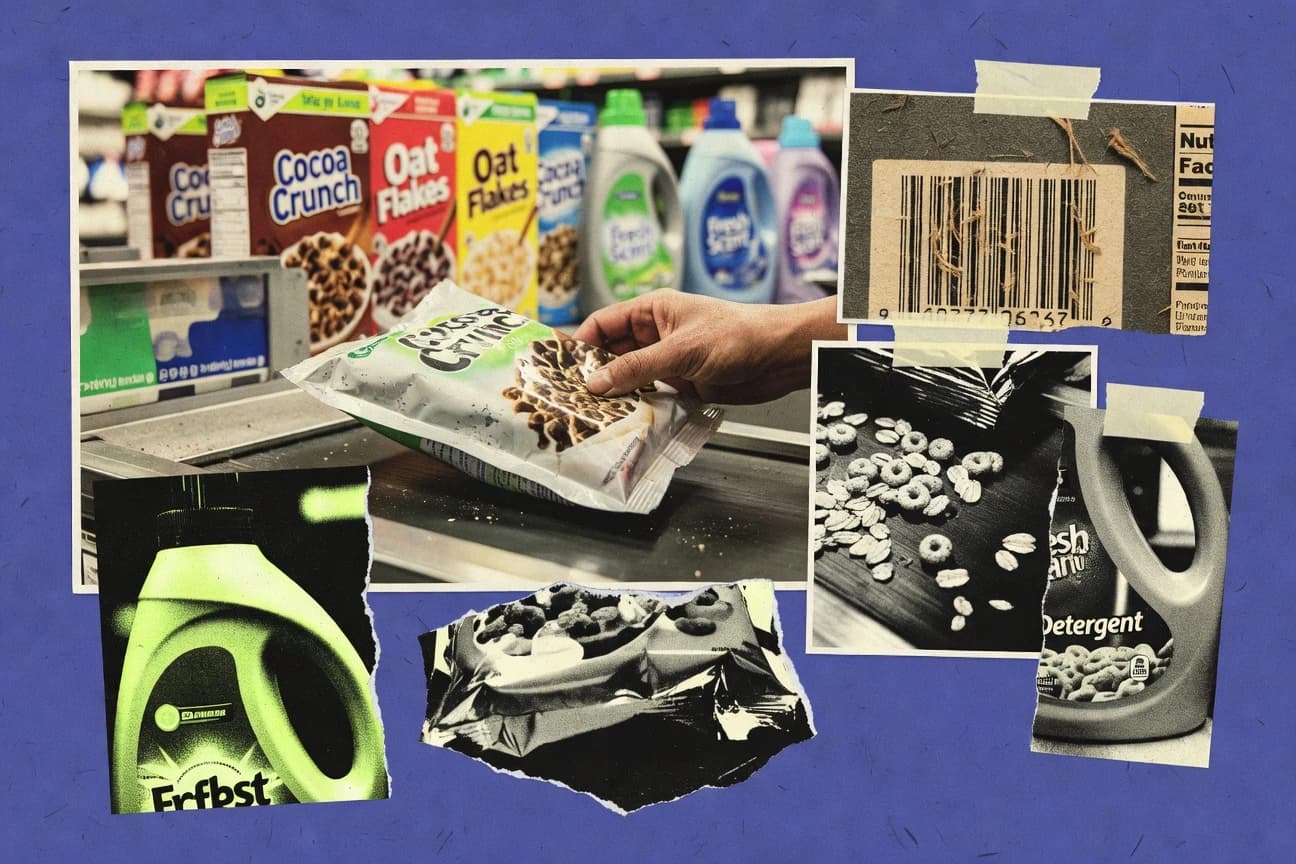
Marketing In The Fmcg Industry Statistics
With $2.98 trillion in 2023 global FMCG sales, the real scramble is how to earn attention across channels where 52% of consumers expect consistency and 47% rely on reviews, not just brands. This page puts 2024 retail media spend in the spotlight and pairs it with conversion benchmarks, marketing effectiveness gaps, and the ROI lift from marketing mix modeling to show what is actually working for FMCG growth.

Marketing In The 3Pl Industry Statistics
With $318.0 billion projected for global supply chain management market enabling spend by 2028, plus reliability driving 68% of shipper selections, this page connects the dots between what buyers demand and what 3PLs must market for. It also benchmarks the funnel and growth mechanics, from a 2.23% average B2B website conversion rate to 85% using video and 63% relying on marketing automation, so you can spot where performance is actually being won or quietly lost.
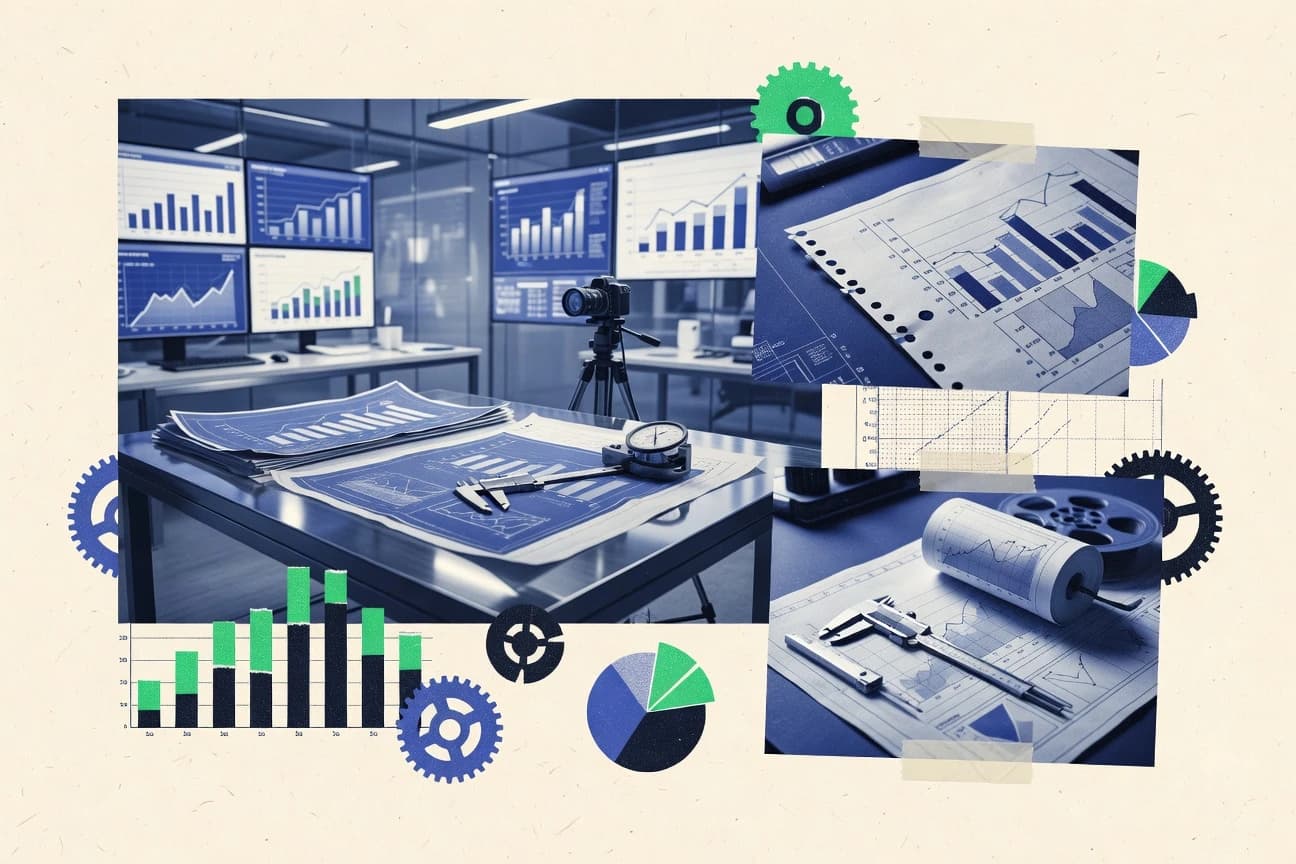
Marketing In The Engineering Industry Statistics
Engineering firms are putting 74% of their marketing budgets into lead gen yet fighting CAC, attribution gaps, and long sales cycles that run 9+ months, so you need benchmarks that actually map to revenue. See why engineering SEO hits 12.2x ROI in 12 months, email averages 42:1, and analytics and intent tools are reshaping spend with 3.7x overall return.

Marketing In The Fishing Industry Statistics
Millennials and Gen Z are reshaping angling fast, with 65% of Gen Z anglers favoring eco-friendly brands and 55% of sustainable seafood label readers saying those choices shape what they buy, even as global brands chase social and in-store influence that drives 70% of gear purchases. This page pulls the sharp contrasts together, from US recreational fishing delivering $125 billion in economic output to a global seafood market of $158.28 billion in 2022, plus the marketing levers that keep changing what anglers and seafood customers choose next.

Marketing In The Multifamily Industry Statistics
Discover why multifamily marketing cannot afford slow pages and generic leads, with 2.5x higher conversion from ad aligned landing pages and 53% of mobile users abandoning sites that take longer than 3 seconds to load. This page connects the renter economy, where 63% used an online search to find a home and 84% trust online reviews like personal recommendations, to practical leasing outcomes such as faster inbound decisions and better measurement.
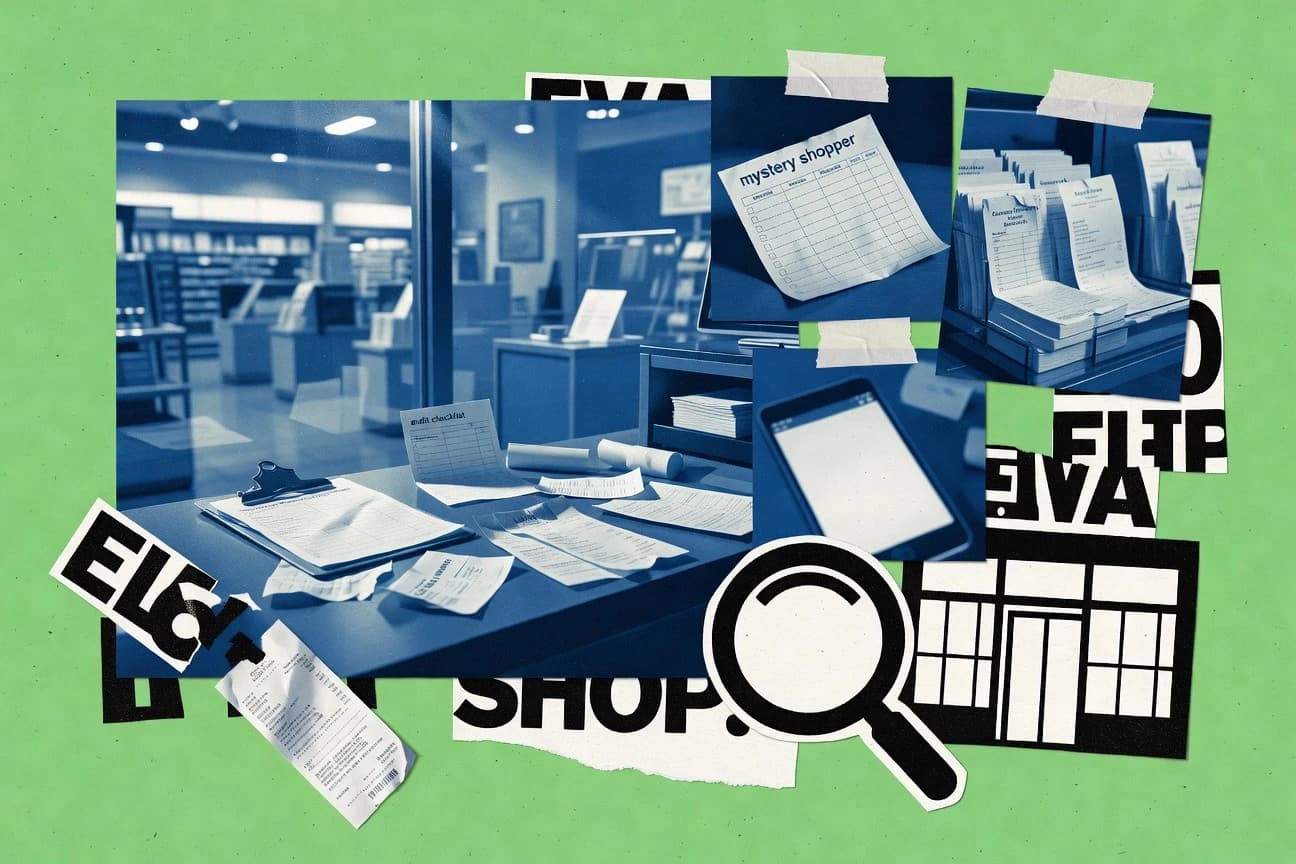
Mystery Shopping Industry Statistics
Mystery shopping may account for just 0.01% of US retail sales, yet 88% of consumers say they are less likely to return after bad service and 61% would switch brands for better customer experience, making these “small” checks disproportionately important. With 55% of CX leaders expecting to raise customer experience spending in 2024 and customer experience software tied to a $27.6 billion US market size in 2023, this page shows how audit style mystery shopping complements faster channels, verifies agent and digital journeys, and measures quality when most organizations still do not measure customer experience.
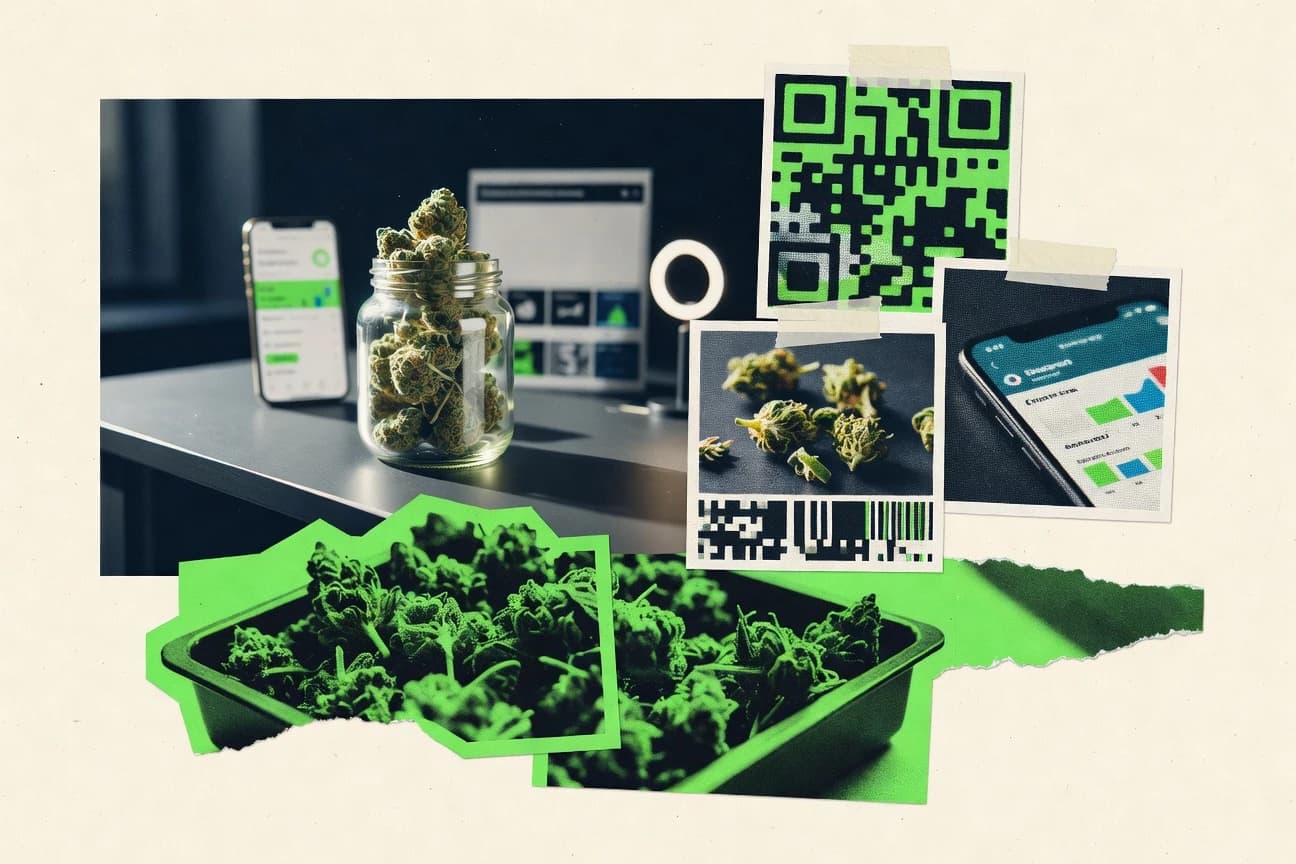
Marketing In The Cannabis Industry Statistics
Brands that use micro-influencers see 12x ROI and event sponsorships at cannabis expos drive 40% lead conversion with lifetime value 3x higher, but compliance and creative limits can still make or break the outcome. This page sharpens your next marketing decision with performance benchmarks like 48% in-store impact from packaging design, 42% open rates from personalized video emails, and how quickly today’s budget gains are being won or lost.

Marketing In The Apparel Industry Statistics
Gen Z is way ahead of the curve on what persuades apparel buyers, with 89% valuing sustainability claims and 34% letting them swing purchases in 2023, while 55% of returns still trace back to style mismatch caused by marketing visuals. This page connects those trust signals to what actually moves carts, from social proof driving 92% of online buys to personalized and omnichannel tactics that boost loyalty by 26% and lift sales.
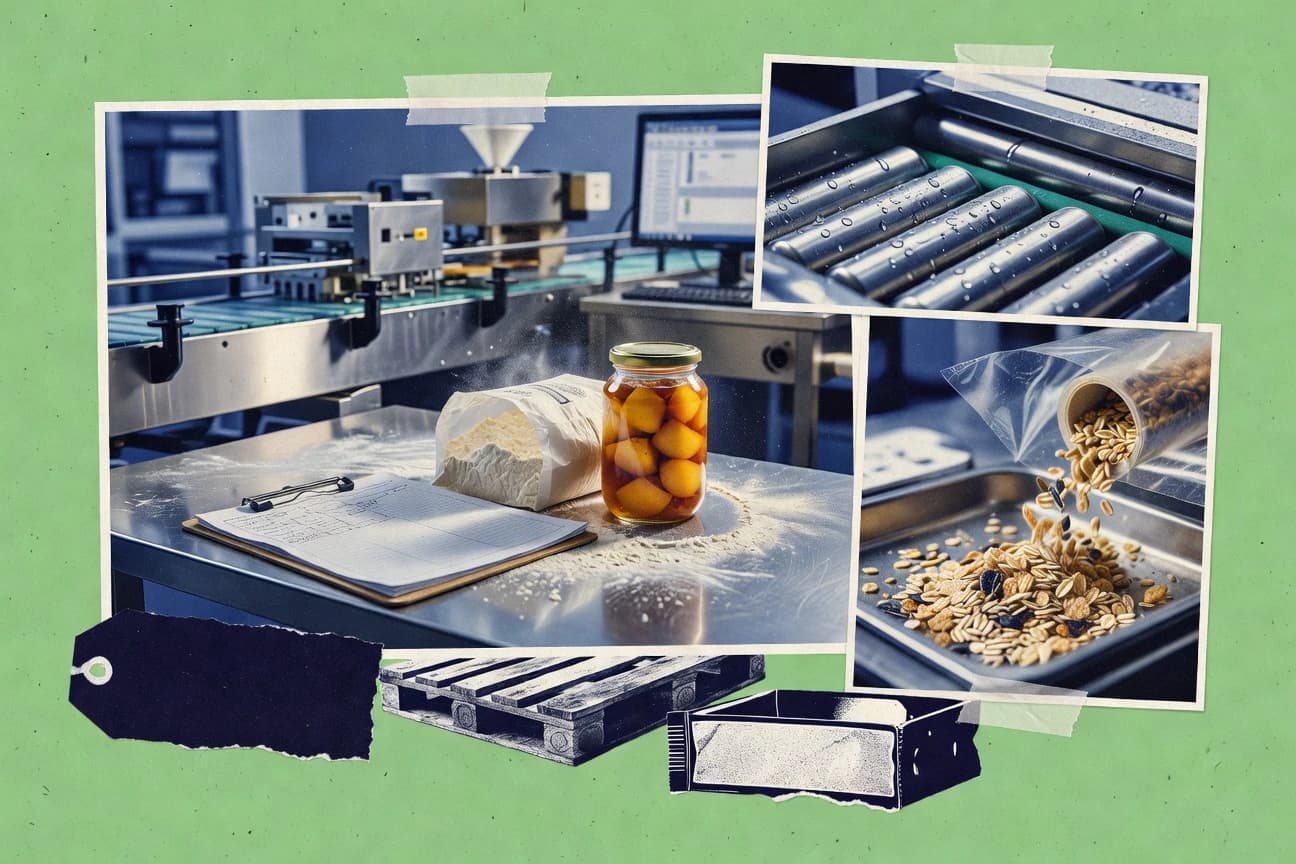
Marketing In The Food Manufacturing Industry Statistics
Food and beverage manufacturers are seeing faster gains from smarter execution, like a 35% conversion lift when landing pages load under 2 seconds, while 39% of marketers are already leaning on generative AI to keep creative and localization moving. The page connects the biggest growth levers, from 92% social adoption and 60% B2B research on mobile to how rising marketing breaches and data quality gaps can quietly derail targeting.

Marketing In The Maritime Industry Statistics
See how 2025 and 2024 rules are tightening the screws on maritime marketing and analytics, from EU MRV coverage of 17% of global shipping emissions and the EU ETS reach across 100% of energy related ship emissions, to ReFuelEU’s targeted 2% annual carbon intensity cut and MARPOL fuel sulfur limits in and out of ECAs. Then connect policy pressure to performance realities like 9.5% growth in social media ad revenue, email ROI of $36 per $1, and why 76% of customers expect brands to understand their needs.

Marketing In The Technology Industry Statistics
With 77% of US consumers using search to find solutions and 62% expecting real time personalization, technology marketers are being judged in the moments that matter, not after the campaign ends. Get the latest 2024 benchmarks and signals on everything from martech tooling that high performers scale 3x faster to email CTR and ad costs, plus why 49% of marketers already use AI for content creation.

Marketing In The Telecommunications Industry Statistics
Telecom marketers are being pushed to deliver relevant personalization at scale, while consumers increasingly demand integrity, transparency, and protection from breaches that can shut brands out for good. This page connects the biggest 2024 to 2026 signals like 67% mid market marketing automation adoption, 74% buyer pressure to personalize, and rising CDP growth to real channel economics such as targeted email lifts and social advertising costs.

Marketing In The Data Center Industry Statistics
With $338.0B in global data center revenue expected by 2026 and U.S. electricity demand soaring toward 36.0B kWh by 2030, the pressure on teams to market responsibly and efficiently is rising just as 40% of IT leaders flag data management and governance as a top priority. See why marketing spend is shifting toward cloud CDPs and measurable ROI, even as cloud waste can hit 10% to 30% and faster breach detection becomes make or break.

Marketing In The Water Industry Statistics
Video is now table stakes, with 91% of B2B marketers using it, yet water marketing wins often hinge on proof and resilience, from 58% of utilities reporting increased cyber risk in 2024 to 54% requiring vendor references during procurement. This page turns those buyer signals into practical takeaways on where water vendors should focus messaging, lead-gen, and compliance cred.

Marketing In The Promotional Products Industry Statistics
The latest figures explain why promotional work keeps getting funded while costs and tracking get more complex, from a 60 percent social media marketing adoption rate and 73 percent of consumers remembering brands with branded items to a 49 percent ROI measurement challenge. You will also see how execution is shaped by the 10 to 14 day production reality, tightening logistics signals, and the projected 4.9 percent average annual global advertising and marketing services growth through 2029.

Marketing In The Wholesale Industry Statistics
With e-commerce now at 14.0% of all US retail sales and most B2B buyers already doing 57% of the journey online, wholesale marketers are being pushed to match attention with self service and faster answers. This page pulls together the most telling B2B marketing signals, from marketing automation and ABM performance to what drives pipeline, so wholesale leaders can spot where their growth plan is aligned and where it is quietly falling behind.
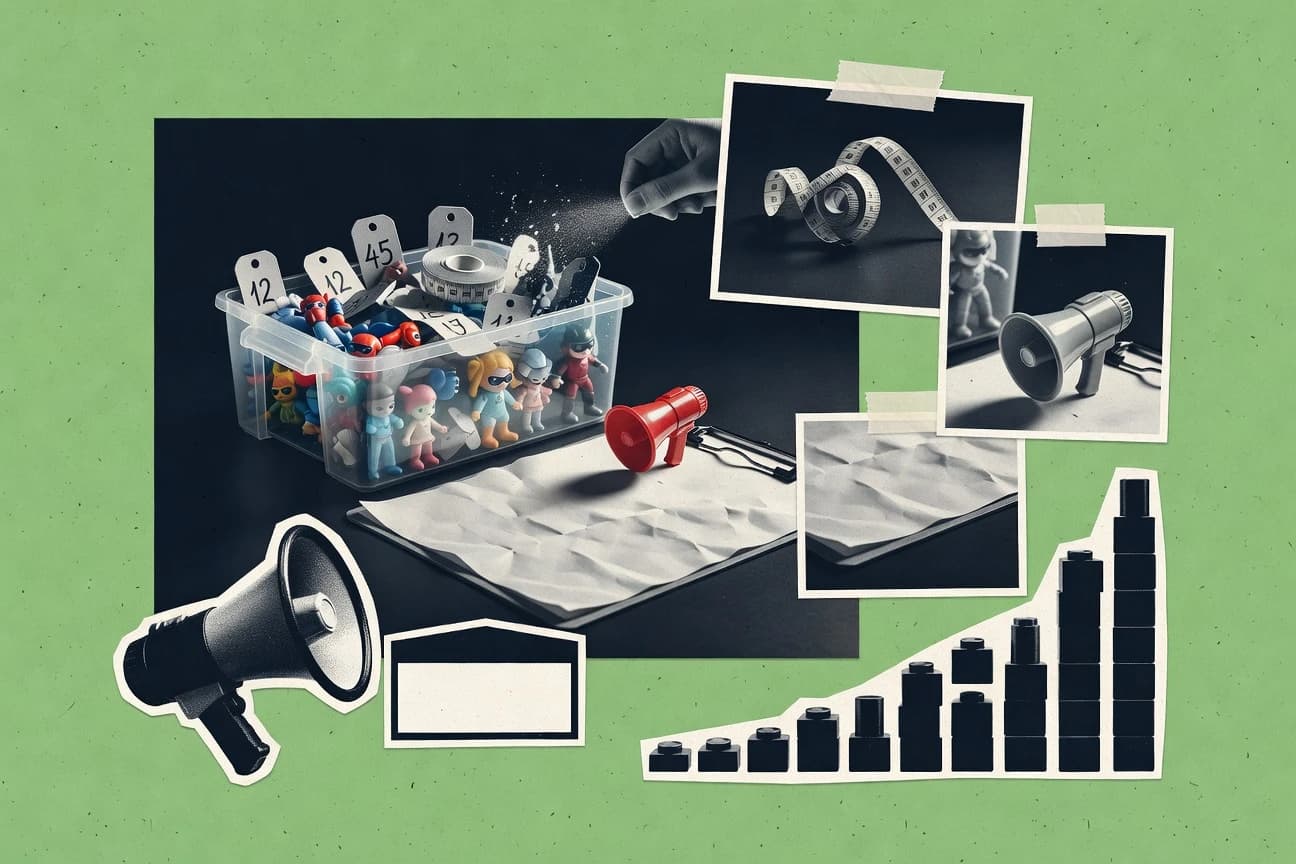
Marketing In The Toy Industry Statistics
Toy marketers are being pushed from every angle, and the signals look unmistakably digital and mobile, with 76% of toy related searches happening on mobile and 62% of U.S. consumers buying online via a phone over the last year. Meanwhile, personalization is no longer optional and fast load times matter, with 72% of consumers expecting it online and 70% getting frustrated when pages drag, so this page connects what shoppers demand to what retailers must measure and change now.

Marketing In The Travel Industry Statistics
Travel teams are using data and AI to squeeze real performance out of every click, with marketing analytics adoption at 89% and 64% of campaigns already leaning on AI predictive analytics to lift targeting accuracy by 33%. From attribution that pins social ROI at 18% of revenue to Shopify style efficiency like CPA falling 17% to $28.40, these 2025-ready benchmarks show exactly where bookings are won and where they quietly leak.

Marketing In The Shoe Industry Statistics
See how shoe marketers are reshaping spend and targeting in 2025, with performance signals that are forcing faster creative and smarter audience choices. One set of metrics points to rising competition while another shows where ROI is still holding up, making it clear which campaigns are winning and which are just getting impressions.
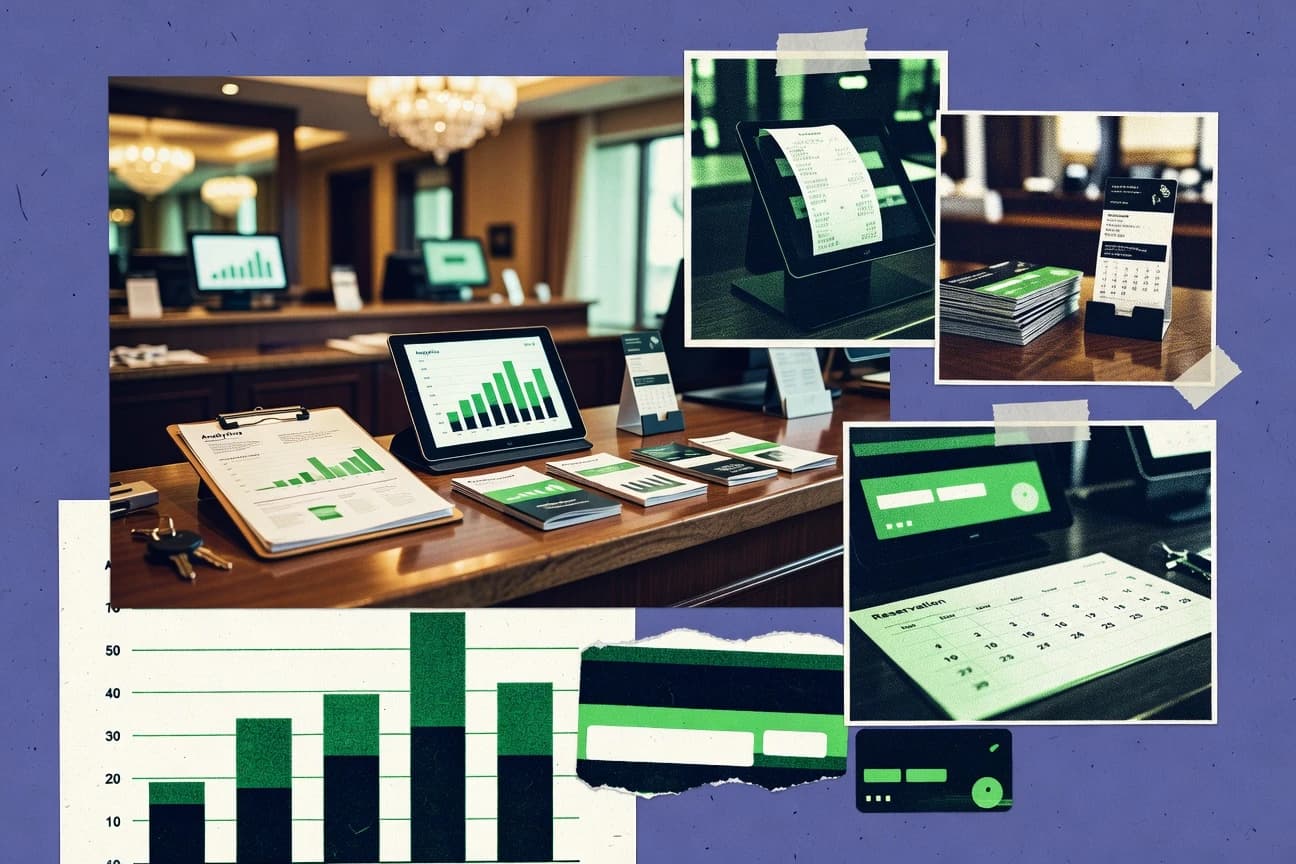
Marketing In The Hospitality Industry Statistics
With global online travel bookings up 8.4% and Google Search or Google Maps driving 57% of trip research, hospitality marketing is no longer optional, it is the channel where revenue is decided. But the gap between intent and conversion is where winners emerge as 43% of hotel websites are not mobile friendly and 53% of visits are abandoned after just 3 seconds while personalization in email can lift conversions by 1.8x.