GITNUX MARKETDATA
Browse Our Category
Marketing In Industry
Latest update:


Marketing In The Watch Industry Statistics
With global ad and commerce behavior shifting fast, this page connects the hard signals that matter for watch marketing in 2023 to the budgets and funnels you need now, from 62% of shoppers using digital research before buying to 92% of marketers stressing ROI measurement. You will also see why volatility is the norm, including the sharp export swings that can reshape seasonal planning, alongside practical benchmarks for email, SMS, influencer engagement, and paid search performance.

Marketing In The Big Data Industry Statistics
By 2025, 80% of B2C marketing organizations are expected to deliver real-time personalization across major digital channels, even as data governance and human-centered cybersecurity risks shape how safely big-data marketing can run. This page brings together the spend, adoption, and compliance pressure points behind that shift, from DMP and CDP investments to GDPR fine exposure and the data quality bottleneck that slows teams down.

Marketing In The Automobile Industry Statistics
From 71% of Gen Z shoppers valuing brand social responsibility to auto marketing budgets where digital already takes 52% of spend, this page pinpoints what actually moves car buyers and why, even as purchase timelines shrink to 12 weeks. Expect sharp contrasts like 88% swayed by online reviews and 92% driven by word of mouth, alongside what it costs to win, including luxury CAC at $450 and personalization gains that keep pushing ROI higher.

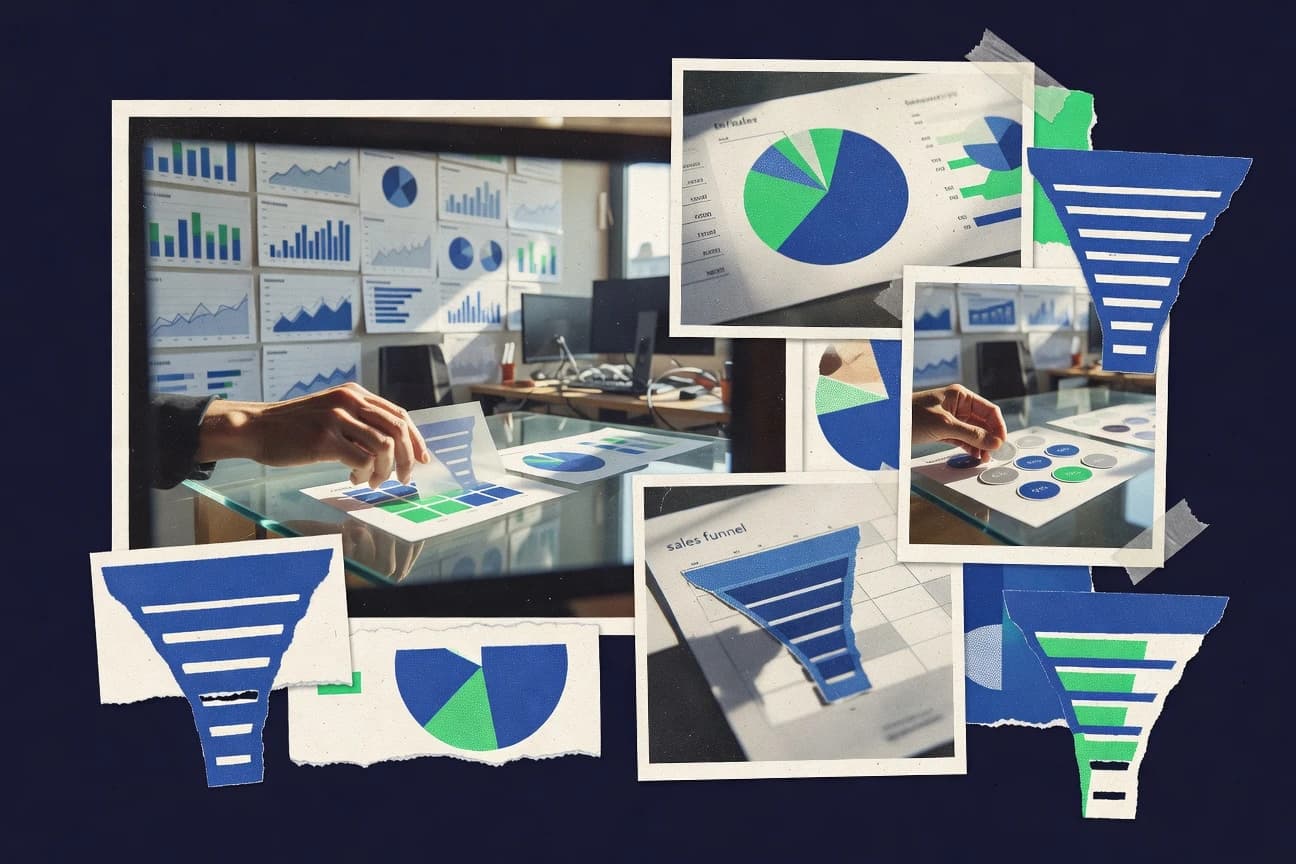
Marketing In The Peo Industry Statistics
PEO marketing is already reshaping the sales funnel, cutting the cycle to 67 days and lifting close rates to 28% for nurtured leads over 90 days, while email tops multi touch conversion at 31%. See how CRM connected, sales marketing aligned, and personalized video proposals translate into measurable gains like 2.3x higher conversions, 39% more demo momentum, and a 47% share of total PEO sales.
Marketing In The Tech Industry Statistics
Tech marketers are squeezing out 42:1 ROI from mature programs and doubling down on what actually moves pipeline, with 28% true uplift from incrementality tests and A/B testing lifting KPIs by 49% annually. If you want sharper benchmarks than generic best practices, this page connects attribution, personalization, and privacy-first measurement to outcomes like CAC at $205 for SaaS, churn at 5 to 7% monthly, and 40% better targeting from zero-party data.

Marketing In The Merchant Industry Statistics
Merchant marketing that’s optimized for retention is paying off fast, with predictive analytics implementations cutting churn 14% and personalized onboarding boosting retained merchant outcomes to 67% in the latest benchmarks. You will see exactly how channels from loyalty and referrals to search and email nurture cohorts can swing CAC, LTV, and renewal rates, including a 48% NPS link to 22% retention.

Marketing In The Material Handling Industry Statistics
Trade publications still drive 28% of qualified leads, but digital is pulling ahead fast, with 42:1 email ROI and video demos delivering a 4.1% view through rate that outperforms many older ad formats. This page maps exactly which material handling channels produce inquiries and which quietly inflate costs, so distributors and OEM marketers can shift budget with confidence.

Marketing In The 3D Printing Industry Statistics
3D printing marketing is shifting from “printer hype” to ROI, compliance, and workflow software as hardware, materials, and services all surge toward $9.6 billion in hardware by 2028 and $6.9 billion in materials by 2030, while 29% of organizations cite cost reduction as the top adoption driver. Learn how to compete where 64% of B2B marketers use content and 76% of buyers weigh compliance documentation, plus how to translate 79% software usage for additive workflows into better lead quality and conversion.

Marketing In The Consumer Goods Industry Statistics
Consumer goods marketing is getting sharper and more measurable as personalization lifts CPG click through rates by 324% in 2023 while retail media budgets jump to 29% in 2023 for a 2.5x ROI, and cross channel campaigns reach 4.2x higher engagement than single channel. You will also see how everything from emotional storytelling to geofencing, podcast trust, and shopper POS activations is driving store visits, sales, and loyalty in ways traditional TV share alone cannot explain.

Marketing In The Media Industry Statistics
From $24.5B influencer spend expected in 2024 to MarTech projected at $156.8B, this page maps how media marketing budgets are shifting while attention is pulled toward video, podcasts, and mobile viewability. You will also see why brands are pushing for data transparency and measurement and attribution, with AI adoption rising and email CTR averaging just 2.6% across industries, forcing teams to prove impact fast.
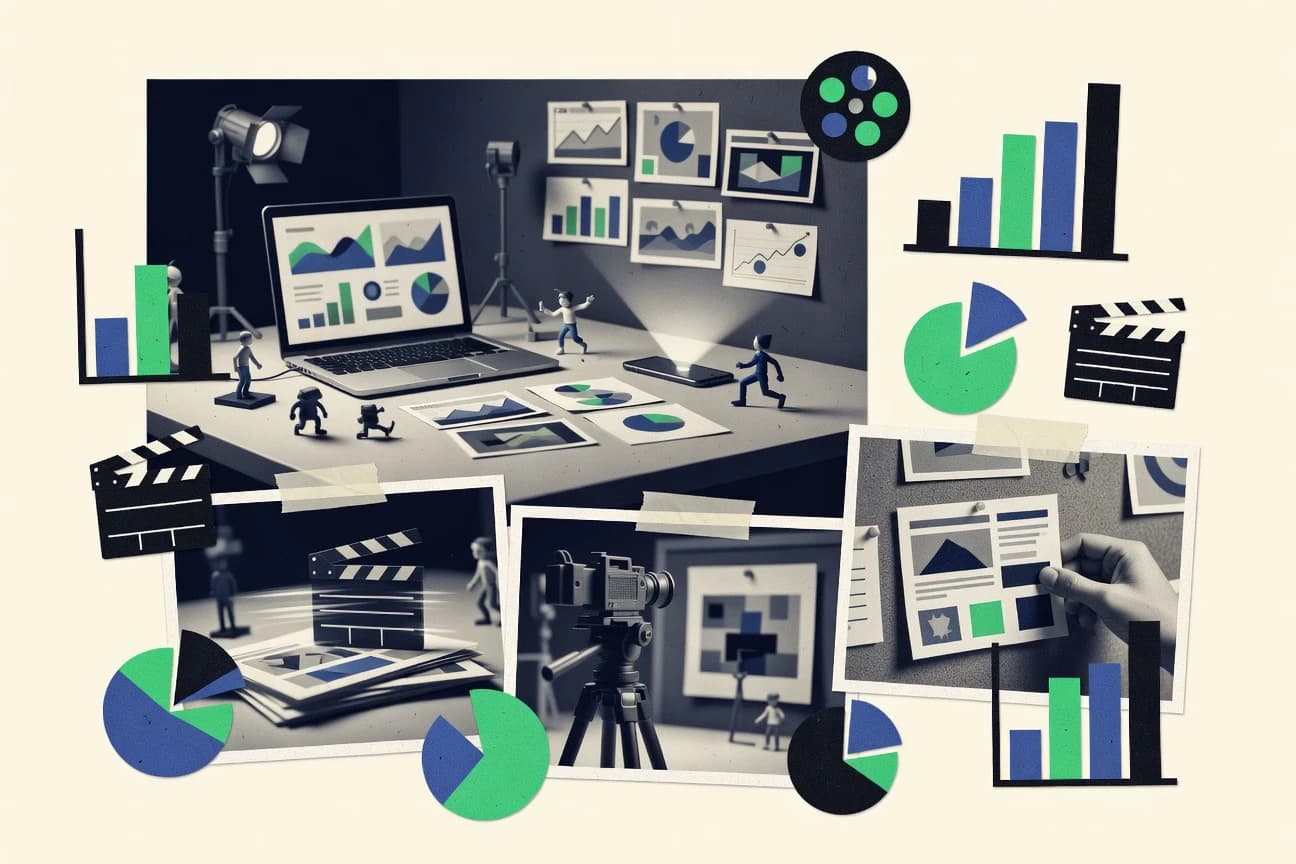
Marketing In The Animation Industry Statistics
With 92% of marketers leaning on social media and 66% planning to boost short form video spend, the fastest channels for animation brands are getting louder, not smaller. Still, the gap between spend and scale is real, as 52% cite budget limits while martech barrels ahead to $148.0B globally, pushing marketers toward more automation and first party data than ever.

Marketing In The Tourism Industry Statistics
With 86% of travelers searching online for inspiration before they book and paid search taking 41% of travel and tourism digital ad spend, tourism marketing success is less about visibility and more about capturing high intent at the exact moment people plan. The page pairs that intent with conversion pressure, from 53% of mobile visitors abandoning slow pages to Google influenced reviews shaping 35% of travel purchase decisions, so you can see where budgets drive bookings and where they silently leak.

Marketing In The Dessert Industry Statistics
Frozen desserts alone sit at US$10.5 billion globally in 2021 and the global confectionery market reaches €122.7 billion in 2023, but the page makes the bigger point that winning dessert brands are also mastering mobile speed, personalization and social proof. Expect sharp, practical benchmarks like 53% of mobile visits abandoned for slow loading, 78% swayed by UGC, and Facebook ads converting at about 9.21%, so your next campaign does not just look sweet it performs.

Marketing In The Creative Industry Statistics
Marketing budgets are scaling faster than most teams can measure, with the marketing analytics software market projected to hit $16.3 billion worldwide by 2028 and customer acquisition costs for ecommerce averaging $45.00, while marketers still struggle to prove impact. You will see how video, personalization, and AI recommendations are reshaping lead gen and conversion rates, plus the hard edges of waste, deliverability failures, and ROI tracking that separate campaigns that perform from campaigns that just spend.
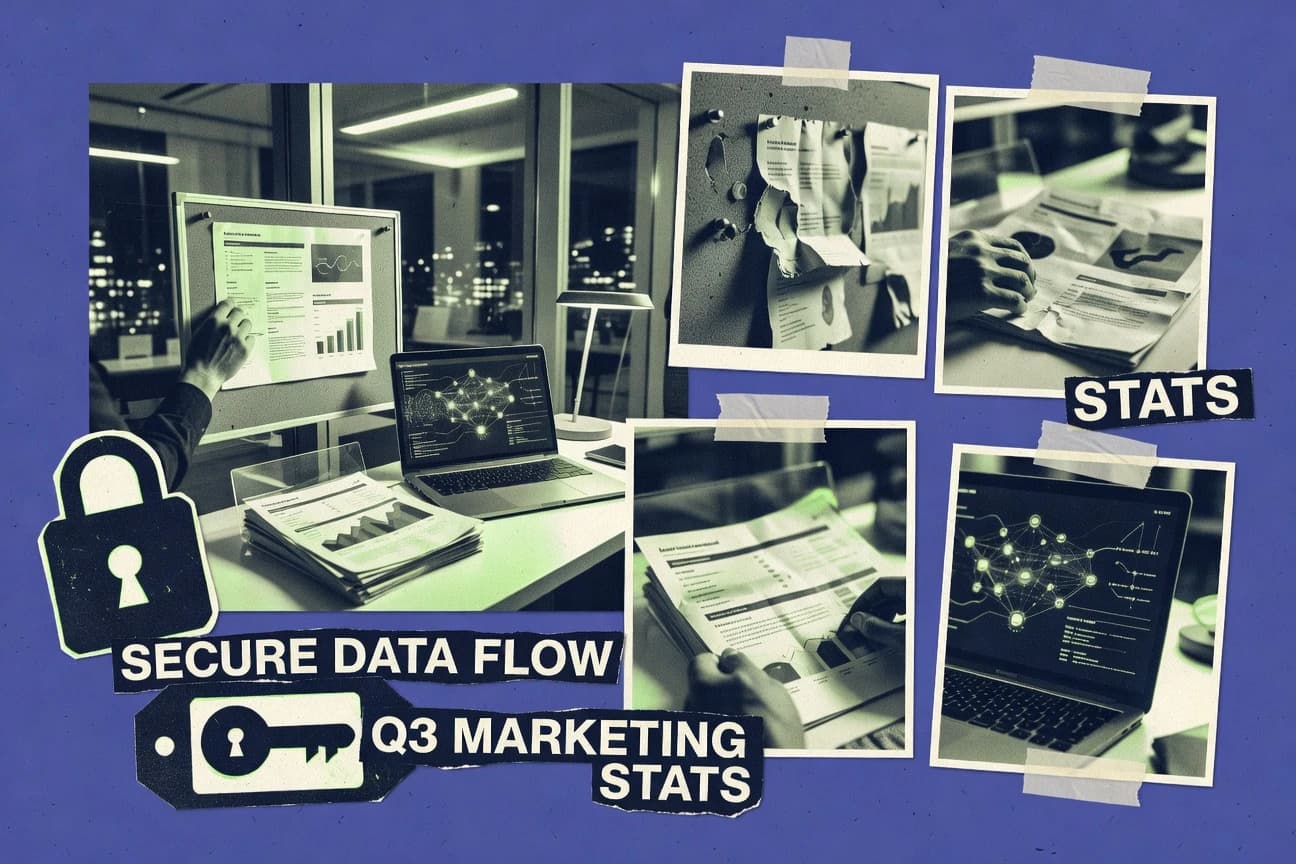
Marketing In The Cybersecurity Industry Statistics
Cybersecurity marketers are turning spend into signal at an eye opening pace, with email ROI hitting 49:1 and event marketing still delivering a 5:1 payoff, even as 75% of teams feel budget pressure and 62% struggle to measure ROI correctly. If you want the clearest 2025 guidance, this page breaks down where that money actually goes, from 78% of firms prioritizing content and SEO returning 14.6x in 6 to 12 months to why 12% of budgets get lost to poor attribution.

Marketing In The Video Game Industry Statistics
With worldwide digital ad spend climbing to $681.5 billion in 2024 and the global mobile game market hitting $54.7 billion in 2023, the page maps where budgets are really going and why social and influencer signals are winning. You will see how creators, gameplay video, and personalized messaging move behavior fast, from a 40% DAU/MAU benchmark on mobile to a 67% jump in play likelihood after watching gameplay, plus the platform fee reality that shapes margins.

Marketing In The Bpo Industry Statistics
Marketing ops and outsourced execution are surging, with the contact center services market reaching $1.49 trillion in 2024 and marketing automation users reporting 451% faster revenue growth, even as 60% of marketing leaders already outsource core operations. See how influencer budgets hit $17.2 billion and how analytics and measurement drive 8 to 12% lower marketing costs, putting real pressure on vendors to prove performance rather than just deliver assets.
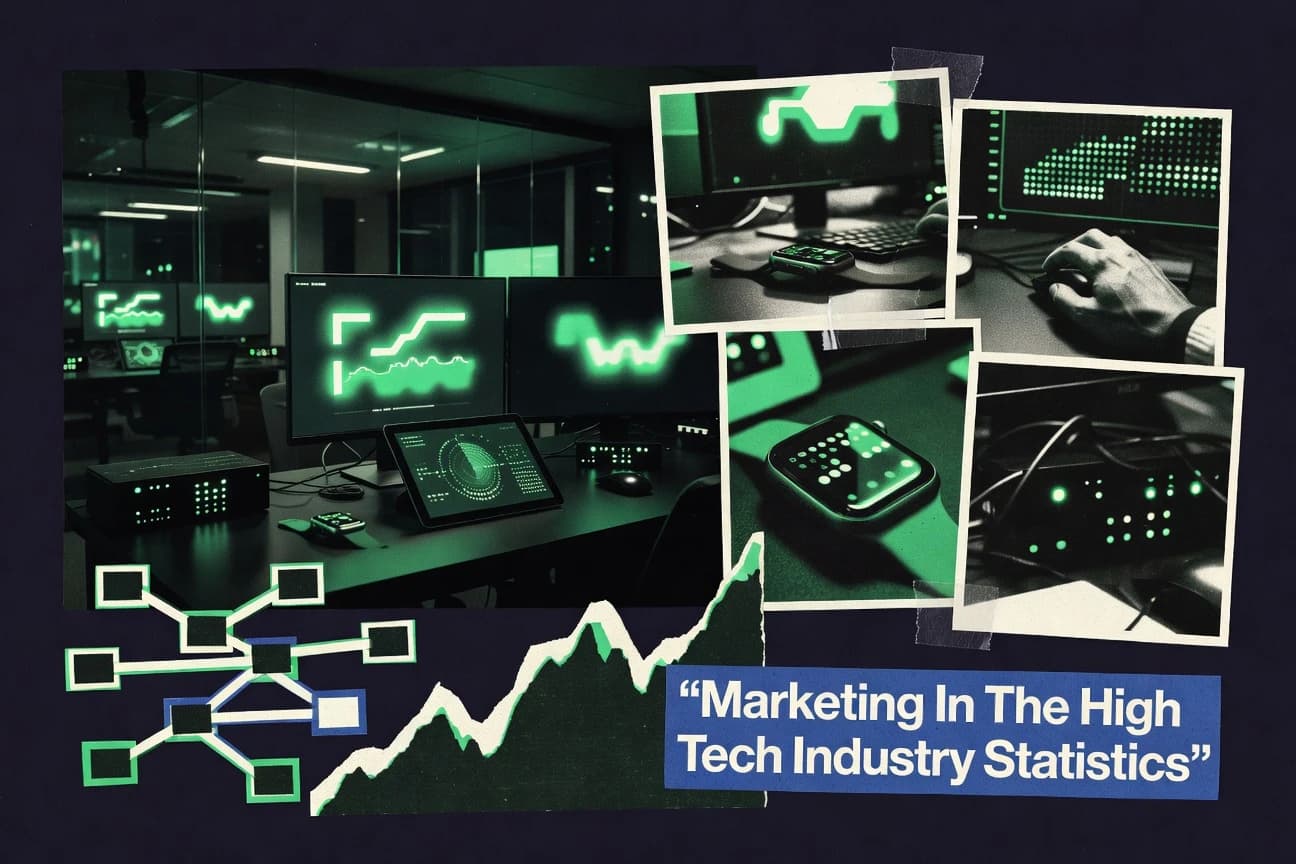
Marketing In The High Tech Industry Statistics
With 68% of marketers still naming brand awareness as the top KPI in 2024 while B2B buying expects personalization, the page puts a spotlight on what tech teams should measure when attention is the battle and trust is the conversion lever. It also stacks the practical benchmarks behind the stack and the funnel, from mobile taking 58.33% of global traffic to B2B landing pages averaging 2.35% and marketing automation reaching 75% of B2B organizations by 2025 for multi channel nurture.

Marketing In The Electronics Industry Statistics
Electronics marketing teams have more leverage than they think, from a 1.4 billion-person social reach signal to AI and automation adoption climbing fast, with a $10.5 billion global marketing analytics market forecast powering better attribution and lead scoring. But the tension is real, 46% still cite lead quality as the top challenge and 22% struggle with measurement, so this page shows exactly which channels and lifecycle tactics are worth scaling for B2B tech buying cycles.

Marketing In The Mobility Industry Statistics
Ride hailing advertising could reach $5.7B globally by 2028 while US EV advertisers are already spending $7.2B, and the page tracks what is working now across local SEO, deep links, and measurement when 49% of marketers say cross channel tracking is the hardest part. You will also see how consumer behavior is shifting toward online influence and faster decisions, with 58% relying on reviews and mobile search ads driving 60% of web traffic to automotive retail sites.