GITNUX MARKETDATA
Browse Our Category
Food Service Restaurants
Latest update:

Bar And Restaurant Industry Statistics
Track how Bar and Restaurant Industry performance is shifting in 2026, from what patrons actually pay for to how that spending translates into day to day revenue pressure. These tight, surprising statistics explain why some venues are gaining momentum while others feel stuck even when foot traffic looks steady.

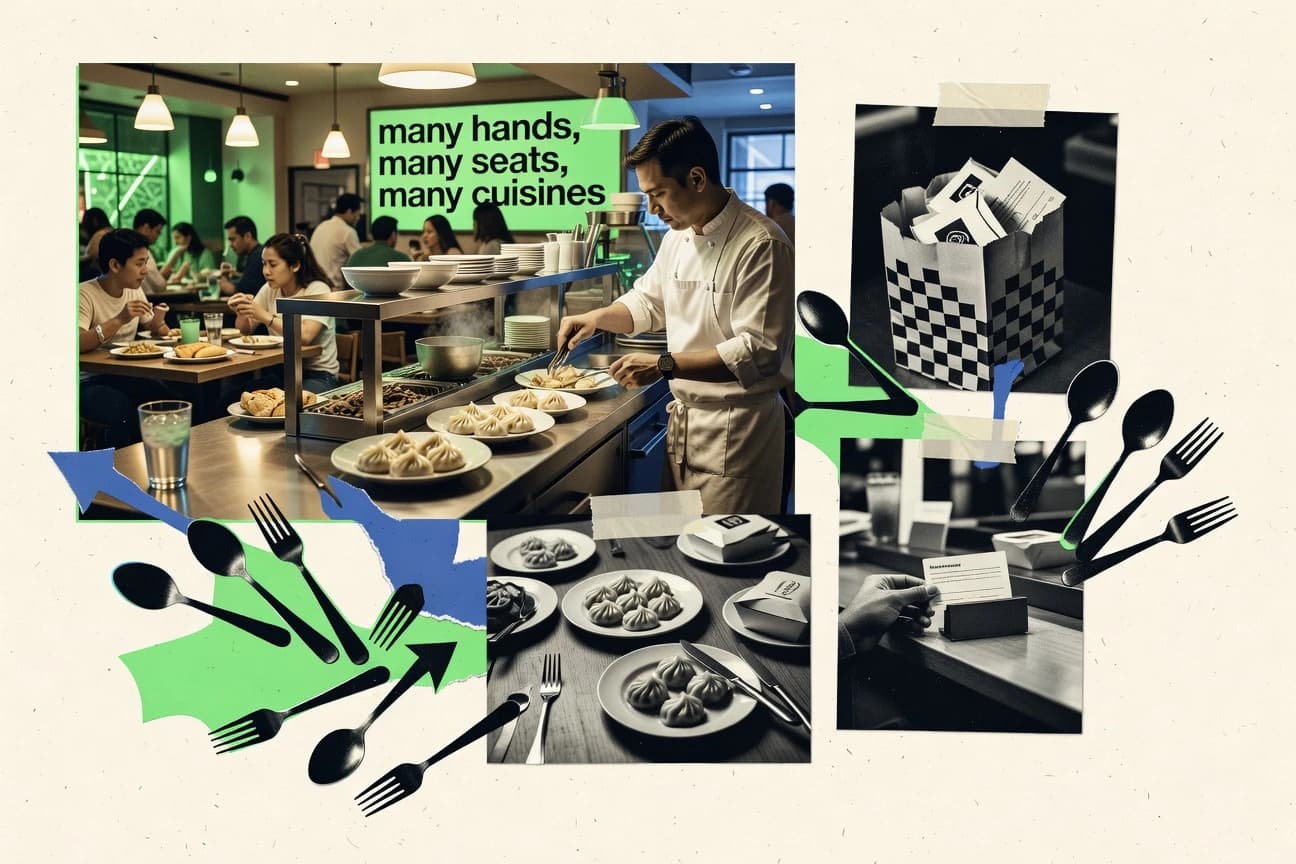
Restaurant Industry Statistics
With 57% of U.S. adults dining out at least once a week in 2023 and online reviews shaping 88% of restaurant choices, consumer habits are clearly steering the industry. From delivery behavior and plant based demand to mobile reservations, sustainability priorities, and labor pressures, these restaurant industry statistics paint a detailed picture of what diners want and what operators face. Take a closer look at the numbers to see how preferences, technology, and costs are moving together across categories.
Hotpot Industry Statistics
Hotpot Industry figures for 2026 reveal how consumer demand and supply costs are reshaping the market faster than pricing can keep up. Get the key statistics behind the shift so you can spot which operators are scaling now and which are getting squeezed.

Steakhouse Industry Statistics
Steakhouse Industry performance is shifting fast and the latest numbers highlight what is actually driving demand and profitability in 2025. See how current labor, sales, and customer spending patterns contrast with prior expectations and what that means for operators making decisions now.
U.S. Restaurant Industry Statistics
U.S. restaurant digital sales reached $99.5 billion in 2023 as delivery and pickup reshaped ordering behavior, with mobile driving 15.2% of transactions, yet staffing churn, wage pressure, and higher operating costs keep profit margins on a tight leash. This page connects consumer habits, labor and price changes such as a 8.0% delivery service price increase, and the industry’s scale of 1.0 million food service establishments, so you can see exactly what is fueling demand and what is squeezing operators.
Barbecue Restaurant Industry Statistics
Barbecue restaurant industry numbers for 2025 and 2026 reveal what’s really changing behind the smoke, from demand pressures to how dining decisions are shifting. If you run a pit, manage a dining room, or invest in brands, these figures help explain why “busy on weekends” no longer guarantees steady margins.
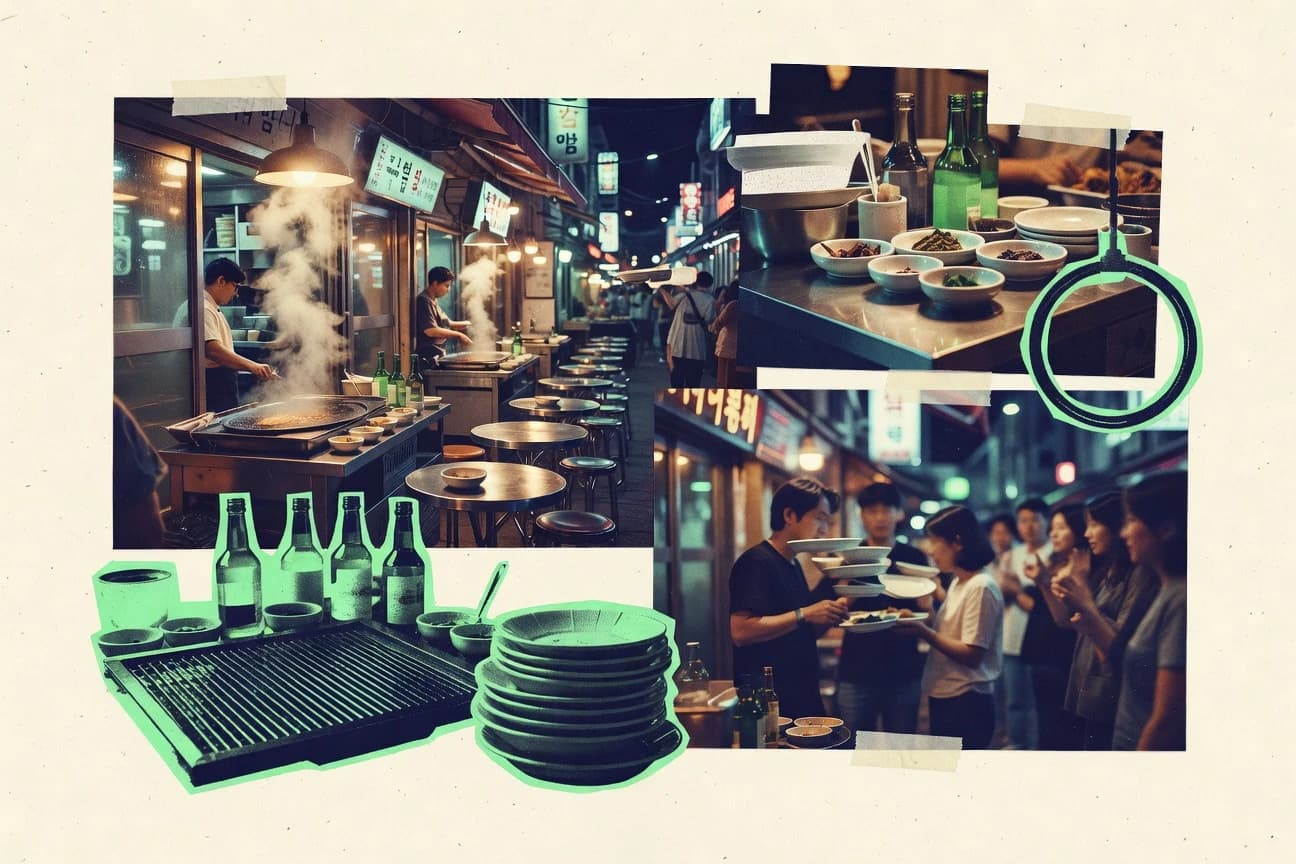
Seoul Restaurant Industry Statistics
Seoul’s restaurant industry is moving fast and the latest 2026 snapshots show where the pressure points are building, with key shifts in demand and operating conditions changing how businesses survive month to month. Read these Seoul specific stats to see exactly what’s strengthening and what’s slipping, so you can judge which segments are adapting and which are falling behind.
Global Restaurant Industry Statistics
See how global restaurant performance is reshaping fast, with 2026 and 2025 data pointing to growth where you might not expect it and pressure where margins tighten first. This page puts the latest industry figures side by side so you can spot the shifts in demand, spending, and openings before they become background noise.

Barbecue Industry Statistics
Track how barbecue consumption and buying behavior are shifting right now, with fresh 2026 figures setting the tone for what pits, sauces, and specialty cuts consumers are reaching for. You will see the sharp tension between rising demand and tightening margins that is reshaping decisions across the barbecue supply chain.
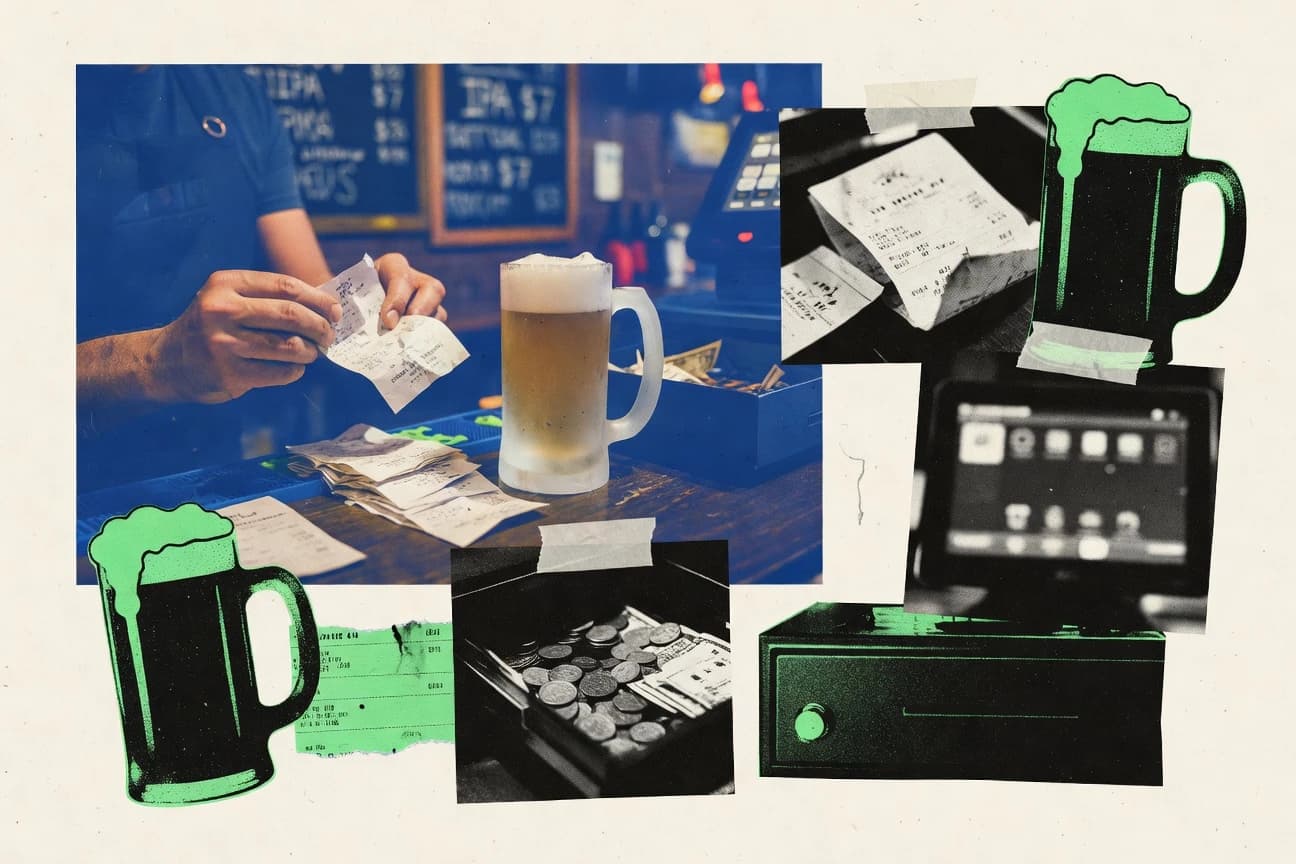
Bar Revenue Statistics
Bar Revenue tracks how bar profit and sales moved in 2025 and what shifted inside the numbers, not just the totals. If you run a venue, the most useful parts are the contrasts between where revenue rose and where it quietly stalled, so you can spot what to fix before next year.
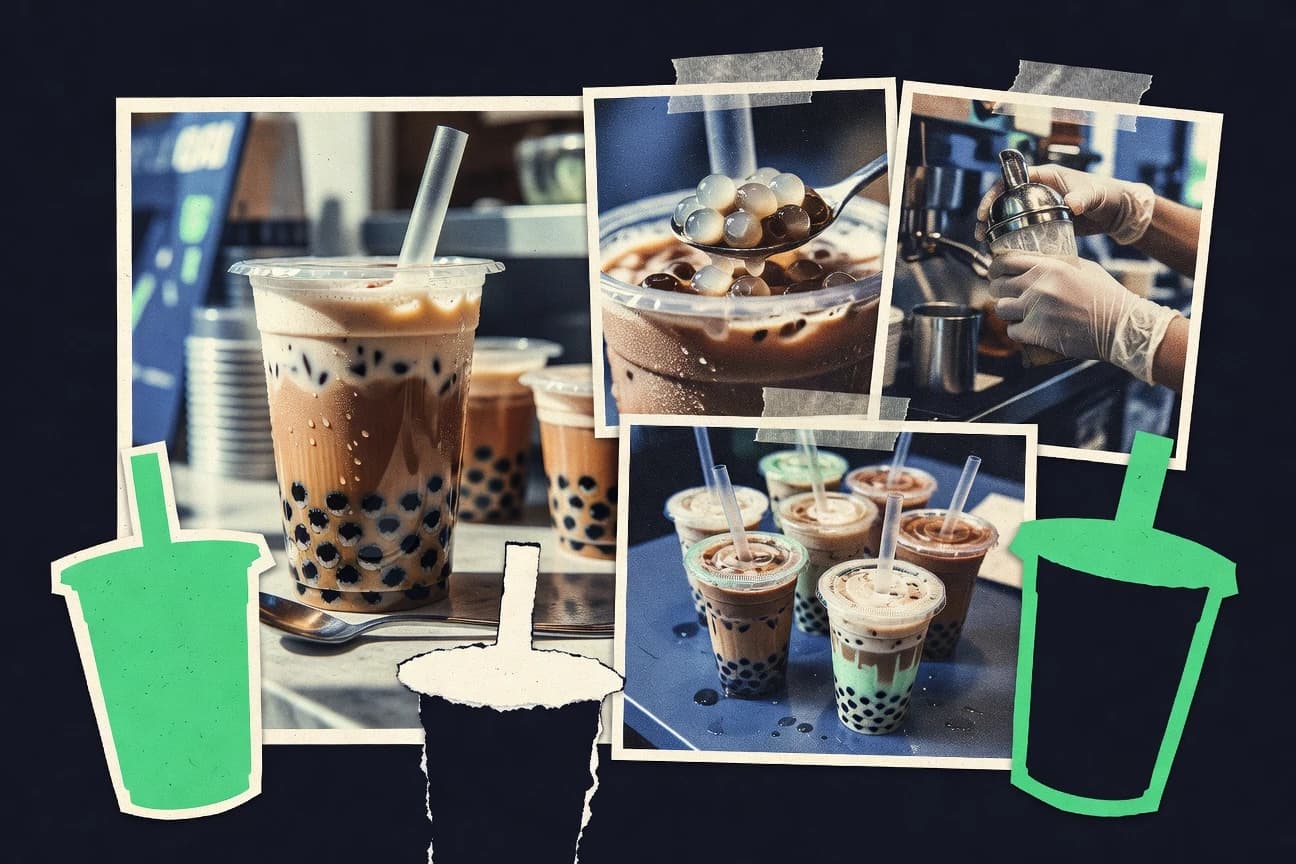
Bubble Tea Industry Statistics
Bubble tea statistics reveal how fast demand is shifting, with the market still growing and consumers increasingly choosing premium flavors over basic cups. Get the numbers behind pricing, store expansion, and what tastes are driving the next wave in 2025 so operators can spot opportunities before they become obvious.
Turkey Restaurant Industry Statistics
Turkey’s restaurant ecosystem is growing steadily at a 2.9% nominal annual pace while consumers jump ahead, with 62.9% ordering food online in 2024 and online orders already taking 31% of all restaurant transactions. At the same time, the economics look anything but stable with packaging costs up 41% and labor costs up 58% since 2020 to 2022, so this page shows how staffing, inflation pressure, and digital demand are reshaping what it takes to stay open.
Qsr Industry Statistics
QSR Industry’s latest statistics show how quickly the sector is shifting, with 2026 figures highlighting the momentum behind new demand and performance drivers. See where the growth is accelerating and where outlets are tightening up, using the year’s sharpest contrasts to separate signal from noise.
Fast Casual Restaurant Industry Statistics
Fast casual spending and unit growth trends are shifting in 2025, with recent figures pointing to a tighter line between bargain drivers and loyalty powered repeat visits. Read the stats to see which parts of the industry are accelerating and which are stalling as operators adapt pricing, labor, and speed expectations.

Coffee Shop Statistics
Coffee Shop stats reveal 2026 customer demand is shifting fast, with peak time traffic showing a sharper swing than many shops predicted. You will see which service details and pricing moves most directly correspond to that change, so you can stop guessing and start planning.

Japan Nightlife Industry Statistics
Japan’s nightlife market is currently valued at about US$2.4 billion and is forecast to reach roughly US$3.4 billion by 2028, growing at about 7.2% CAGR, with bars, pubs, and nightclubs widening at different speeds alongside inbound tourism demand. Track how everything from JNTO arrivals and exchange rates to alcohol consumption, venue counts, and spending patterns shapes where the money flows, and why “going out” is still tightly linked to travel, price levels, and late night regulations.
Qsr Restaurant Industry Statistics
With U.S. QSR sales estimated at $353.6 billion in 2024, this page pairs growth that feels steady with the reality that digital is already doing the heavy lifting. From 2.6% transaction growth and $1.22 million estimated AUV to 40% digital ordering penetration and rising menu prices, you will see exactly how loyalty, delivery, and drive thru throughput are reshaping traffic, margins, and staffing.
Pizza Industry Statistics
See what’s changed for pizza operators as 2026 forecasts point to growing demand while margins and labor pressures pull in the opposite direction. This page pulls together the most telling Pizza Industry metrics so you can separate what’s expanding from what’s getting harder.
Bar Nightlife Industry Statistics
Bar Nightlife Industry trends are being shaped by a sharp squeeze and a smarter guest journey at the same time, from inflation driven menu pricing and labor cost pressure to the way mobile booking, digital menus, and contactless payments are now baked into where people go out. Start with the surprise mix of 62.1% of U.S. adults reporting lifetime binge drinking and the fact that 62% of nightlife visitors prioritize proximity, then compare that with $28.7 billion in U.S. bar and restaurant sales and Japan’s ¥3.0 trillion alcohol nightlife market for the cross market reality behind demand, spend, and risk management.

Korean Cafe Industry Statistics
Korean cafe industry numbers for 2025 and the latest retail and consumer signals reveal a market where foot traffic and spending patterns are shifting faster than the storefront count. Read this to see which segments are gaining and which are losing ground right now, instead of assuming the same café boom is still driving growth.