
The global bubble tea market is set to reach $4.72 billion by 2030, growing at a 6.8% compound annual rate. Weekly habits and flavor shifts are reshaping demand, including 72% of urban millennials ages 18 to 34 who drink bubble tea at least weekly. Profit and operations numbers also explain why growth looks uneven, including delivery partnerships that can raise sales by 40% for bubble tea brands.
Key Takeaways
- Bubble tea franchises average 20% of revenue from ingredient sales.
- 72% of millennials aged 18-34 consume bubble tea weekly in urban areas.
- The global bubble tea market size was valued at USD 2.79 billion in 2022 and is projected to grow to USD 4.72 billion by 2030 at a CAGR of 6.8%.
- Tapioca pearl production in Taiwan totals 200,000 tons annually.
- Asia Pacific holds 65% of global bubble tea market share in 2023.
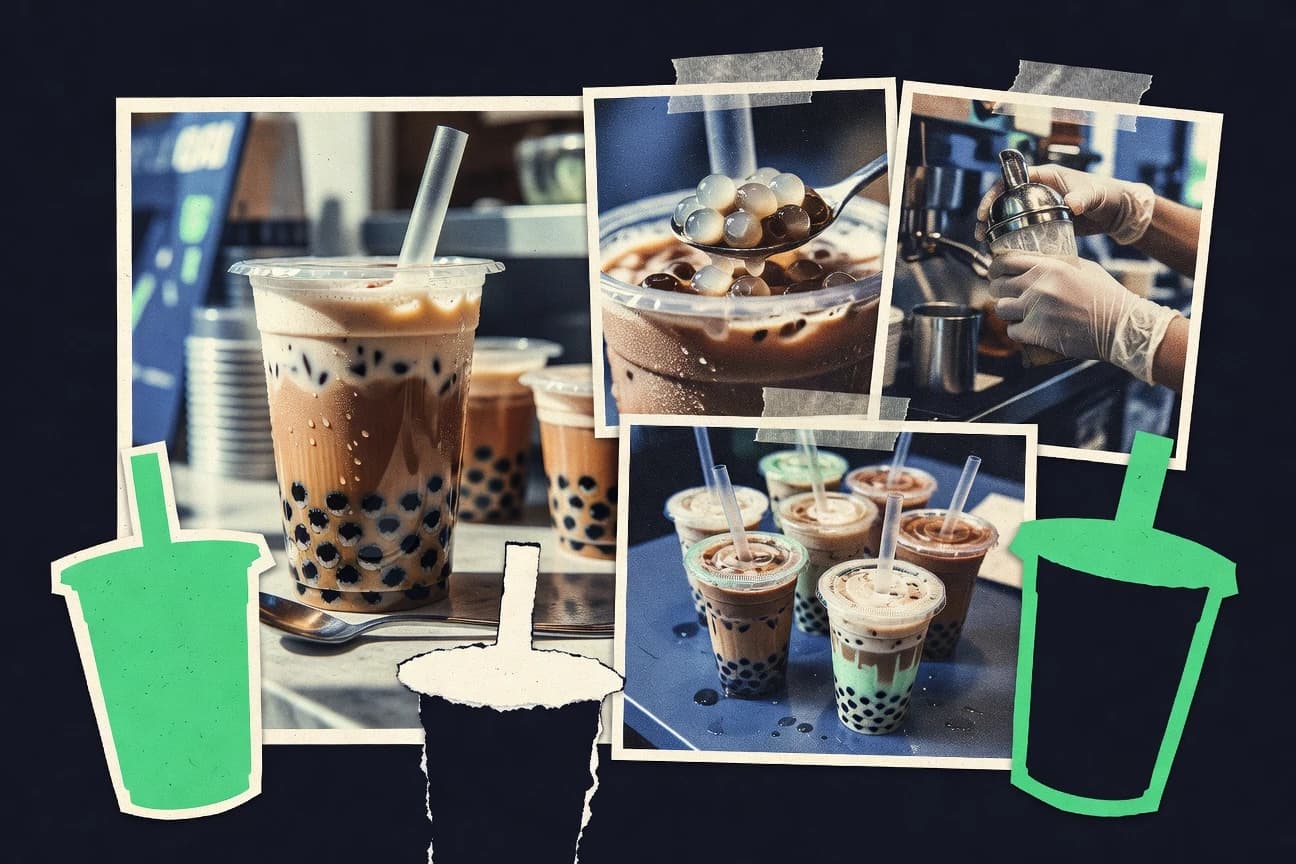
Bubble tea is booming globally, with rapidly growing sales and demand across major markets worldwide.
Related reading
01 · Category
Business Operations & Innovations25 stats
01
Bubble tea franchises average 20% of revenue from ingredient sales.
02
Average bubble tea shop startup cost $150,000-$300,000 USD.
03
Profit margins for bubble tea shops average 25-35% per drink.
04
Top chains like Gong Cha have 2,000+ global outlets with $10k avg monthly revenue.
05
Delivery partnerships boost sales 40% for bubble tea brands.
06
Loyalty apps retention rate 75% for bubble tea chains.
07
R&D spend on new flavors 5% of revenue for leading firms.
08
Vending machine bubble tea sales up 50% post-pandemic.
09
Merchandise sales contribute 10% revenue to bubble tea cafes.
10
Employee turnover rate 30% annually in bubble tea shops.
11
Pop-up bubble tea events generate $5,000avg per weekend.
12
Sustainability packaging adoption 60% among top 100 chains.
13
AI menu optimization increases sales 15% in test shops.
14
Franchise fees average $30,000initial for bubble tea brands.
15
Peak hour sales 60% of daily revenue 4-7 PM.
16
Cross-promotions with gyms boost health variant sales 25%.
17
NFT loyalty programs trialed by 5 major chains for exclusives.
18
Average shop size 1,200 sq ft with 40 seats.
19
Inventory turnover 7 days for fresh ingredients.
20
Social media marketing ROI 8:1 for bubble tea brands.
21
Drive-thru bubble tea models up 20% in suburbs.
22
Collagen-added bubble tea innovation sales 15% of menu.
23
AR filters for bubble tea customization boost engagement 30%.
24
Zero-waste shops recycle 90% of pearl starch byproduct.
25
Cloud kitchen bubble tea ops cut costs 25%.
Interpretation
Business Operations & Innovations Interpretation
Forget the pearls, the real tapioca balls in this business are your data-driven customers, whom you must caffeinate, charm, and algorithmically retain through a 25% profit-margin maze while fending off a 30% staff turnover and innovating with everything from collagen to NFTs—all before the 4 PM rush that decides your fate.
02 · Category
Consumer Trends & Preferences24 stats
01
72% of millennials aged 18-34 consume bubble tea weekly in urban areas.
02
45% of Gen Z consumers prefer taro flavor bubble tea over classic milk tea.
03
62% of female consumers choose low-sugar bubble tea options in 2023 surveys.
04
58% of bubble tea drinkers aged 16-24 experiment with at least 3 toppings per drink.
05
41% of consumers visit bubble tea shops 2-3 times weekly, per 2023 global poll.
06
Matcha bubble tea accounts for 28% of flavor preferences among health-conscious buyers.
07
67% of U.S. consumers under 30 prefer plant-based milk in bubble tea.
08
Average spend per bubble tea visit $5.50USD among urban millennials.
09
55% of consumers seek customizable bubble tea options like adjustable sweetness.
10
Fruit tea bubble tea variant popular with 39% of summer consumers.
11
76% of loyalty program members repurchase bubble tea within a week.
12
49% prefer chewy tapioca pearls with 8-10mm diameter.
13
Vegan bubble tea demand up 32% among 25-34 age group in 2023.
14
64% of Asian consumers pair bubble tea with snacks like mochi.
15
Social media influences 81% of Gen Z bubble tea purchases.
16
52% avoid high-calorie bubble teas over 300 calories per serving.
17
Cheese foam topping chosen by 37% of repeat customers.
18
69% of students buy bubble tea as a study break treat.
19
Organic tea leaves preferred by 44% premium segment consumers.
20
73% of urban professionals seek caffeine-free herbal bubble teas.
21
Repeat purchase rate 68% driven by flavor innovation.
22
56% prefer medium sweetness level (50% sugar).
23
Delivery app orders make up 42% of total bubble tea sales among youth.
24
61% influenced by Instagram aesthetics in choosing shops.
Interpretation
Consumer Trends & Preferences Interpretation
The next generation of urbanites has engineered a weekly ritual of hyper-customizable, Instagrammable, and slightly virtuous indulgence where the tapioca must be perfectly chewy, the sugar adjustable, and the oat milk optional—all for the low, low price of funding a barista's art school dreams.
03 · Category
Market Size & Growth29 stats
01
The global bubble tea market size was valued at USD 2.79 billion in 2022 and is projected to grow to USD 4.72 billion by 2030 at a CAGR of 6.8%.
02
U.S. bubble tea market revenue reached $576 million in 2023, with a forecasted CAGR of 7.2% through 2028.
03
China's bubble tea market generated RMB 348 billion (USD 49 billion) in 2022, dominating 40% of global share.
04
Taiwan's bubble tea industry exports hit NT$10.5 billion in 2023, up 15% YoY.
05
Global bubble tea market expected to reach $6.5 billion by 2027 at 8.1% CAGR from 2020 base.
06
Europe bubble tea market grew at 9.5% CAGR from 2018-2023, valued at EUR 450 million in 2023.
07
India's bubble tea sector valued at INR 1,200 crore in 2023, projected 12% CAGR to 2028.
08
Southeast Asia bubble tea market size was $1.2 billion in 2022, expected 10.2% CAGR to 2030.
09
Australian bubble tea market revenue $150 million AUD in 2023, growing at 8.4% annually.
10
UK bubble tea sales increased 22% YoY to £85 million in 2023.
11
Brazil bubble tea market emerging at $50 million in 2023, 15% CAGR projected.
12
South Korea bubble tea consumption volume 250 million servings in 2023.
13
Global bubble tea chain stores numbered over 450,000 in 2023, up from 380,000 in 2020.
14
Japan bubble tea market valued at JPY 120 billion in 2023.
15
Canada bubble tea market size $120 million CAD in 2023, 9% growth.
16
Middle East bubble tea market to reach $300 million by 2028 at 11% CAGR.
17
Africa bubble tea market nascent at $20 million in 2023, 18% CAGR forecast.
18
New Zealand bubble tea revenue NZD 45 million in 2023.
19
Singapore bubble tea market S$250 million in 2023.
20
Thailand bubble tea sales THB 15 billion in 2023.
21
Vietnam bubble tea market VND 5 trillion in 2023.
22
Philippines bubble tea industry PHP 10 billion in 2023.
23
Malaysia bubble tea market MYR 1.2 billion in 2023.
24
Indonesia bubble tea consumption 500 million cups in 2023.
25
Global online bubble tea sales grew 25% YoY to $800 million in 2023.
26
U.S. bubble tea franchise market $200 million in 2023.
27
35% of global bubble tea revenue from ready-to-drink formats in 2023.
28
Bubble tea powder market $1.1 billion globally in 2023.
29
Instant bubble tea market to hit $500 million by 2025.
Interpretation
Market Size & Growth Interpretation
The world has clearly decided that sucking chewy balls through a straw is not just a passing fancy but a serious, multi-billion-dollar global movement, one tapioca pearl at a time.
More related reading
04 · Category
Production & Ingredients22 stats
01
Tapioca pearl production in Taiwan totals 200,000 tons annually.
02
Global black tea supply for bubble tea 150,000 metric tons per year.
03
Tapioca starch imports to China 500,000 tons for bubble tea in 2023.
04
Milk powder usage in bubble tea industry 80,000 tons globally.
05
Synthetic pearl production costs $0.50/kg in Vietnam factories.
06
Assam tea leaves comprise 60% of bubble tea black tea blends.
07
Oat milk alternatives production up 40% for bubble tea vegan options.
08
Cassava root sourcing from Thailand 300,000 tons for pearls.
09
Flavor syrup manufacturing for bubble tea $200 million market.
10
Boba pearl machinery output 1,000 kg/hour in top factories.
11
Organic tapioca pearls premium priced at $2/kg vs $0.80 standard.
12
Brown sugar syrup usage 50,000 tons in Asia bubble tea production.
13
Powdered creamer imports to U.S. for bubble tea 20,000 tons/year.
14
Fruit puree supply chain for lychee flavor 10,000 tons annually.
15
Gelatin-free agar agar for vegan pearls 5,000 tons global.
16
Tea leaf fermentation process optimized for 70% bubble tea blends.
17
Taro powder production in China 15,000 tons for bubble tea.
18
Evaporated milk cans used 100 million units in industry.
19
Konjac root alternative pearls 2,000 tons low-calorie production.
20
Matcha powder global supply 8,000 tons for bubble tea variants.
21
Average bubble tea shop brews 500 liters of tea base daily.
22
Supply chain lead time for pearls 7 days from farm to shop.
Interpretation
Production & Ingredients Interpretation
A staggering global ecosystem now orbits the humble cup, as Taiwan's 200,000 tons of pearls meet Vietnam's cheap production, China's massive imports, a $200 million syrup market, and even 5,000 tons of vegan agar, all to ensure your average shop can brew its 500 daily liters with a seven-day farm-to-straw supply chain.
05 · Category
Regional Analysis22 stats
01
Asia Pacific holds 65% of global bubble tea market share in 2023.
02
Taiwan birthplace of bubble tea with 85% market penetration among youth.
03
China has over 400,000 bubble tea outlets, 90% of Asia's total.
04
U.S. West Coast accounts for 45% of national bubble tea sales.
05
Southeast Asia bubble tea growth at 12.5% CAGR led by Thailand and Vietnam.
06
Europe market led by UK with 30% share, Germany 20%.
07
India Northern states contribute 55% of bubble tea consumption.
08
Australia urban centers like Sydney host 60% of outlets.
09
South Korea Seoul has 5,000+ bubble tea cafes, 40% of national total.
10
Brazil urban South East region 70% market share.
11
Japan Tokyo-Yokohama area 50% of bubble tea sales.
12
Canada Toronto and Vancouver combined 55% national sales.
13
Middle East UAE Dubai leads with 35% regional outlets.
14
Africa South Africa Johannesburg 60% of continent's bubble tea market.
15
Singapore per capita bubble tea spend highest globally at $25USD/year.
16
Thailand Bangkok 70% of national bubble tea revenue.
17
Vietnam Ho Chi Minh City 45% market share.
18
Philippines Manila Metro 65% of outlets.
19
Malaysia Kuala Lumpur 55% consumption.
20
Indonesia Jakarta 50% sales volume.
21
New Zealand Auckland 70% market.
22
UK London 40% of Europe-wide sales.
Interpretation
Regional Analysis Interpretation
Asia Pacific may be the undeniable bubble tea empire, but its dominions are ruled from fiercely loyal city-states, each with a tapioca pearl-laden scepter held aloft in a wildly specific demographic stronghold.
Reference
Cite This Report
This report is designed to be cited. We maintain stable URLs and versioned verification dates. Copy the format appropriate for your publication below.
APA
Gabrielle Fontaine. (2026, February 13). Bubble Tea Industry Statistics. Gitnux. https://gitnux.org/bubble-tea-industry-statistics
MLA
Gabrielle Fontaine. "Bubble Tea Industry Statistics." Gitnux, 13 Feb 2026, https://gitnux.org/bubble-tea-industry-statistics.
Chicago
Gabrielle Fontaine. 2026. "Bubble Tea Industry Statistics." Gitnux. https://gitnux.org/bubble-tea-industry-statistics.
Sources & references
100 datasets cited across this report · attribution is report-level