GITNUX MARKETDATA
Browse Our Category
Environment Energy
Latest update:


Calgary Oil Gas Industry Statistics
Calgary’s energy ecosystem still punches above its weight, with energy exports hitting CAD 120 billion in 2023, while tax receipts flow through at CAD 15 billion provincially in 2022 and property taxes add another CAD 2.8 billion in 2023. See how production spending and tight operational details connect to a CAD 35% share of Calgary GDP in 2023, a 2.5x multiplier on direct GDP in 2022, and the workforce scale that stretches to 250,000 cluster jobs including indirect work.

Houston Oil Gas Industry Statistics
Houston energy is still a spreadsheet powerhouse, from Chevron Phillips making 4 million tons of ethylene a year to Shell running Gulf operations on $30 billion in annual revenue. But the most striking split is scale versus capability, with Houston refining and logistics where 29 refineries and 40 gas processing plants back a 20 million barrels per day pipeline and petrochemical corridor, while upstream, R and D, and workforce depth keep the city’s output and innovation moving.

Fuel Industry Statistics
The world ran on 99.7 million bpd of oil in 2022, while global gasoline demand hit 25.5 million bpd and diesel climbed to 32.2 million bpd, setting up a stark split between everyday transport needs and the emissions footprint that followed. Follow the same page from fuel prices and production to climate impacts and reserves, where fossil fuel industry emissions reached 37.4 GtCO2 in 2022 and global oil inventories slipped by 1.4 million bpd.
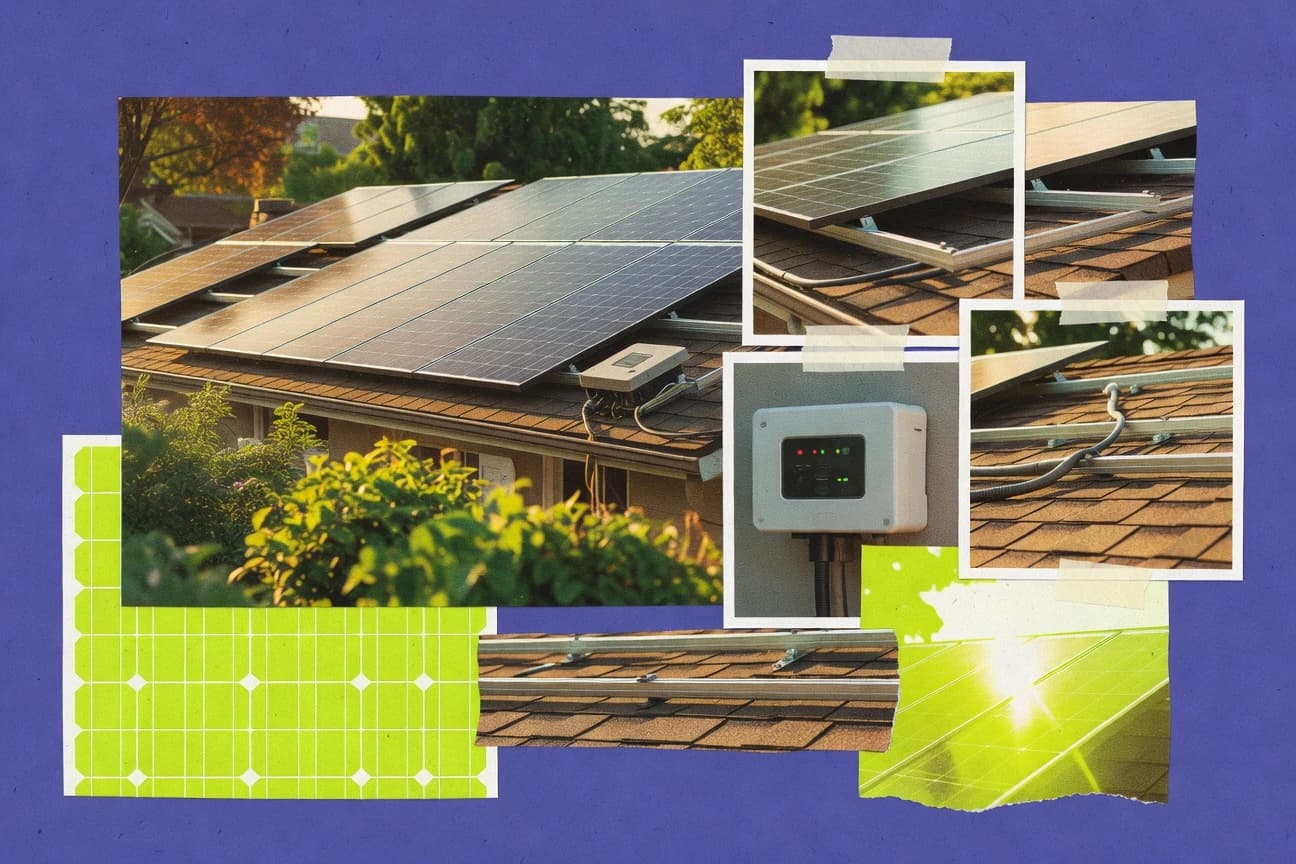
Residential Solar Energy Industry Statistics
Residential solar has kept getting cheaper while buying behavior is shifting fast, with 2023’s levelized cost dropping to $0.08/kWh alongside an average $1,500 per year household savings. Track how $2.72/W costs stayed steady despite supply strain, while new policy shocks like NEM 3.0 and the rise of paired storage reshape payback, financing, and where systems actually get built.

Energetics Industry Statistics
Global energy is still rising, but the direction of pressure is shifting fast, with renewables hitting 29.3% of electricity consumption in 2022 alongside global CO2 emissions from energy at 36.8 Gt and fossil fuels driving 89% of energy related greenhouse gases. This Energetics Industry statistics page brings the sharp, regional contrasts into one place, from Europe’s gas drop to half by H2 2022 and EU final energy falling 4.3% to US residential energy use of 21.7 quads and the market scale that topped $8.2 trillion in 2022.

Bushfires In Australia Statistics
Black Summer alone burned 18 million hectares in 2019 to 2020, releases an estimated 830 million tonnes of CO2 equivalent, and left 3 billion animals dead or displaced, while the human toll reached 33 direct deaths and over 3,000 smoke inhalations. This page sets those shocks beside historic events like Black Saturday’s 450,000 hectares and 173 deaths, then follows the climate projections that point to longer, hotter, more fire prone seasons ahead.

Nuclear Energy Safety Statistics
Nuclear power delivers about 0.03 deaths per TWh, versus coal at 24.6 and oil at 18.4, with WHO and IEA linking fossil fuels to 8 million premature deaths each year from air pollution while nuclear is reported as zero. The page pairs dose and incident accounting, including no Level 7 INES accidents since 1986 and nuclear plant exposure averaging about 0.0001 mSv lifetime for an average person, with a broader safety comparison that reaches dam failures, mining, pipeline explosions, and even energy supply chains.
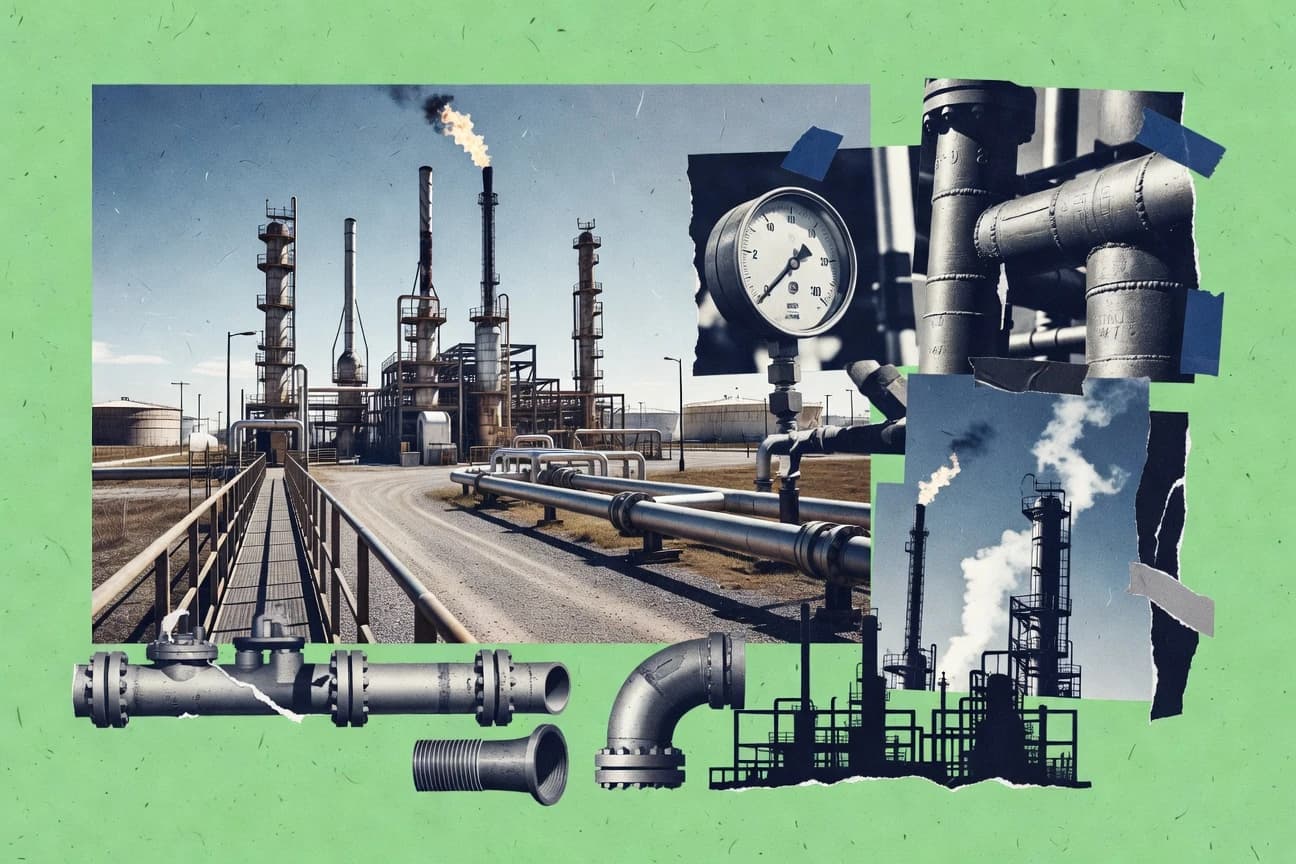
Gas And Oil Industry Statistics
Fossil fuels still supply 98.4 EJ of primary energy, yet 39.8% of electricity generation is coal driven, placing hydrocarbons in direct competition with power sector electrification while methane abatement proves cost feasible at about $0.3 to $0.6 per kg CH4 avoided. Track the operational scale and pressure points behind the headline totals, from US refinery throughput and gas volumes to 30% to 50% methane cuts from LDAR and benchmark prices that shape refinery economics and upstream investment.

Us Oil Gas Industry Statistics
U.S. crude oil capacity scheduled for April 2024 sits at 10.8 million b/d while 8.82 million b/d averaged U.S. production in 2023, a tight supply balance that helps explain the export and refinery push that follows with distillate production at about 7.1 million b/d. The page also tracks methane and cost pressure in hard figures, including routine flaring down 12.3% vs 2019 and upstream lifting costs falling 11.6% from 2019 to 2023, alongside $12.2 billion in natural gas gathering and processing capex and $70 billion in shale project spending in 2023.

Nuclear Power Safety Statistics
Even with core damage targets as stringent as 10−4 to 10−6 per reactor year and multi source offsite power designed to cut common cause failures, nuclear safety also looks beyond hardware to commissioning, safety assessment, and severe accident management coverage that still leaves big gaps. The page ties IAEA defense in depth and safety function classifications to real world reliability indicators, public health context, and U.S. containment performance, including a 98% fleet capacity factor in 2023, so you can see how standards, probabilistic risk targets, and operating experience all meet at the same pressure point.

Texas Energy Industry Statistics
See how Texas power and fuels stay balanced on a knife edge as ERCOT brings about 22,700 MW of generating capacity online and wind and solar supply 34% of capacity in 2024, while the state exports 2.3 Bcf/d of natural gas to Mexico and runs 90% refinery utilization. You will also find the softer side of industry math behind the headlines, including 2.9 million metric tons of CO2e from flaring and the price swings that tie Henry Hub at $4.20 per MMBtu to what Texans pay and how the grid holds.

Electrification Industry Statistics
See why 2023 was a turning point for electrification. With 2.4 million electric vehicles sold in the US and grids scaling up for higher loads, the page links record clean generation growth, $560 billion in grid and network investment, and a fast build of substation and transformer capacity to the practical bottleneck that could otherwise slow charging, reliability, and decarbonization.
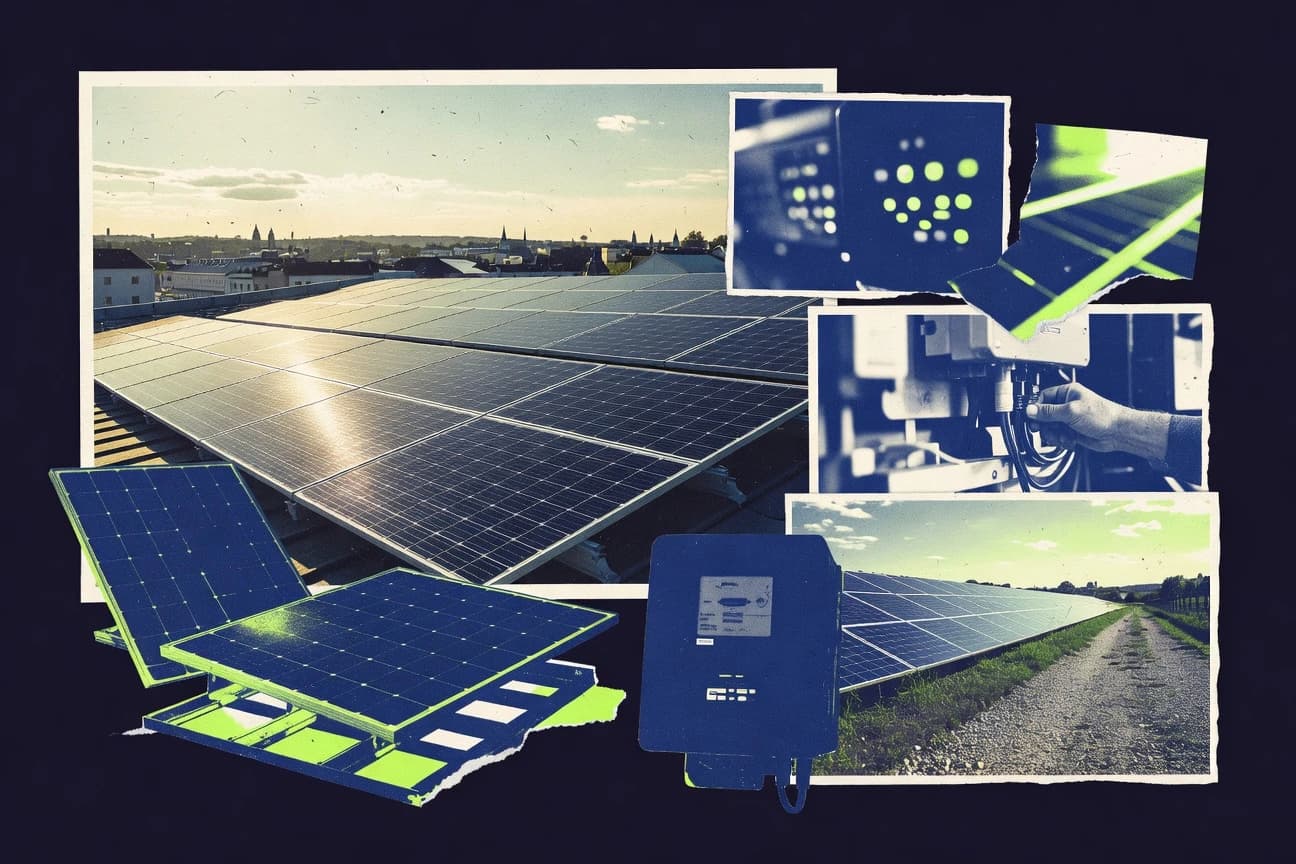
Europe Solar Industry Statistics
Europe’s solar buildout kept accelerating into 2023 with countries like Germany adding 9.0 GW and the Netherlands reaching over 1 million distributed installations, while global module prices slid about 20% year on year in the first half of 2024 and IEA says they hit historically low levels in 2024. You will see how performance limits and reliability in Europe are shaped not by headline capacity but by capacity factors around 13.7%, region wide yield swings, and the quiet bottlenecks like soiling and grid connection availability.
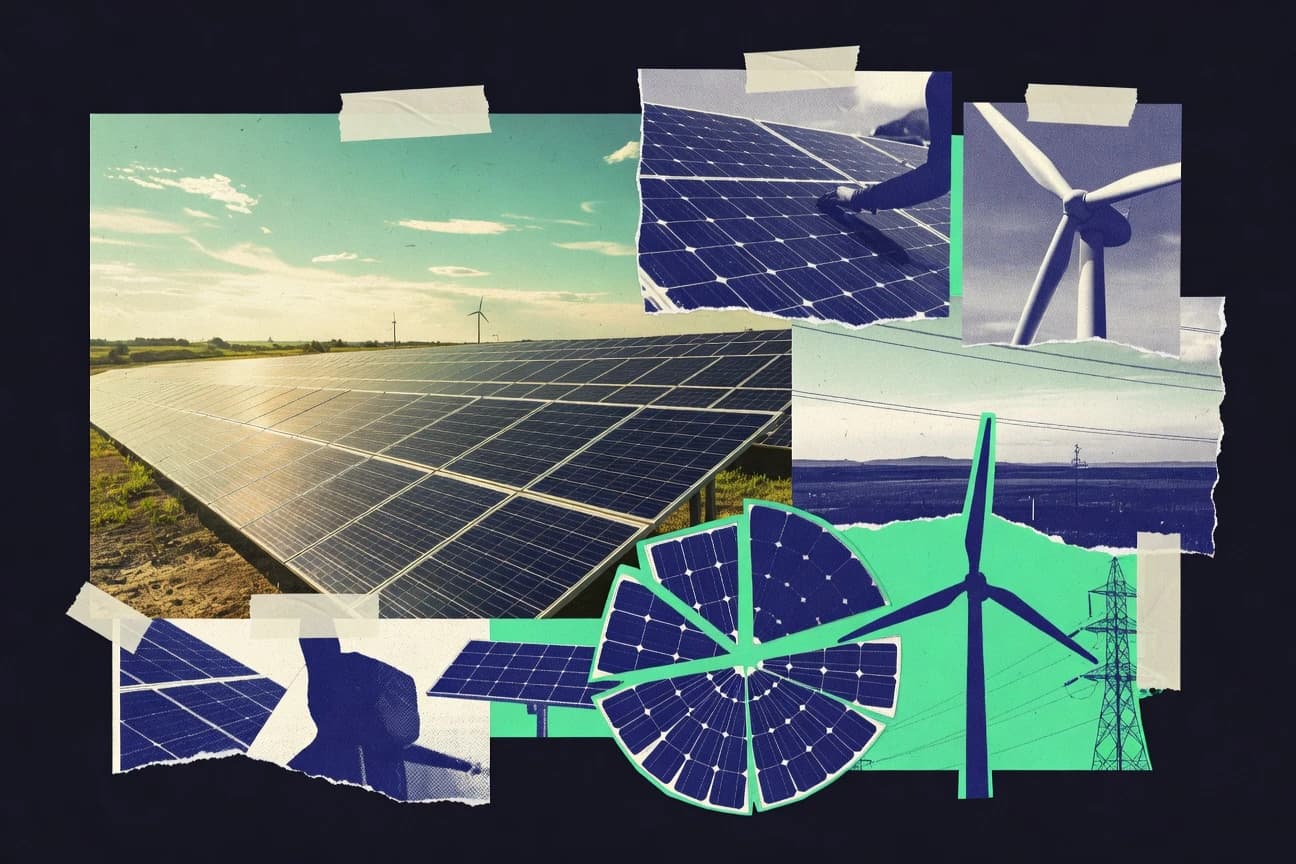
Renewable Energy Statistics
At 84% of new electricity capacity added worldwide, renewables are no longer a sidebar but the default build choice, while onshore wind power costs cluster around $0.03–$0.06 per kWh in the IRENA dataset. The page connects that build momentum to impacts you can feel, including millions of avoided health outcomes and a measurable pull on power sector CO2, with global renewable capacity now sitting around 5,600 GW.

Power Outage Statistics
8.1% of Eversource customers faced outages lasting more than 1 hour, with the 2023 dataset averaging 61.2 minutes per customer, and the page connects that real-world clock to the specific drivers regulators and researchers keep pointing to, from extreme weather and wildfire ignition risk to lightning faults and automation limits. It also translates what matters for prevention into actionable reliability signals like restoration capacity, cybersecurity readiness, and the rule changes shaping reporting and mitigation priorities.
European Battery Industry Statistics
Europe’s battery workforce is scaling fast, now 150,000 jobs in 2023 with a push toward 800,000 by 2030, while recycling, decarbonisation, and supply chain safeguards tighten the rules of the game. See how EU targets and investments turn into hard capacity and cost shifts, from a 100 kg CO2 per kWh EV cap and 95% battery recyclability by 2030 to €200 million for skills and €100 billion in IPCEI backed value chain funding.

Offshore Industry Statistics
Offshore Industry is moving fast in 2024 and the buildout is no longer just drilling and wind farms but the grid, subsea systems, and downtime performance that make projects bankable. Spot how US OCS output hit 3.1 million barrels per day of oil-equivalent in 2024 and how UK grid queues topped 20 GW, alongside measures like predictive maintenance cutting unplanned downtime by 40 percent and offshore wind LCOE falling from about €85/MWh to about €75/MWh from 2020 to 2023.

Solar Power Statistics
Global solar economics have flipped hard in recent years, with weighted average fixed axis LCOE falling to $0.044/kWh in 2023 and module prices dropping 42% to $0.11/Wp in Q4. Pair that price shock with record deployment scale and it becomes clear why solar is now competing on parity while the supply chain, efficiency, and emissions benefits are accelerating in real numbers.

Subsea Industry Statistics
See how a $5.3 billion global subsea services market is set to climb to $8.3 billion by 2030 while subsea cable and robotics revenue race in parallel, backed by 95 percent of international data carried by submarine cables and a telecom benchmark targeting 99.99 percent availability. You will also find the practical tension behind the big investment push, from LNG capacity added in 2023 to deepwater scale and outage driven by installation and integrity work, plus what performance targets like low leak rates and predictive maintenance actually translate to.
Solar Power Industry Statistics
Global solar PV additions jumped 25.9% year over year to 2023 levels, and PV is now responsible for 64% of new renewable capacity additions, with cumulative capacity reaching 387.8 GW worldwide. The page also maps who is scaling fastest, how quickly module prices fell from about $1.00 per watt to $0.11 per watt, and why capacity factors around the high teens to low twenties are the quiet constraint behind performance.