GITNUX MARKETDATA
Browse Our Category
Environment Energy
Latest update:

Gas Prices Statistics
See how gas prices moved in 2025 and what that shift says about where costs are headed next, with the key numbers laid out so you can spot the real trend instead of the noise. If you have been tracking trends by feel, these statistics will challenge that guess quickly.
Korea Energy Industry Statistics
Korea’s energy industry is shifting fast, and the latest figures show how investment, demand, and generation are moving in different directions rather than simply rising together. See the most current 2025 and 2026 snapshot of what is changing across power supply and energy use, and what that means for policy and markets.

Water Consumption Statistics
Global per capita water withdrawal sits around 1,400 m3 per year, yet demand is still projected to surge by 40 percent by 2030 and by 5.3 billion people living in water stressed areas by 2050, so the real question is what will cut use fastest and what will fail first. From irrigation and NRW losses to wastewater reuse and smart metering, the page connects where water goes with the fixes that can realistically reduce withdrawals.
Us Solar Industry Statistics
Get the latest Us Solar Industry statistics showing how quickly the market has tightened, from new installation momentum to shifting costs. You will see the contrast between what was promised and what actually happened, with 2026 and 2025 figures that make the direction clear.
Solar Energy Statistics
See how solar is shifting the grid and the bill at the same time with up to date 2026 figures that highlight growing capacity alongside real cost pressure. You will compare the latest deployment trends, generation mix, and job and investment signals to understand what is changing fastest and why it matters.
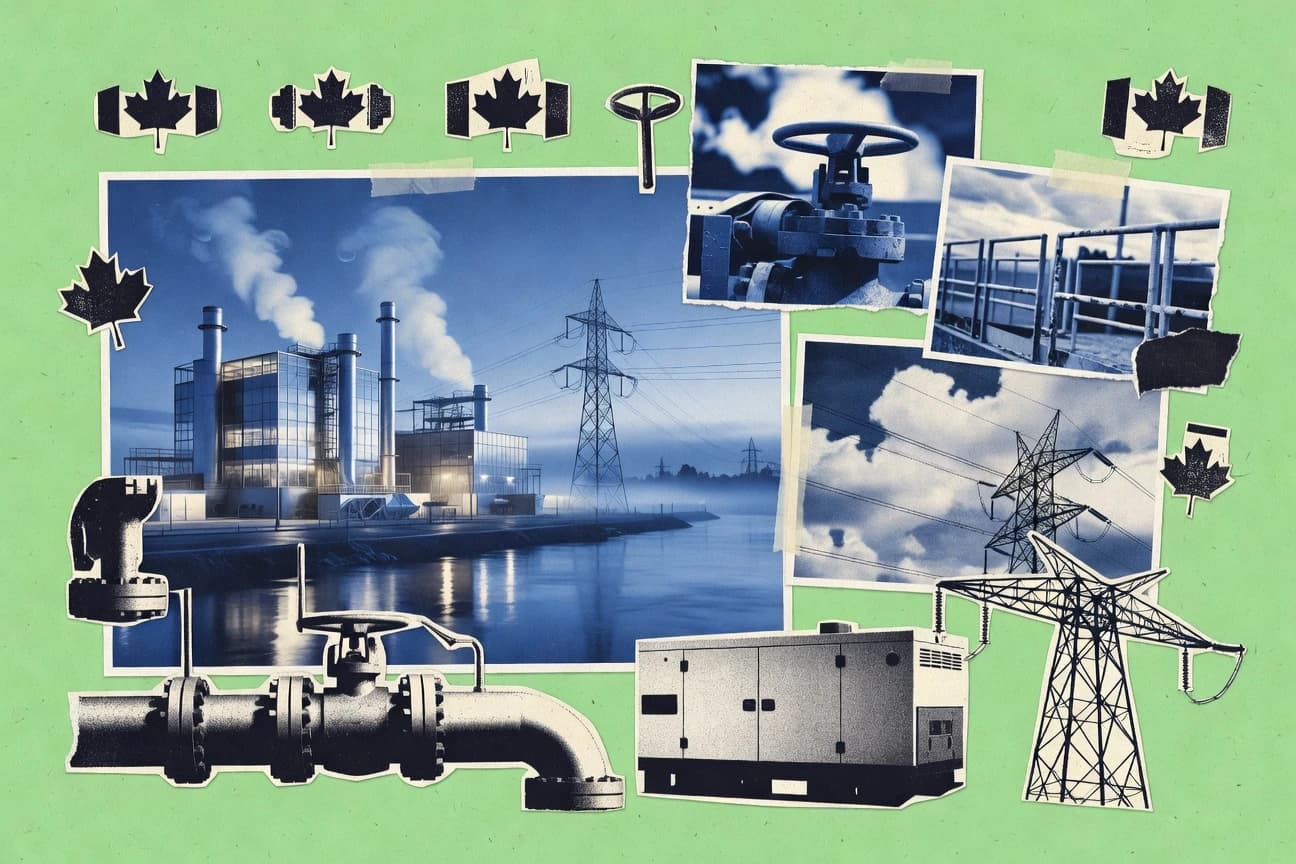
Canada Energy Industry Statistics
Canada’s energy industry totals have shifted in 2026, with production and utility generation figures pointing to how quickly supply realities are changing. Get the key statistics side by side to understand what that momentum means for fuels, power and the cost pressures Canadians feel every day.
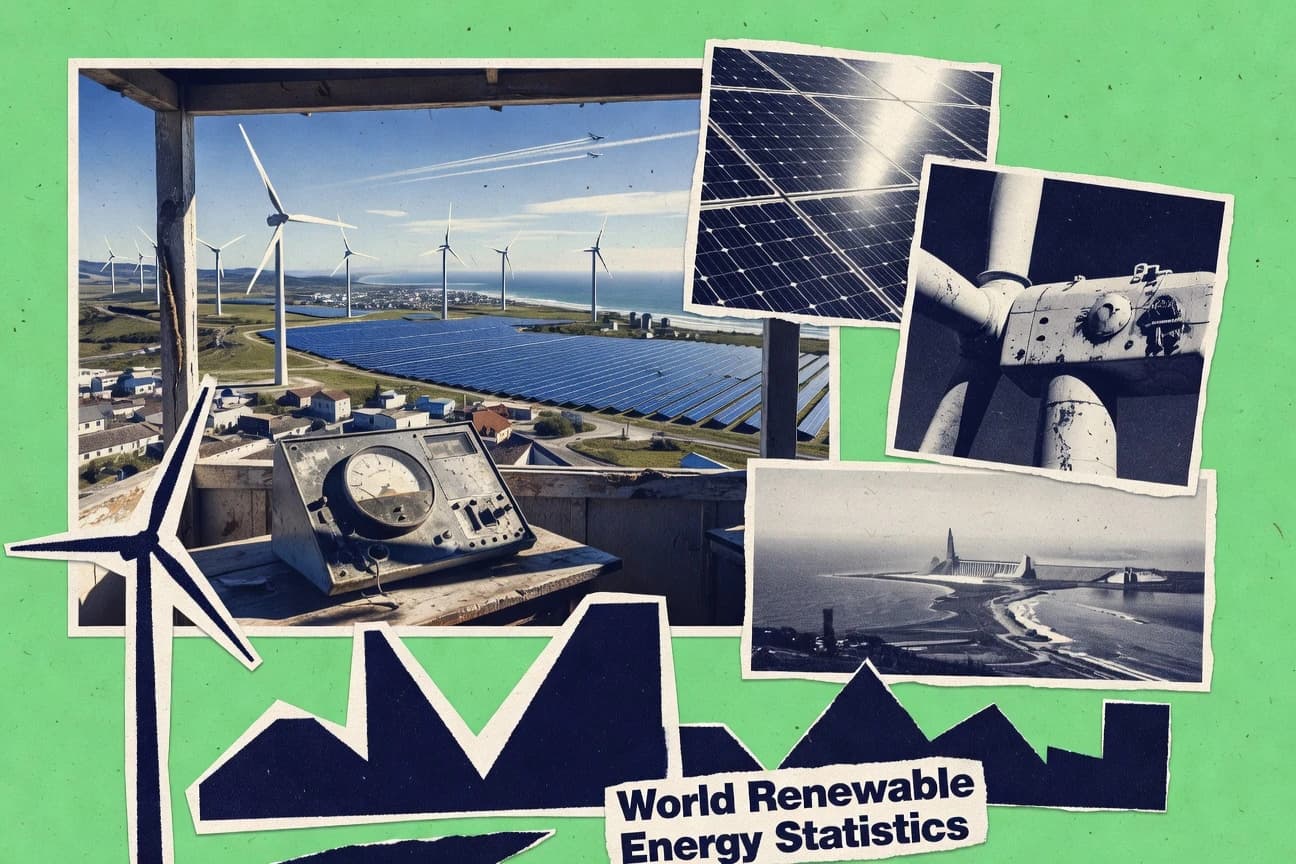
World Renewable Energy Statistics
With renewables delivering 30% of global electricity generation in 2023, this page connects the scale of growth to the real bottlenecks that come with it, from 2,807 TWh of renewable power to shrinking wind and grid costs like wind LCOE falling to about $0.02–$0.05 per kWh in 2023 scenarios and lower curtailment in Europe. It also tracks where capacity is piling up and what it means for flexibility, including 510 GW of solar PV additions, 116 GW of wind additions, and the investment momentum behind $473 billion spent in 2022 and $1.2 trillion cumulative from 2017 to 2023.

Geothermal Energy Statistics
A quick look at geothermal energy stats shows how quickly the picture is changing, with new 2025 and 2026 figures pointing to real momentum in capacity and generation. If you thought geothermal was a slow burn, these numbers challenge that assumption and make the case for where growth is actually happening next.
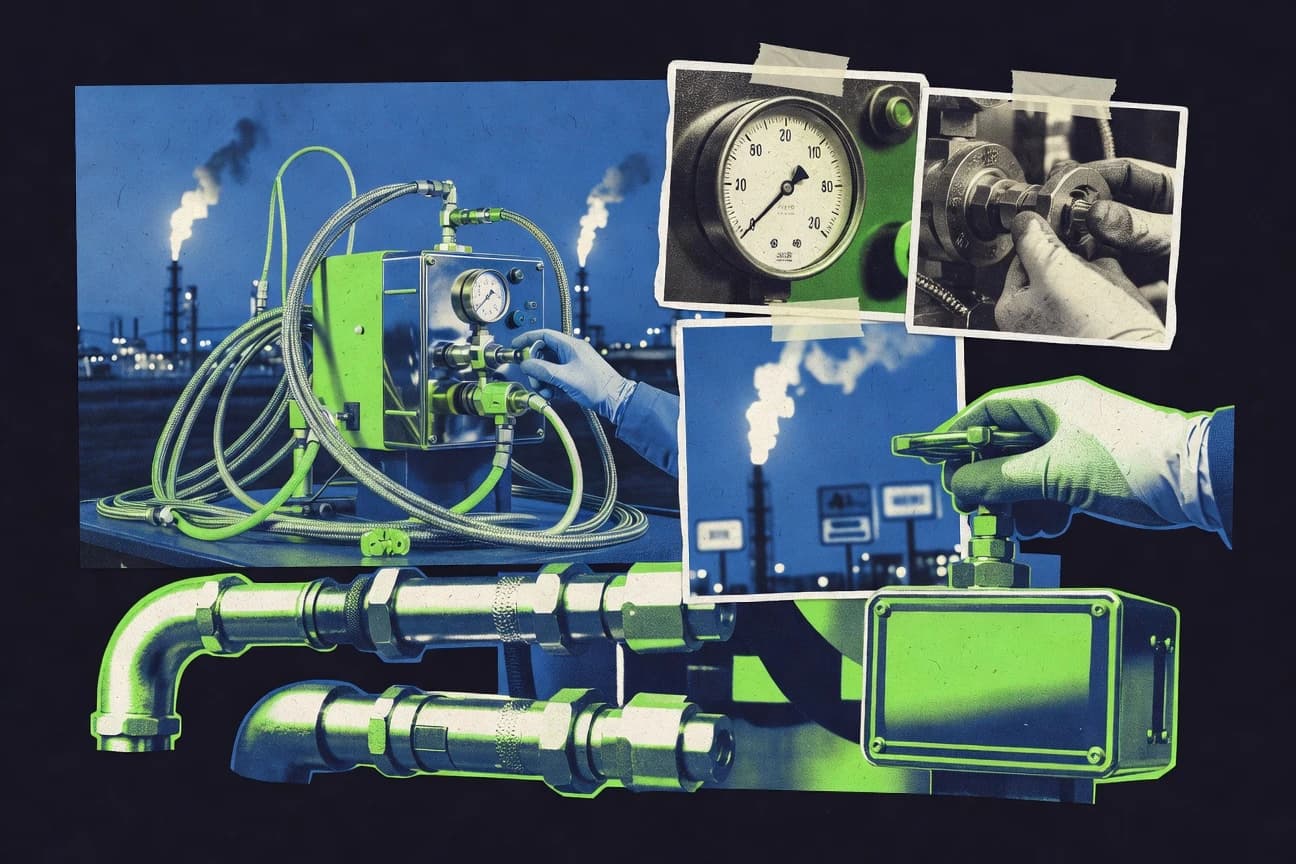
Oil Gas Technology Services Industry Statistics
With $2.0 trillion in projected 2025 upstream capex and $310.4 billion in production equipment demand, the Oil and Gas Technology Services market is clearly being pulled toward technology that cuts time, boosts recovery, and hardens operations against cyber risk. This page connects field services spending like $22.3 billion for well completion and $13.4 billion for reservoir stimulation to concrete performance targets such as 20 to 40 percent less NPT and 46 percent of firms reporting a material cybersecurity incident, revealing where investment is heading and why.
Eu Green Deal Industry Statistics
Get a sharp snapshot of how EU Green Deal industry is performing right now, with 2026 figures that reveal where momentum is building and where it’s slipping. Expect the kind of contrasts that matter for policy and investment decisions, not just headline totals.
Louisiana Energy Industry Statistics
See how Louisiana’s energy numbers are shifting in 2026 as production, investment, and electricity trends pull against one another. Use the latest figures on the state’s industry to spot what is accelerating and what is slowing before the next quarter changes the picture.

Decarbonization Industry Statistics
New 2025 and 2026 figures reveal where decarbonization is actually accelerating and where it is quietly stalling, from emissions cuts to the capacity and investment shifts shaping the next investment cycle. The contrast is sharp enough to change decisions fast for anyone tracking compliance risk, project viability, and industrial competitiveness.
Dumpster Industry Statistics
With the global waste collection and treatment services market projected to hit $1.31T by 2030 and the roll off dumpster market rising from $2.0B in 2023 to $3.4B by 2030, the demand surge is clear. But the real tension is how recovery rates, landfill methane, and faster digital tracking are reshaping costs and service expectations, including a 20 to 30% boost in landfill diversion measurement accuracy from weigh scale data and automated reporting.
Fossil Fuels Statistics
See how fossil fuels are faring right now, from 2026 electricity generation shares to the latest year’s emissions and demand pressures that are reshaping policy and prices. You will find the sharpest contrasts between what power plants burn and what the numbers say is actually changing.
Nuclear Energy Statistics
With nuclear generation up to 2026 levels, this page puts hard numbers behind why energy planners are reconsidering baseload power rather than treating it as a legacy technology. You will see the sharp contrast between nuclear’s measured output and the volatility elsewhere, plus the current statistics that explain what that tradeoff means for reliability and emissions.

Hydropower Statistics
Hydropower capacity is reshaping fast, and the latest figures make the shift obvious rather than gradual. See how generation, investments, and performance vary across regions to understand where today’s clean power momentum is actually coming from.

Dumpster Rental Industry Statistics
See how dumpster rental demand is shifting in 2025, with key pricing and volume signals that separate busiest weeks from slowdowns. You will learn which numbers are driving customers to book larger roll off sizes sooner and where waste management costs are tightening.
Midstream Downstream Oil Gas Industry Statistics
See how 2025 midstream and downstream Oil and Gas indicators are shifting, with production, logistics, pricing, and refining performance revealing a tighter margin story than the headline figures suggest. This page puts the latest 2025 contrasts side by side so you can quickly spot where volumes, throughput, and market value are moving out of sync.

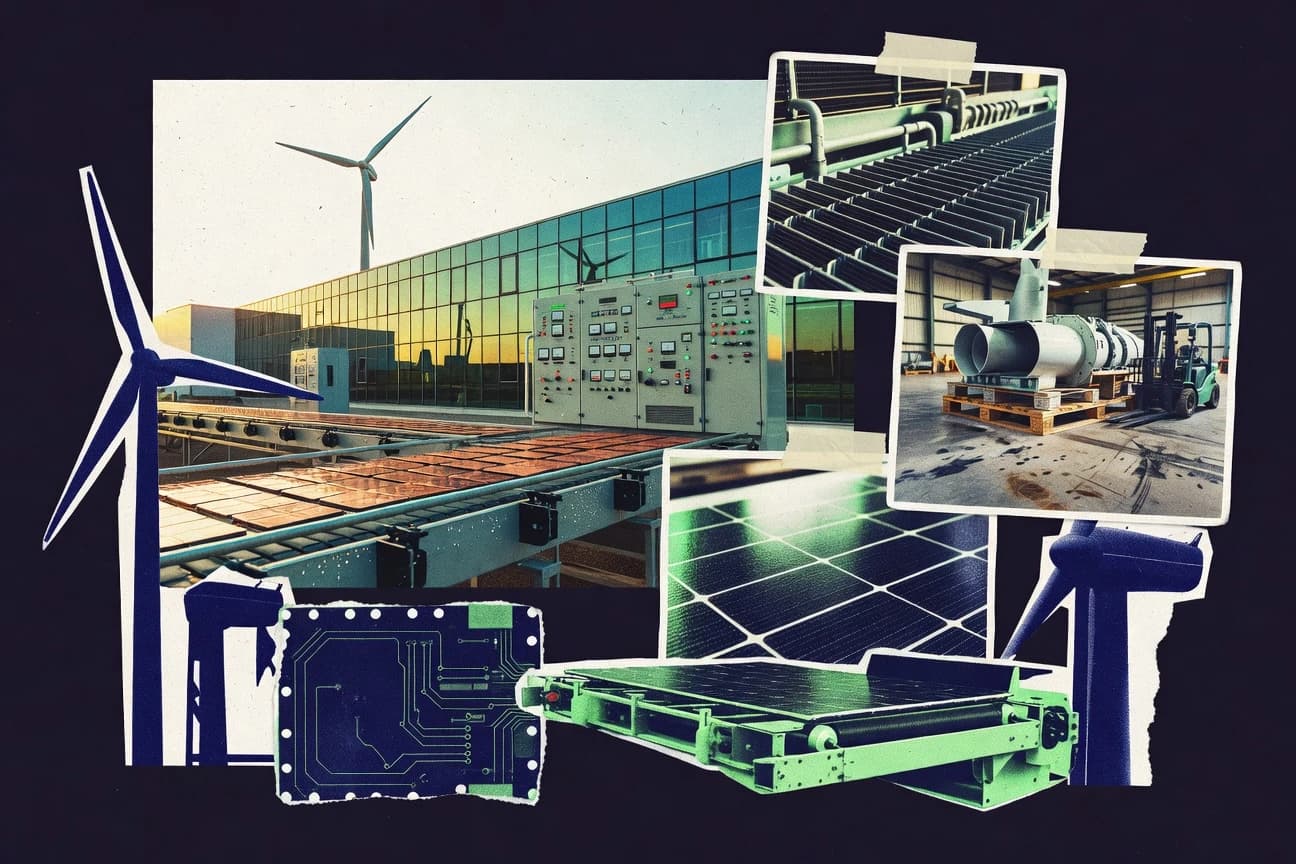
Korea Battery Industry Statistics
Korea’s battery industry is moving fast enough that the newest 2026 figures reveal a shift in where value is being created, with production and market momentum no longer matching the older expectations. Get the key Korea focused stats side by side so you can see what changed and why it matters for the next investment and supply decisions.
Canada Oil Industry Statistics
See how Canadian oil industry activity and outlook are shifting with the latest 2025 production and investment figures, and what those moves mean for jobs, revenue, and greenhouse gas pressures. The most telling contrast is how spending and output can rise even as emissions and market uncertainty tighten their grip.