GITNUX MARKETDATA
Browse Our Category
Environment Energy
Latest update:


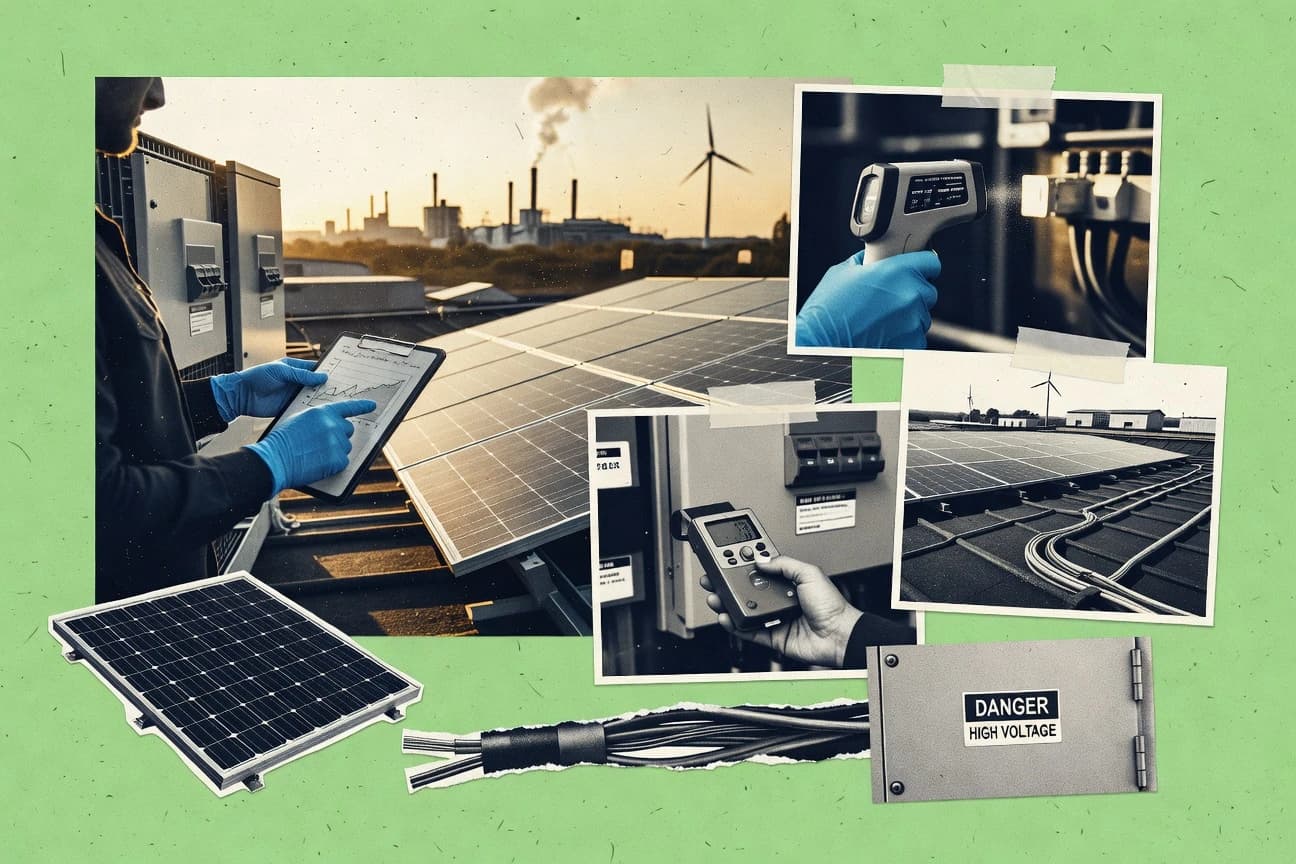
Solar Inverter Industry Statistics
Solar inverter demand is already reshaping fast, with global shipments reaching 536 GWac in 2023 and efficiency standards pushing toward 99.5% by 2028. Track how utility scale is set to command 55% by 2030 while storage integrated, microinverters, and grid forming requirements force vendors to consolidate around smarter, lower cost designs.

Ehs Industry Statistics
From 1.2 million certified global EHS professionals to 22,500 OSHA citations in FY2022, this page puts enforcement, certification, and workplace risk side by side so you can see where compliance is getting tighter and where it is still slipping. You will also find pressure points across the supply chain, from EU REACH registrations of 23,000+ substances and 90% RoHS electronics compliance to global workplace fatalities and injuries that keep landing on the same repeat offenders.

Carbon Accounting Industry Statistics
Scope 3 data gaps stall 70% of carbon calculations, yet 60% of tools now support CSRD compliant automated reporting and regulatory pressure is expected to double carbon accounting investments by 2026. If you want the practical why and the cost of getting there, this page connects barriers like interoperability and skills shortages with market momentum that is driving the carbon accounting software boom.

Pipeline Leak Statistics
PHMSA logged 312 total pipeline failures nationwide in 2023, and the costs climb fast beyond the visible headlines with an estimated $5B+ in annual damages from US pipeline incidents during 2020–2022. Pipeline Leak puts those figures beside stark field impacts such as Enbridge Line 3 reroute risks and the Marshall, MI cleanup bill of $1.2 billion over 12 years, so you can see how “leak statistics” turn into long lived harm.
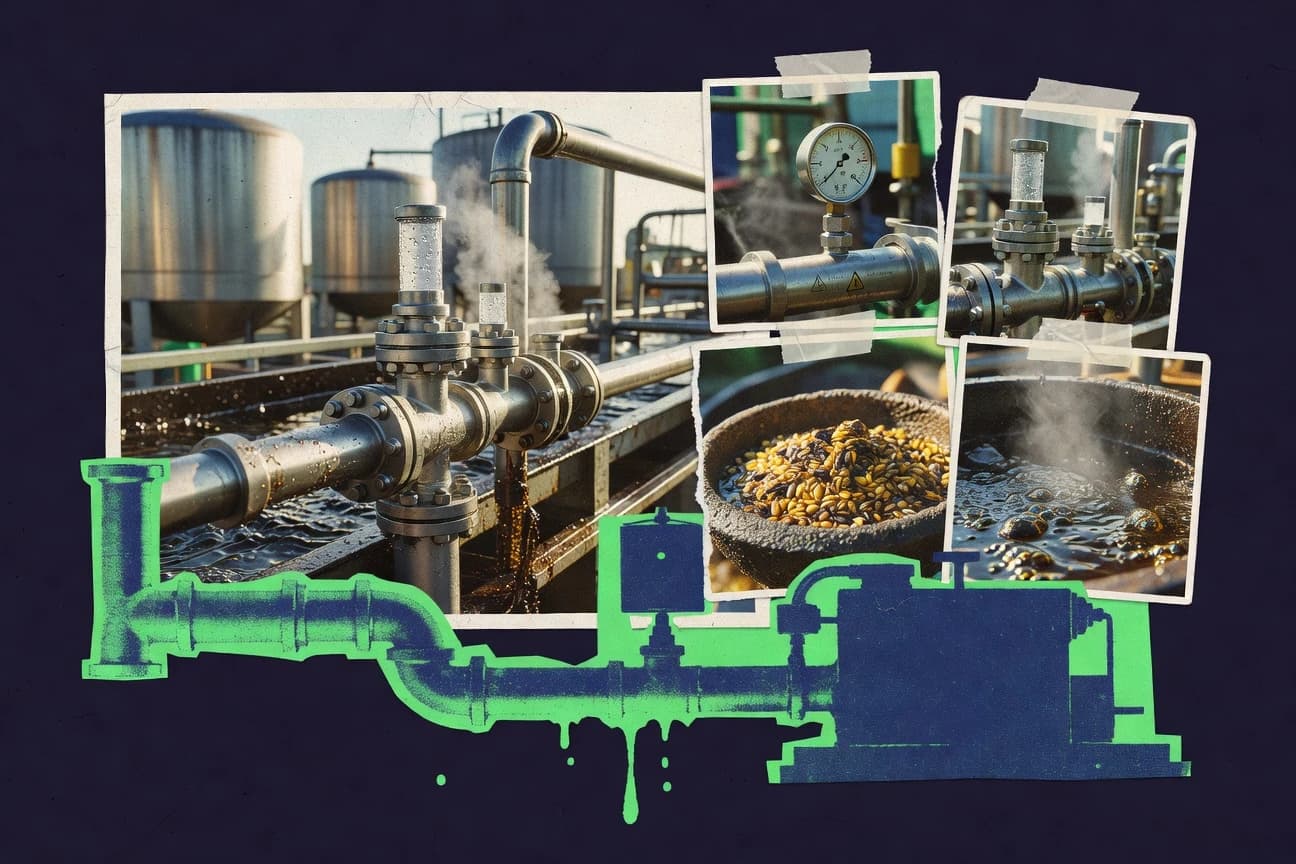
Biofuel Production Statistics
Global biofuel production reached 174 billion liters in 2022 while the market value hit $140 billion and investment rose to $12 billion, showing how fast capital is arriving even as feedstock costs make up 70% of total expenses. You can also compare ethanol at $0.75 per liter and biodiesel at $1.20 per liter against the policy push that covers 90% of global blending and targets 14% renewables in transport by 2030.

Electricity Prices Industry Statistics
Commercial electricity pricing moved from 12.89 cents per kWh in Q4 2023 to 12.95 cents per kWh in Q1 2024, with natural gas still driving roughly 60% of U.S. wholesale price swings. Follow how the regional spread runs from Texas at 9.87 cents per kWh to California at 20.15 cents per kWh, while EU and Asia compare with different pressure points and policy effects.

Lng Industry Statistics
Global LNG demand is running at 404 mt, yet Europe has pulled ahead with a record 120 mt imports while prices wobble as supply overshoots expected by 20 mt in 2024. Track how Asia owns 75% of LNG demand growth, what that means for hubs and shipping costs, and where the next wave of regasification and methane reduction targets is likely to land by 2030.
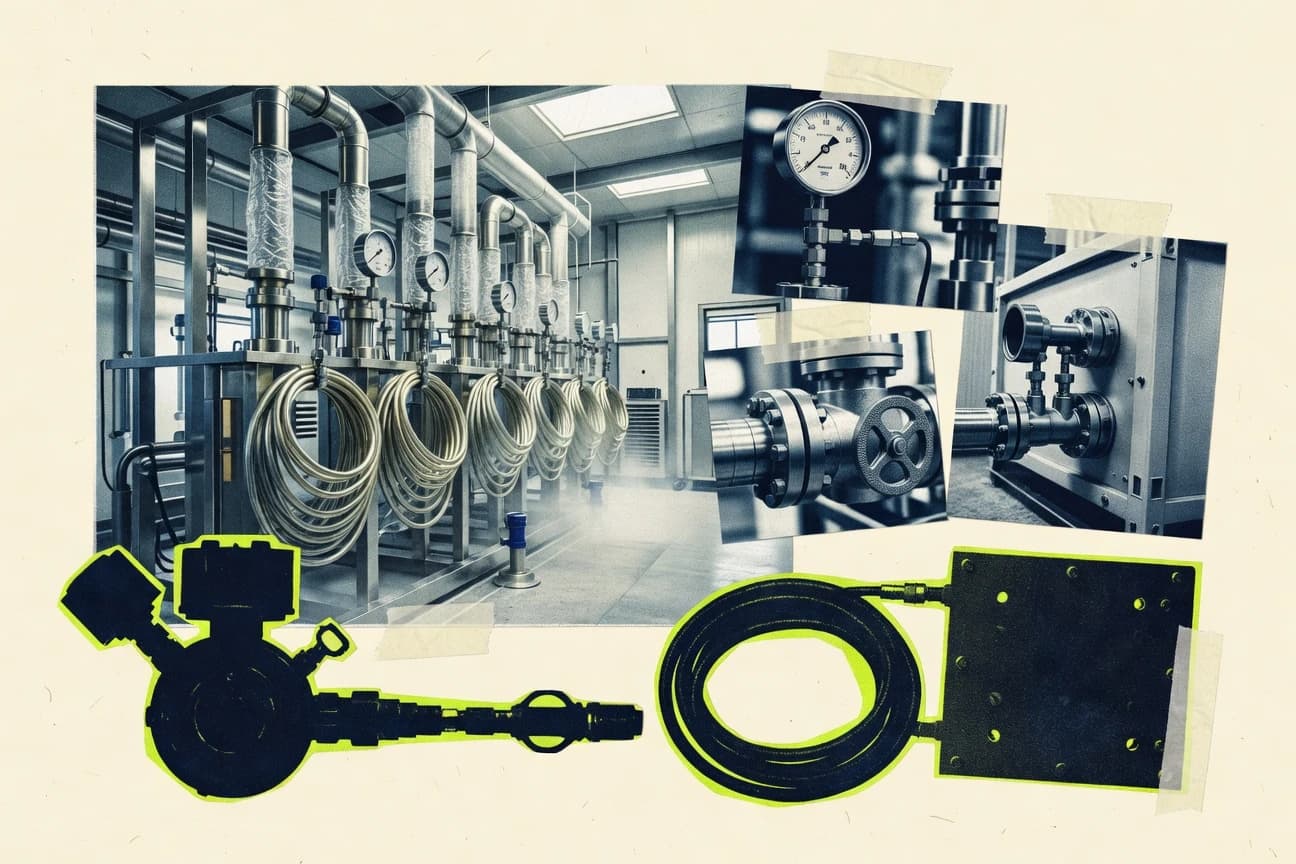
Hydrogen Industry Statistics
Hydrogen Industry charts where the pressure points really are for scale and cost, from steel that could take 15 to 20 Mt of hydrogen by 2050 to shipping and aviation where the climate upside comes with new fuel pathways. It also quantifies how fast the market is moving, with 2022 electrolyzer revenue hitting $1.2 billion, investments reaching $25 billion, and a projected jump to $317.39 billion by 2030, all while low emission options compete against still dominant grey production.

Water Scarcity Statistics
By 2050, water scarcity could displace 1.8 billion people as demand climbs 20 to 30 percent while climate change cuts Mediterranean precipitation by 20 to 30 percent by 2050. This page connects the pressure points from leaky cities and wasted irrigation to groundwater overpumping and pollution, then weighs what fixes like precision farming and water reuse can realistically deliver.

Germany Energy Prices Industry Statistics
Germany’s industrial electricity bill is still swinging hard even after the most chaotic years, with large consumers dropping to 16.7 ct per kWh in H1 2024 while the industrial price index climbed 47.6 percent year on year to 142.3 in January 2023. On one page, you can compare sector winners and pressure points, from steel power at about 250 €/MWh to chemical procurement costs of 14.8 ct per kWh in 2022, plus the gas and fuel side that keeps pushing manufacturers’ total energy cost share around 4.2 percent of value added.
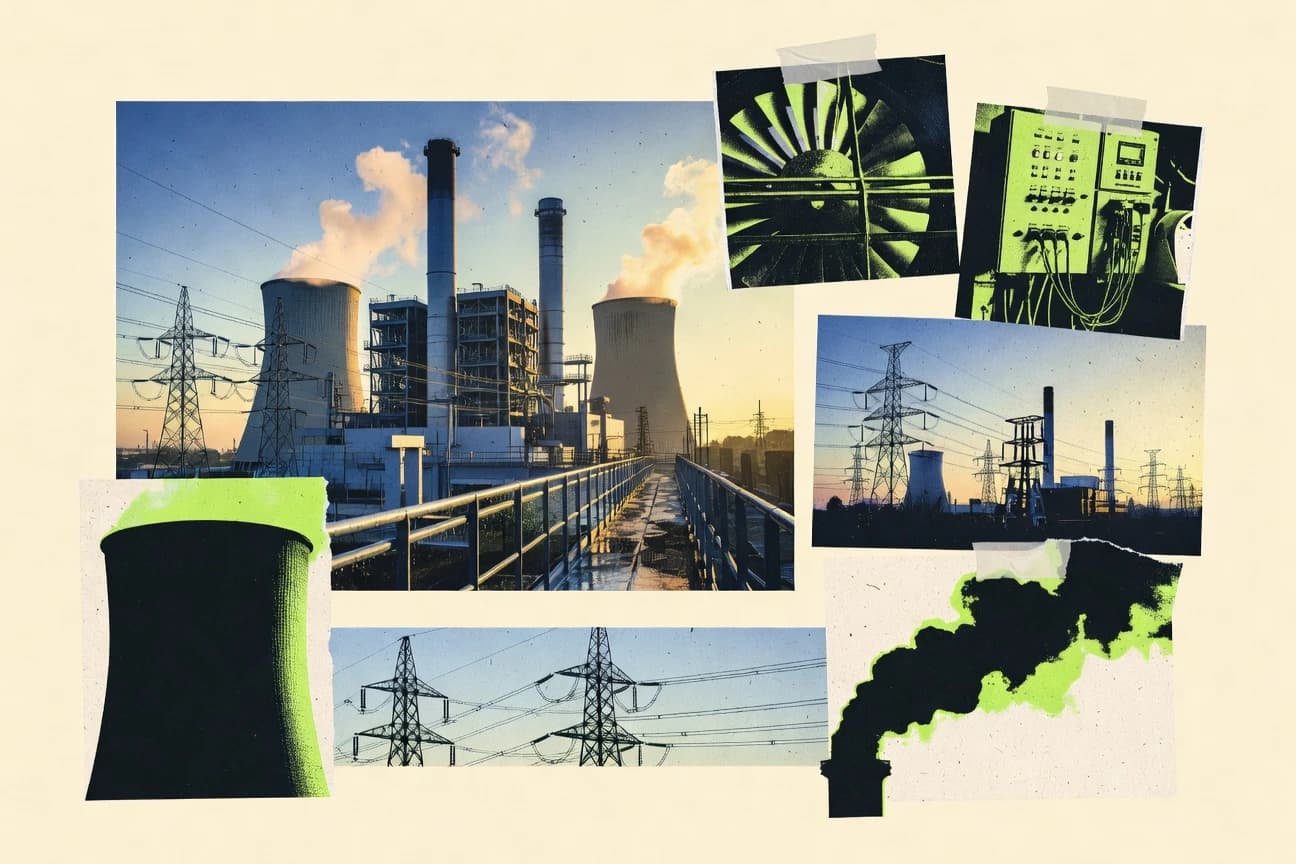
Power Generation Industry Statistics
Global electricity generation reached 28,471 TWh in 2022, up 2.5%, while renewables surged with 3,372 GW of installed capacity worldwide and solar PV alone adding 269 GW. Coal still powered 35% of the global mix and China’s 1,140 GW fleet remained over 50% of the national total, setting up the central tension of today’s power transition alongside investment and emissions moves.

Rain Statistics
Rain totals that look survivable on a forecast can turn catastrophic in hours, from 254 mm in 24 hours during the Dubai floods to 2000 mm plus wet season deluges that reshape whole regions. This page ties those extremes to the bigger pattern too, showing that rain is rising globally and rain triggered losses and hazards are escalating with it.

Rainfall Statistics
See how global rain runs at 990 mm a year with 78% falling as rain, yet oceans get about 2.7 m compared with just 0.78 m over land, from Sahara averages under 25 mm to Mawsynram’s extreme 11,871 mm annually and Zhengzhou’s 201.9 mm in one hour record storm impact. Track how patterns are shifting too, with global mean precipitation projected to rise 1 to 3% by 2100 while extreme rainfall intensity climbs about 7% per 1°C and regional monsoons grow more volatile.

Uk Energy Prices Industry Statistics
Commercial electricity rates swing from a Cornwall Insight forecast of 38p per kWh in Q2 2024 to 65p per kWh on deemed SME contracts, while half hour settled sites carry a 10 percent premium and renewable PPA power averages just 25p per kWh in 2023. If you manage costs or negotiate renewals, this page brings together regional and contract type pressure points, including broker fees of 5 to 7 percent and demand side response savings of 15 percent, so you can see exactly what is driving bills higher and where price leverage still exists.
Energy Consulting Industry Statistics
Energy consulting is expanding fast and shifting its skills, from 450,000 professionals worldwide in 2023 with 5.2% YoY growth to 65% of firms reporting renewables expertise shortages and 31% of consultants upskilling in AI and ML for energy forecasting. Follow the money and manpower across regions where remote work now reaches 42% of consultants and digital revenue leaders sit beside major talent churn, with global market momentum projected to lift from USD 12.5 billion in 2022 to a 7.2% CAGR through 2030.

Venezuela Oil Industry Statistics
Venezuela’s oil system is wobbling between staggering supply potential and severe operational collapse, with refinery utilization averaging just 10% from 2017 to 2022 and power outages wiping out about 30% production losses in 2019, alongside 80% of wells needing workovers overdue by 5 years. Even more stark, hyperinflation adjusted capex was cut 95% from $15B to $700M between 2014 and 2020 while sanctions and logistics strain help push oil to 921,000 bpd in December 2023, reshaping everything from debt and corruption to exports and reserve reality.

Diesel Generator Industry Statistics
Commercial diesel generator demand is being pulled in two directions at once, with data centers taking 25% of global commercial generator use in 2023 while global market revenue climbed 11% YoY to USD 16.8 billion in 2023. This page puts those sector pressures alongside emissions and market share metrics so you can see where reliability, regulation, and competition are reshaping the industry fastest.
Solar Statistics
Solar is now scaling at a pace that turns capacity headlines into cost and climate outcomes, with global solar capacity forecast to triple to 4.7 TW by 2030 and investment reaching $500 billion in 2023. At the same time, rooftop and off grid growth run in parallel from Australia’s 1 in 3 homes to more than 1 billion people relying on off grid solar, so you can see how affordability, policy, and hardware efficiencies are reshaping adoption worldwide.

Eu Ets Industry Statistics
Get the latest EU ETS price and market signals through a single dashboard, from Dec 2024 futures at €105.50 reached on 15 Dec 2023 to the Dec 25 forecast for 2025 at €120 by BloombergNEF. It also tracks how volatility, auction mechanics, compliance outcomes, and sector allocation rules moved together as the price steadied above €80 in 2023 and tightened the incentives behind carbon leakage protection.

Lake Superior Statistics
Lake Superior holds about 82,103 km² of surface area and an estimated 10,000 species of aquatic life, yet its food webs swing from summer phytoplankton peaks of 2 to 5 mg/m³ to deepwater sculpin dominance below 150 m. This page pairs ecosystem recovery and invasion pressure in fresh terms, from diporeia amphipod declines of 90% since the 1980s and dreissenid mussels covering 20% of benthos deeper than 30 m by 2020 to sea lamprey control dropping parasitic phase to under 5% of historic levels, alongside lake trout restoration aiming for 2.45 million age 3 plus fish.