
Global energy related CO2 emissions reached 37.4 gigatonnes. Electricity demand in India grew 8 percent year over year even as passenger electric cars improved average efficiency by 5 percent. These figures point to the scale of current consumption patterns across transport, industry and power systems.
Key Takeaways
- In 2023, the average global efficiency (kWh/km) for passenger electric cars improved by 5% compared with 2022 models (IEA estimate in Global EV Outlook)
- In 2022, electric motors accounted for about 45% of total electricity consumption globally (IEA analysis)
- In 2022, industrial heat accounted for about 20% of global final energy consumption (IEA analysis)
- In 2023, global oil demand increased by 2.2% (IEA Global Energy Review)
- In 2022, district heating supplied about 10% of heat demand in Europe (IEA analysis)
- In 2022, data centers used about 1% of global electricity demand (IEA estimate)
- Hydropower produced 4,200 TWh of electricity in 2023.
- Small-scale solar contributed 10% of total solar generation worldwide in 2023.
- In 2023, coal-fired generation in the United States was 1,713 TWh (EIA).
- In 2023, electricity demand in India grew by 8% compared with 2022.
- In 2023, global electricity-related energy efficiency investment requirements were estimated at $500–$1,000 billion per year (IEA).
- In 2022, the global average rate of improvement in energy intensity was 1.2% per year (not sufficient to meet net zero pathways).
- In 2022, worldwide electricity intensity of GDP (electricity consumption per unit GDP) improved by 2.0% compared with 2021 (IEA energy efficiency indicators).
- In 2023, global natural gas consumption was about 4,000 billion cubic meters of gas equivalent (IEA/WEO 2023 historical series).
- In 2023, global energy-related CO2 emissions were 37.4 gigatonnes (GtCO2) according to Ember’s Global Carbon Budget dataset.
Despite efficiency gains, energy use keeps rising, so investment and cleaner power must scale fast.
Related reading
01 · Category
Generation Mix5 stats
01
Hydropower produced 4,200 TWh of electricity in 2023.
02
Small-scale solar contributed 10% of total solar generation worldwide in 2023.
03
In 2023, coal-fired generation in the United States was 1,713 TWh (EIA).
04
In 2023, the EU’s share of electricity generated from renewables reached 44% (Ember European Electricity Review 2024).
05
In 2023, U.S. renewable generation (wind+solar) provided about 18% of U.S. electricity (EIA).
Interpretation
Generation Mix Interpretation
The generation mix is clearly diversifying as hydropower contributed 4,200 TWh in 2023 while renewables expanded globally, with the EU reaching 44% renewable electricity and the United States supplying about 18% of its electricity from wind and solar.
02 · Category
Regional & Sectoral5 stats
01
In 2023, global final energy consumption in buildings in the EU-27 was 1,160 TWh (Eurostat, energy consumption in households and services).
02
In 2022, EU-27 final energy consumption in services was 215.6 TWh (Eurostat).
03
In 2022, the industrial sector accounted for 28% of EU final energy consumption (Eurostat).
04
In 2020, direct energy demand for buildings represented 29% of global final energy use (IPCC AR6 WGIII).
05
In 2023, U.S. commercial energy consumption was 5.6 quadrillion Btu (EIA, Annual Energy Review).
Interpretation
Regional & Sectoral Interpretation
Across regions and sectors, buildings and services remain central to energy demand with the EU-27 alone using 1,160 TWh in 2023 for buildings and 215.6 TWh for services in 2022, while industry still drives a large share at 28% of EU final energy consumption and buildings account for 29% of global final energy use in 2020.
03 · Category
Efficiency & Savings4 stats
01
In 2023, global electricity-related energy efficiency investment requirements were estimated at $500–$1,000 billion per year (IEA).
02
In 2022, the global average rate of improvement in energy intensity was 1.2% per year (not sufficient to meet net zero pathways).
03
In 2022, worldwide electricity intensity of GDP (electricity consumption per unit GDP) improved by 2.0% compared with 2021 (IEA energy efficiency indicators).
04
In 2022, U.S. energy intensity (total energy per dollar of GDP) was 0.080 thousand Btu per 2017 dollar (EIA).
Interpretation
Efficiency & Savings Interpretation
In the Efficiency and Savings space, progress is real but still too slow, since global energy intensity only improved by 1.2% per year in 2022 and electricity intensity of GDP rose just 2.0% over 2021 even as the world needed $500–$1,000 billion per year in efficiency investment.
More related reading
04 · Category
Fuel Use & Emissions4 stats
01
In 2023, global natural gas consumption was about 4,000 billion cubic meters of gas equivalent (IEA/WEO 2023 historical series).
02
In 2023, global energy-related CO2 emissions were 37.4 gigatonnes (GtCO2) according to Ember’s Global Carbon Budget dataset.
03
In 2023, global coal consumption was 7.9 billion tonnes (coal equivalents) (IEA coal market report).
04
In 2023, global oil consumption was 101.9 million barrels per day (OPEC monthly oil market report).
Interpretation
Fuel Use & Emissions Interpretation
In the Fuel Use & Emissions category, 2023 global consumption was still dominated by fossil fuels, with 4,000 billion cubic meters of natural gas equivalent, 7.9 billion tonnes of coal, and 101.9 million barrels per day of oil, all feeding into energy related CO2 emissions of 37.4 gigatonnes.
05 · Category
Market & Policy3 stats
01
In 2023, global heat pump sales reached about 17 million units (International Energy Agency Heat Pumps Tracking).
02
In 2023, global LED market shipments were about 13.5 billion units (Strategy Analytics).
03
In 2023, global grid investment needs were estimated at $1 trillion per year for reliable electricity transition (IEA, World Energy Investment).
Interpretation
Market & Policy Interpretation
In the Market and Policy landscape, accelerating clean energy markets are evident as 2023 delivered roughly 17 million heat pumps sold and 13.5 billion LED shipments alongside an estimated $1 trillion per year in grid investment needs to support a reliable electricity transition.
06 · Category
Industry Overview7 stats
01
In 2023, the average global efficiency (kWh/km) for passenger electric cars improved by 5% compared with 2022 models (IEA estimate in Global EV Outlook)
02
In 2022, electric motors accounted for about 45% of total electricity consumption globally (IEA analysis)
03
In 2022, industrial heat accounted for about 20% of global final energy consumption (IEA analysis)
04
In 2023, global oil demand increased by 2.2% (IEA Global Energy Review)
05
In 2022, district heating supplied about 10% of heat demand in Europe (IEA analysis)
06
In 2022, data centers used about 1% of global electricity demand (IEA estimate)
07
In 2023, electricity demand in India grew by 8% compared with 2022.
Interpretation
Industry Overview Interpretation
Across the industry-focused energy picture, efficiency gains and cleaner electrification are rising alongside continuing fossil demand, with passenger electric cars improving 5% in 2023 and electric motors using about 45% of global electricity in 2022 even as global oil demand grew 2.2% in 2023.
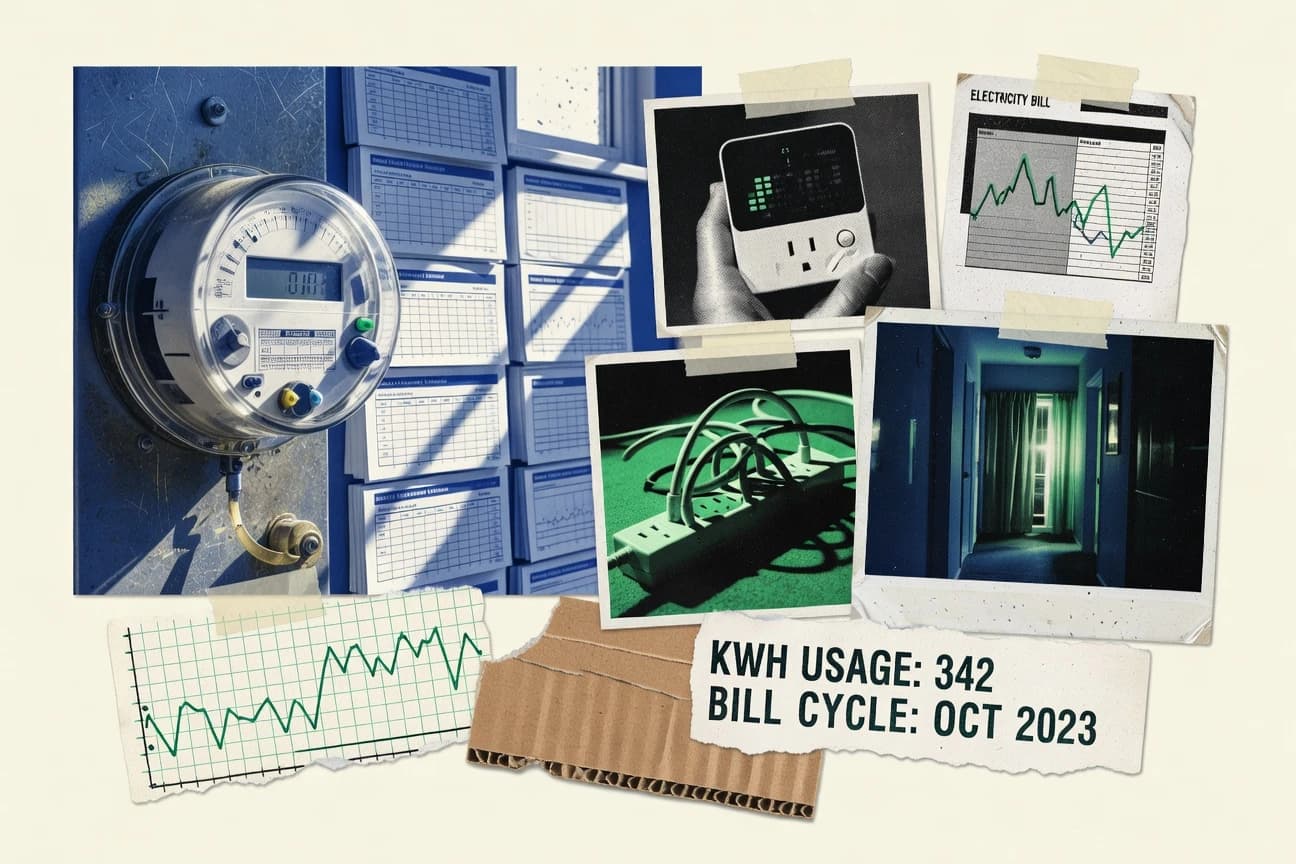
report visual · Key figures
Energy consumption signals: growth, efficiency, and emissions
Electricity demand is rising while energy-efficiency gains remain insufficient relative to net-zero needs, and energy-related emissions remain high.
8%
In 2023, electricity demand in India grew by 8% compared with 2022.
1.2%
In 2022, the global average rate of improvement in energy intensity was 1.2% per year (not sufficient to meet net zero p
2023
In 2023, global energy-related CO2 emissions were 37.4 gigatonnes (GtCO2) according to Ember’s Global Carbon Budget data
source-verifiedember-climate.org · iea.org2023
Reference
Cite This Report
This report is designed to be cited. We maintain stable URLs and versioned verification dates. Copy the format appropriate for your publication below.
APA
Catherine Wu. (2026, February 13). Energy Consumption Statistics. Gitnux. https://gitnux.org/energy-consumption-statistics
MLA
Catherine Wu. "Energy Consumption Statistics." Gitnux, 13 Feb 2026, https://gitnux.org/energy-consumption-statistics.
Chicago
Catherine Wu. 2026. "Energy Consumption Statistics." Gitnux. https://gitnux.org/energy-consumption-statistics.
Sources & references
28 datasets cited across this report · attribution is report-level
+21 additional datasets cited (not shown individually)