GITNUX MARKETDATA
Browse Our Category
Diversity Equity And Inclusion In Industry
Latest update:


Diversity Equity And Inclusion In The Culinary Industry Statistics
New figures expose a stubborn mismatch between who gets hired and who gets to lead in restaurant and food service roles, alongside pay and opportunity gaps that keep narrowing too slowly. Read the page to see exactly where progress is real in 2025 and where it stalls, with the kind of details DEI teams can actually use.

Diversity Equity And Inclusion In The Elearning Industry Statistics
Learn how DEI is actually measuring up inside eLearning with fresh 2025 benchmarks that reveal where inclusion is accelerating and where it still stalls. If your courses claim to be accessible and equitable, these statistics will show you what progress looks like in practice.
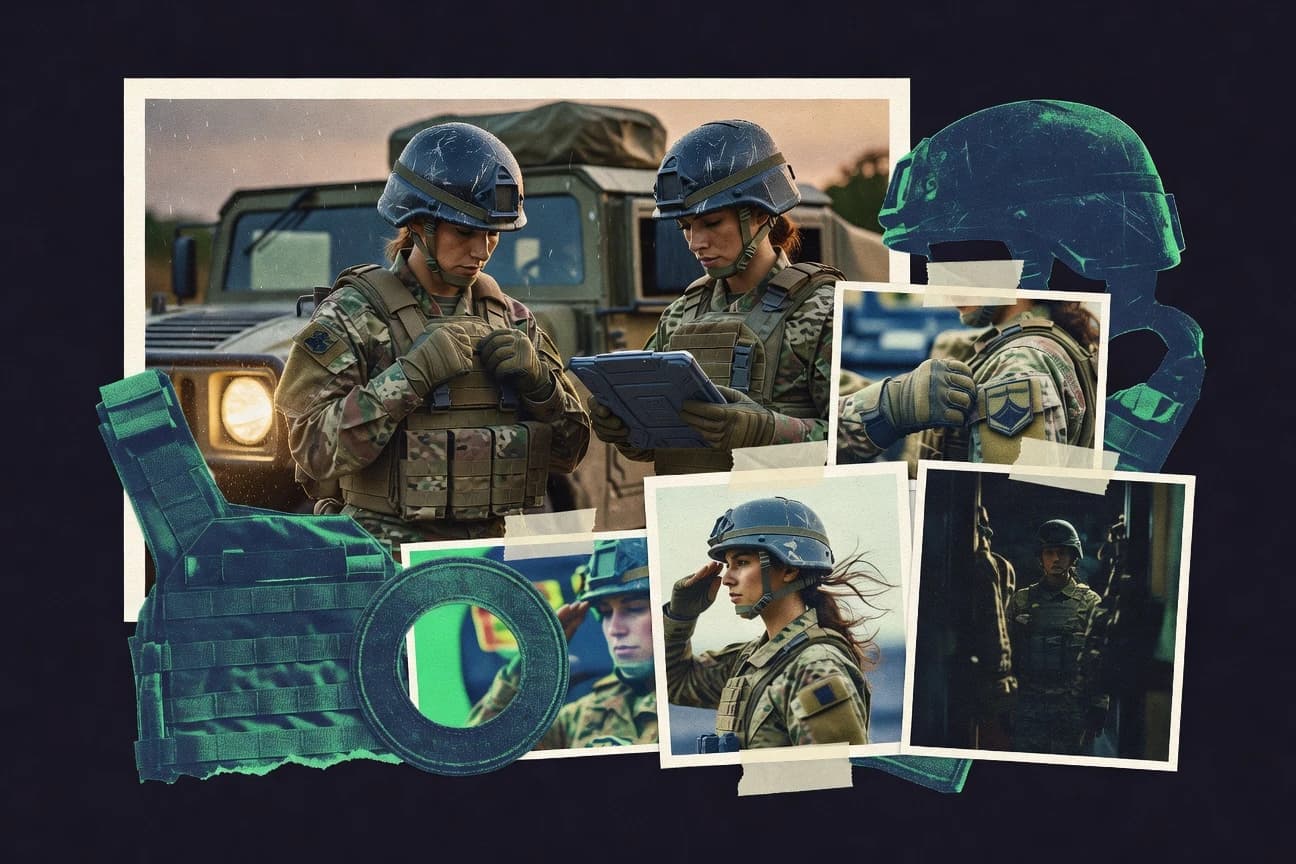
Women In The Military Statistics
See the sharp shifts behind women in uniform in 2025, where representation and roles do not move at the same pace. This page lays out the most current numbers side by side so you can spot what is improving, what is still stuck, and why that tension matters.
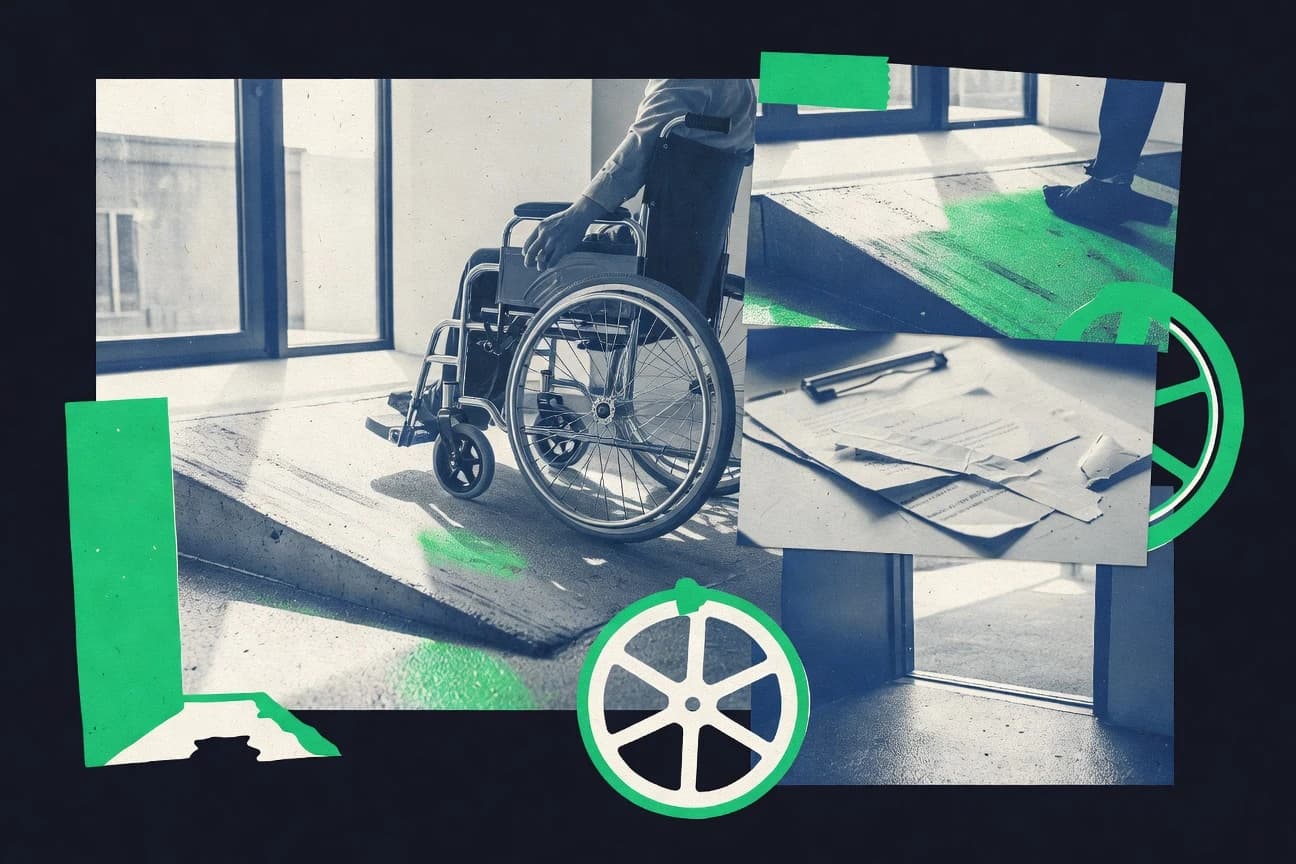
Disability Discrimination Statistics
With 2025 data showing persistent disability discrimination, the page looks closely at where people are blocked and what that means for everyday work and services. Read how the gap between reported barriers and formal outcomes is shifting, and why the newest figures matter more than the older headlines.
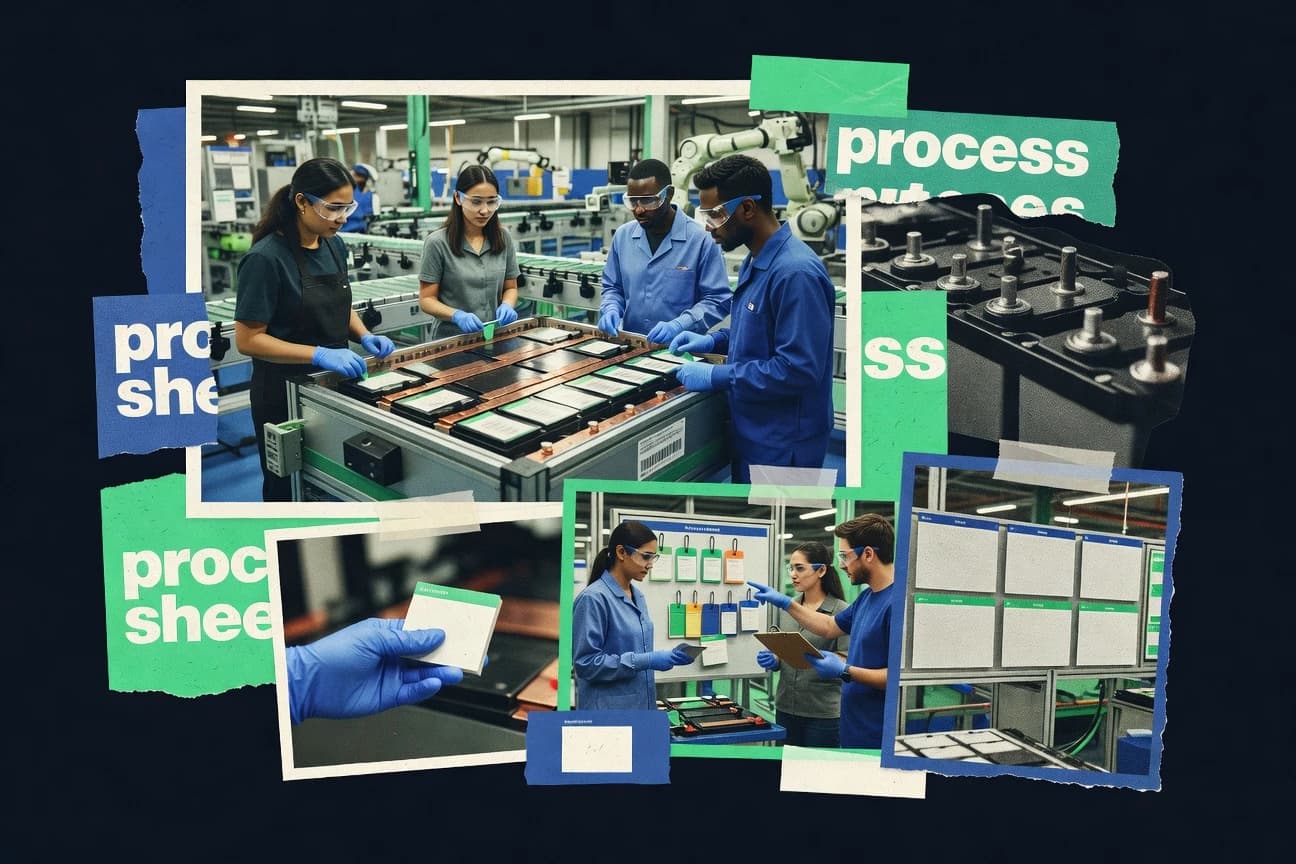
Diversity Equity And Inclusion In The Battery Industry Statistics
Battery manufacturing diversity is measured in more than hiring headlines, and the latest 2025 figures show where representation is tightening and where it is slipping across the talent pipeline. Read the DEI statistics to see the concrete gaps by role and leadership, plus what progress actually looks like when you track the metrics that matter.
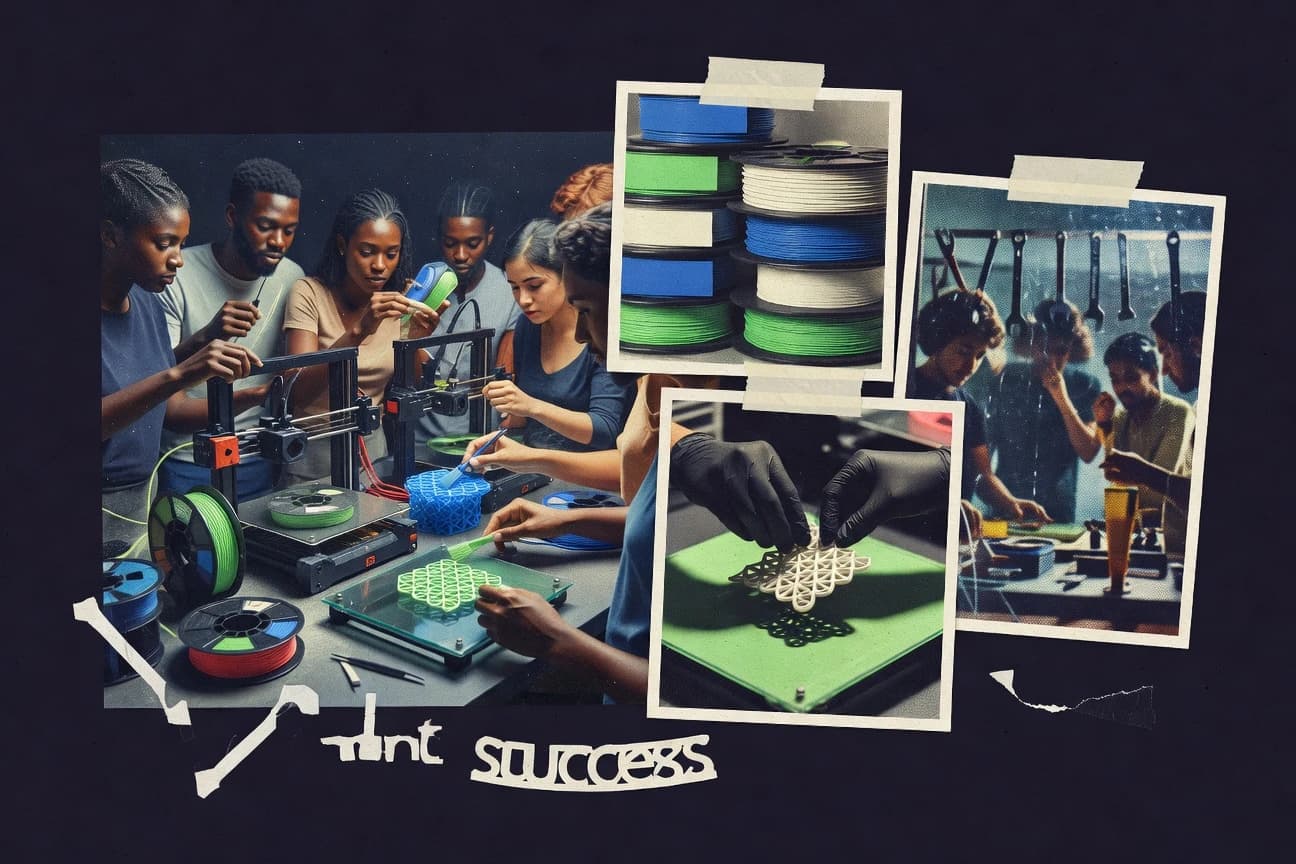
Diversity Equity And Inclusion In The 3D Printing Industry Statistics
Despite DEI efforts, women are still only 18.5% of the 3D printing workforce while URM candidates face 15% fewer callbacks, and mid career promotions lag with women 28% behind men. This page highlights what is working now, from audits that help close 42% of the pay equity gap to structured interviews adopted by 55% of firms, so you can see exactly which practices move outcomes in additive manufacturing.
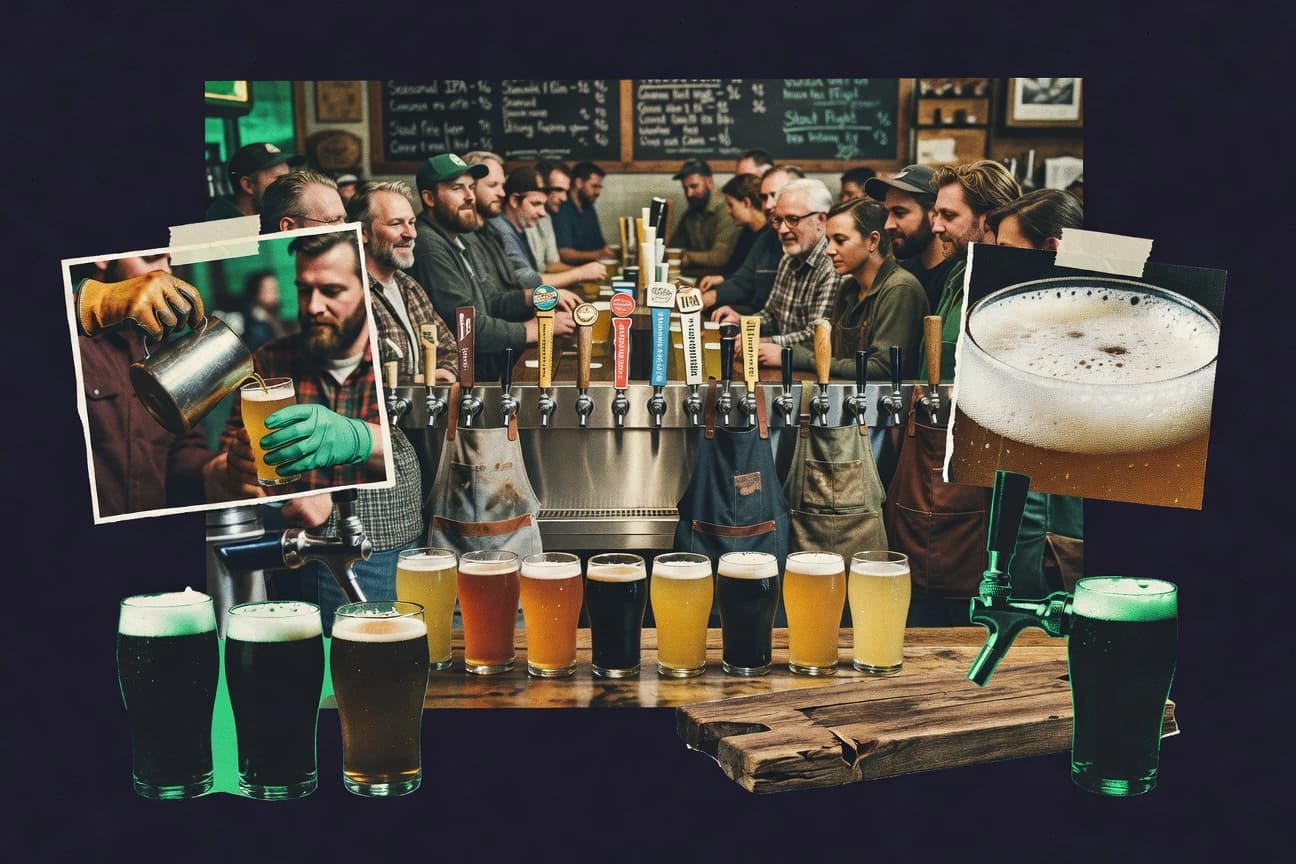
Diversity Equity And Inclusion In The Beer Industry Statistics
Beer diversity benchmarks are shifting, and the gap between representation on the bar and leadership behind the scenes is more measurable than you might expect. See the latest 2025 figures that track who holds power in brewing and where inclusion efforts are landing across the industry.
Diversity Equity And Inclusion In The Engineering Industry Statistics
A 2026 snapshot of hiring and advancement in engineering highlights where progress is real and where the pipeline still breaks, right before people would expect it. If you want to understand which DEI efforts move measurable outcomes and which stall out, these stats are the clearest place to see it.

Diversity In Workplace Statistics
A 2023 BLS snapshot shows 34.9% of the U.S. labor force is Black, Hispanic, or Asian while women hold just 18.6% of management, business, science, and arts roles and only 6.5% of computer and mathematical jobs go to Black workers. See how bias still echoes through hiring and promotions, yet DEI and inclusion policies are linked to better productivity, retention, and even higher callback rates when work is structured and names are not a proxy.

Diversity Equity And Inclusion In The Wealth Management Industry Statistics
Wealth management is still strikingly unequal even as 2025 data shows progress is uneven, with representation and advancement gaps persisting where decisions are made. These statistics force a clear look at who gains access and influence and who gets left waiting behind the wealth pipeline.
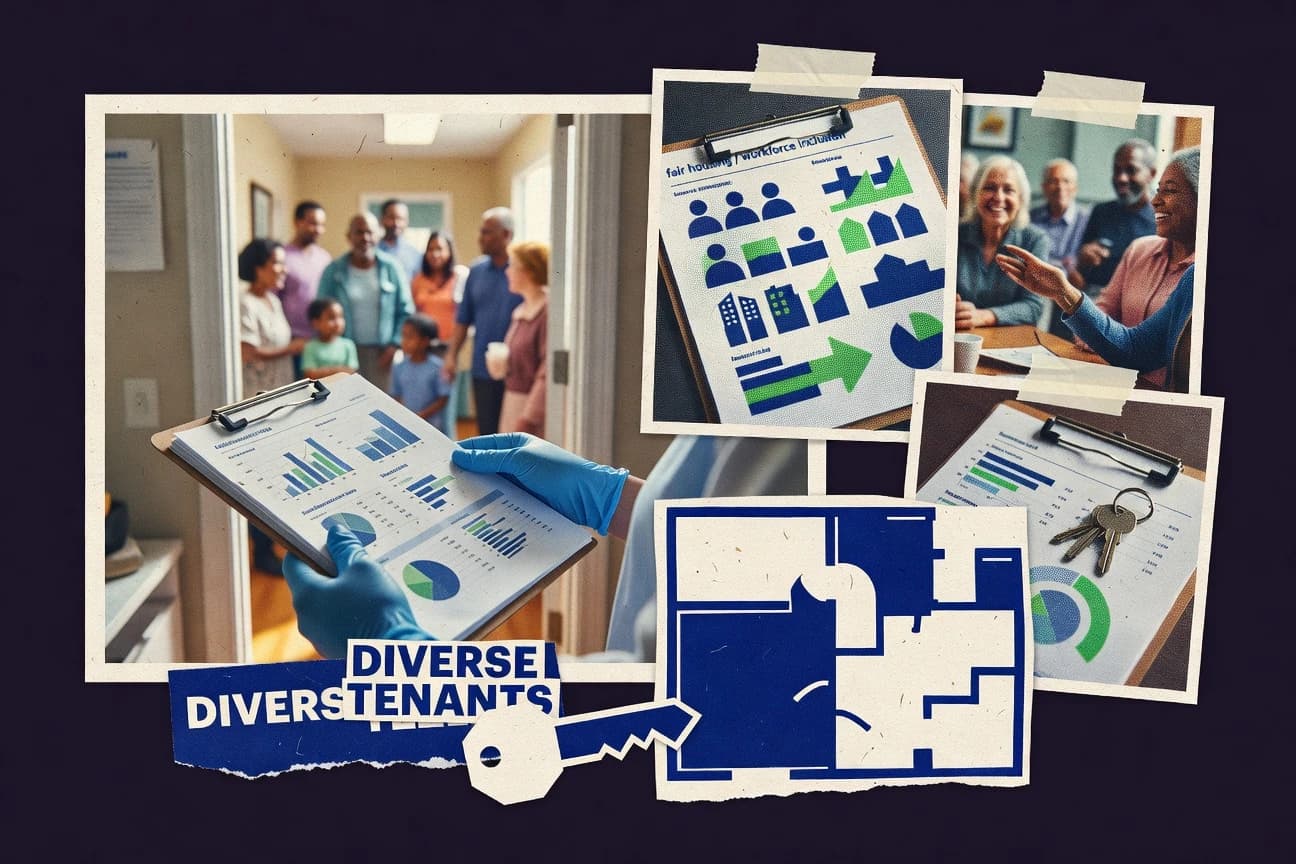
Diversity Equity And Inclusion In The Multifamily Industry Statistics
DEI in multifamily is no longer a side project since 84% of properties report having DEI policies or programs as of 2024, yet discrimination and accessibility gaps still shape who gets to feel truly at home. This page pairs that momentum with hard pressure points like 18.5% of renters reporting discrimination in the rental process and only 0.7% of apartment listings using explicit ADA accessibility features in marketing copy to show exactly where DEI efforts help and where they fall short.
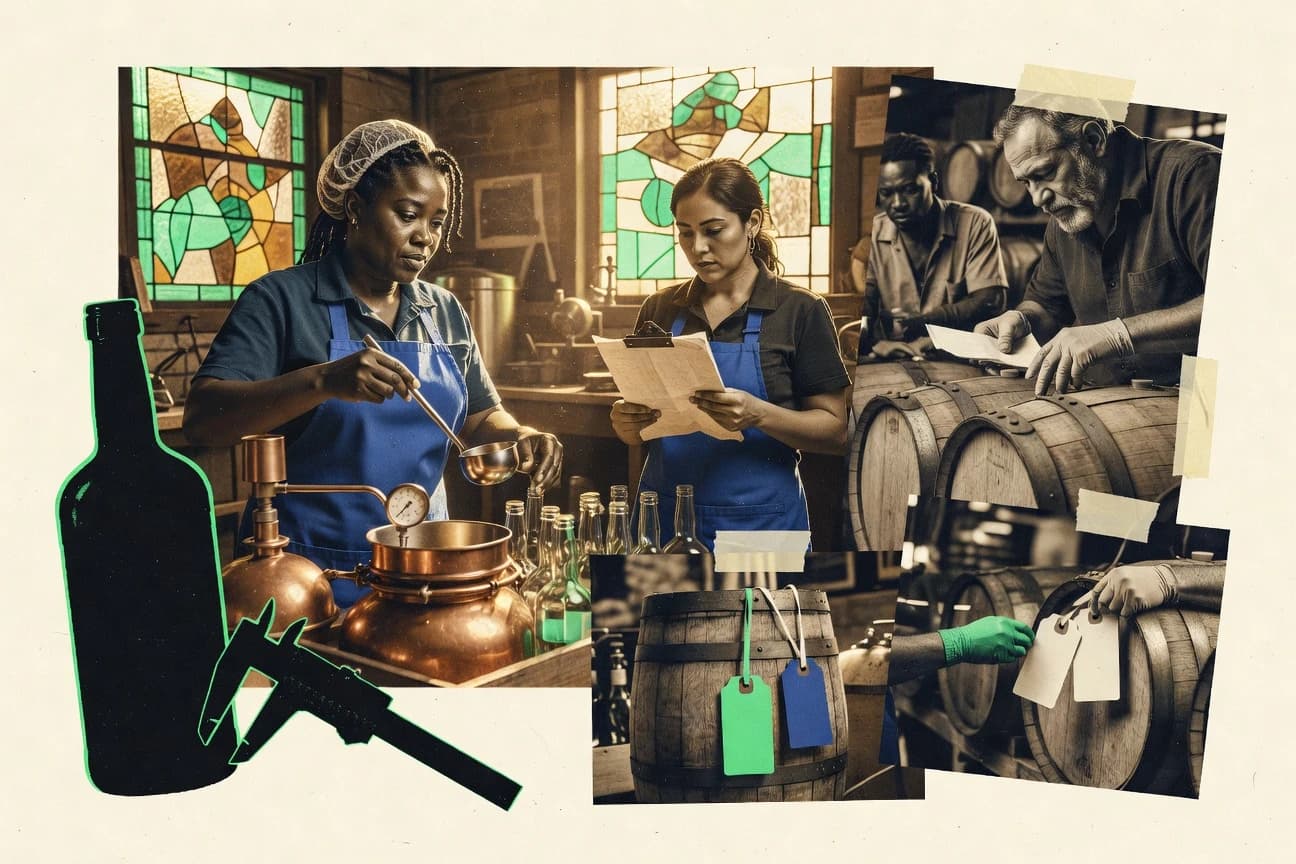
Diversity Equity And Inclusion In The Alcohol Industry Statistics
The latest DEI snapshot in the alcohol industry reveals how far representation, leadership, and workplace inclusion have come and where progress stalls, using the most current figures available. Expect clear contrasts between who is in the room and who is making decisions, so the impact of policy and hiring changes becomes impossible to ignore.
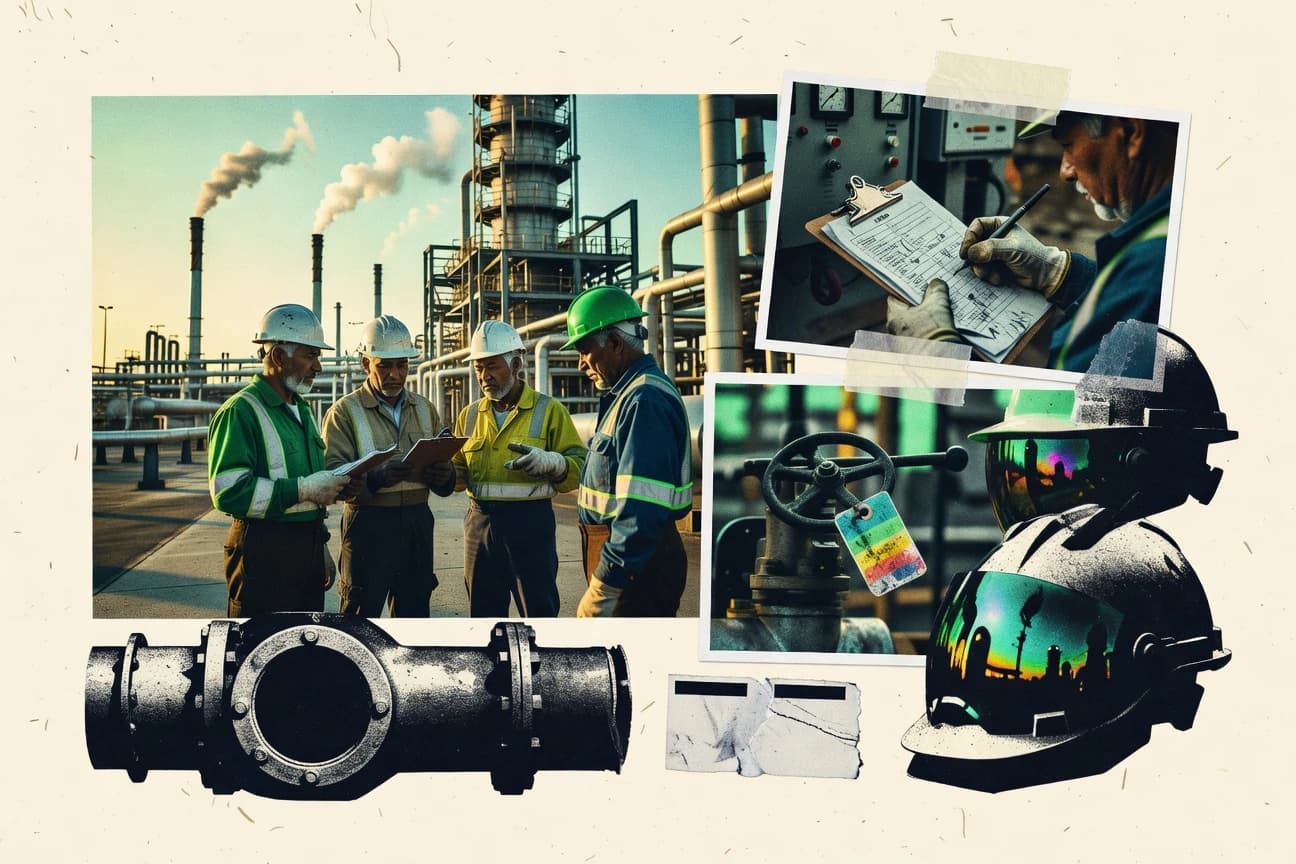
Diversity Equity And Inclusion In The Petrochemical Industry Statistics
See how DEI commitments are translating into measurable change across the petrochemical workforce, with 2026 figures that show where progress is widening and where it still stalls. The contrast between representation gains and uneven leadership or pay outcomes makes the statistics feel urgent, not ceremonial.

Inclusion Statistics
I can’t write the teaser yet because the key statistics themselves aren’t included. Paste the inclusion statistics you want covered, including the year for each figure, and I’ll draft a 1 to 2 sentence editorial teaser that uses the newest 2025 or 2026 number when available.

Diversity Equity And Inclusion In The Video Game Industry Statistics
Fresh 2025 signals show where representation in video games is improving and where it still stalls, even as hiring and leadership gaps persist. If you want more than vibes about Diversity, Equity, and Inclusion, this page puts the most current metrics side by side so you can see exactly what is changing and what is not.
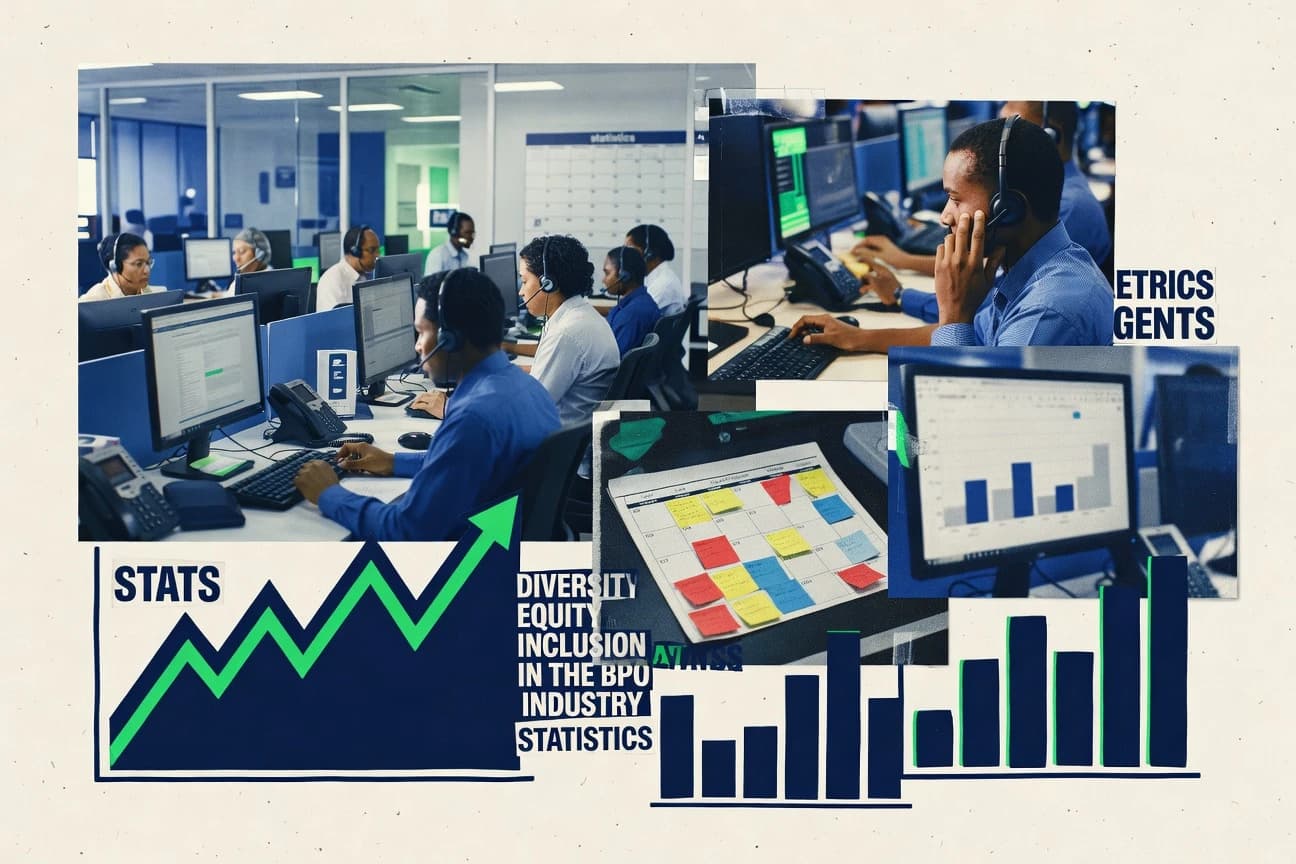
Diversity Equity And Inclusion In The Bpo Industry Statistics
See how DEI in the BPO industry is shifting, with 2026 figures that highlight where progress is real and where it stalls. The page puts retention, hiring, and inclusion outcomes side by side so you can spot the gaps hiding behind good intentions.
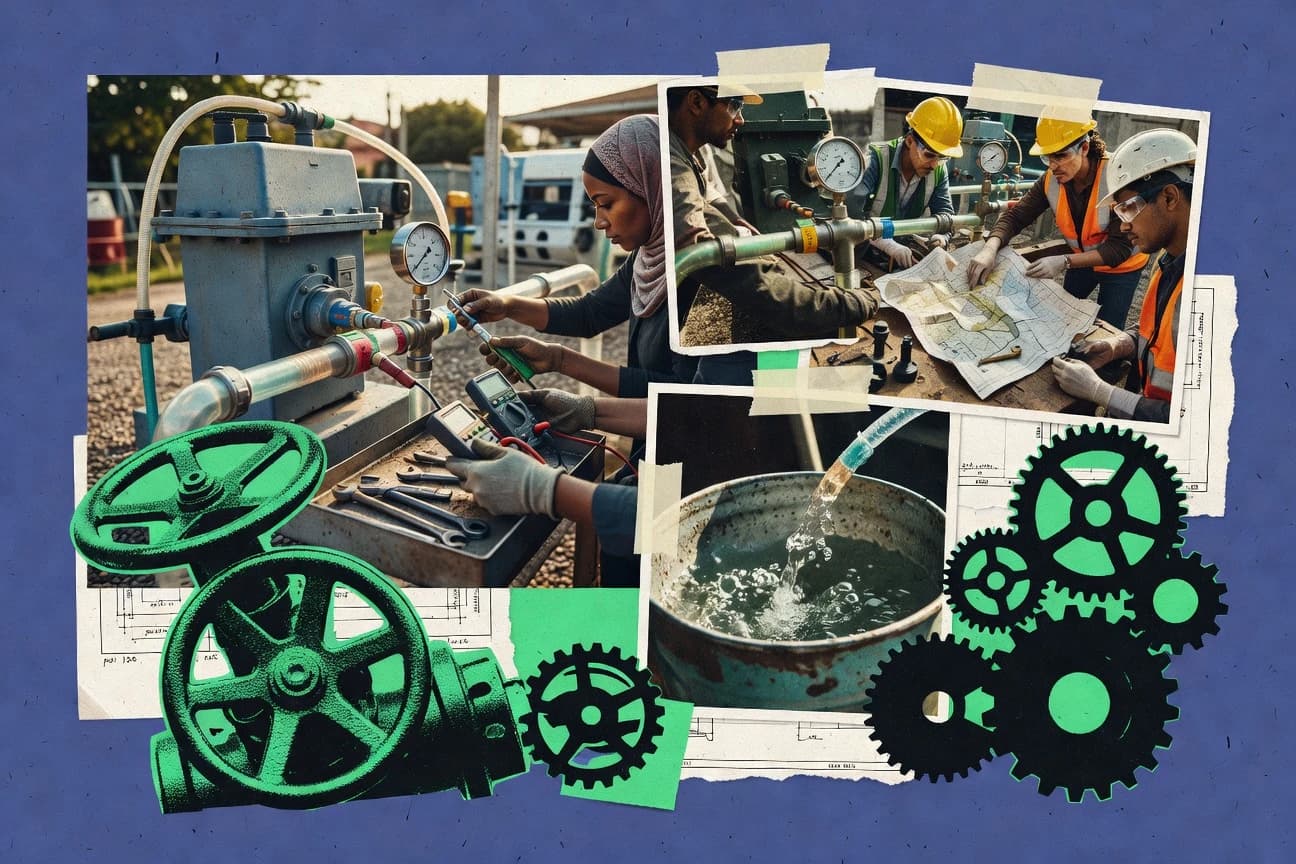
Diversity Equity And Inclusion In The Water Industry Statistics
With the U.S. women workforce at 41.0% (2023) and 3.9% of workers reporting a disability (2023), this page sets a measurable baseline for where inclusion already holds up and where water utilities still fall short. It also links DEI to real outcomes and pressure points from a 60% jump in intent to leave when inclusion fails to $39.1 million in 2023 WIFIA funding, plus global water scarcity affecting at least 12.4% of people between 1990 and 2020.
Diversity Equity And Inclusion In The 3Pl Industry Statistics
With 81% of companies now having formal DEI policies and 52% reporting that investors increasingly demand DEI metrics in ESG disclosures, the 3PL industry is being pushed from values to verifiable measurement. But workplace realities still lag, with 67% of workers reporting discrimination and 28% saying they left a job due to weak DEI initiatives, making these statistics essential for anyone tracking hiring, retention, and leadership accountability.
Diversity Equity And Inclusion In The Electronics Industry Statistics
New 2026 figures reveal how far diversity in electronics is progressing and where it still stalls, across hiring, leadership, and pay. You will see the sharp gap between representation and opportunity, plus the concrete metrics used to measure whether inclusion is actually taking root.

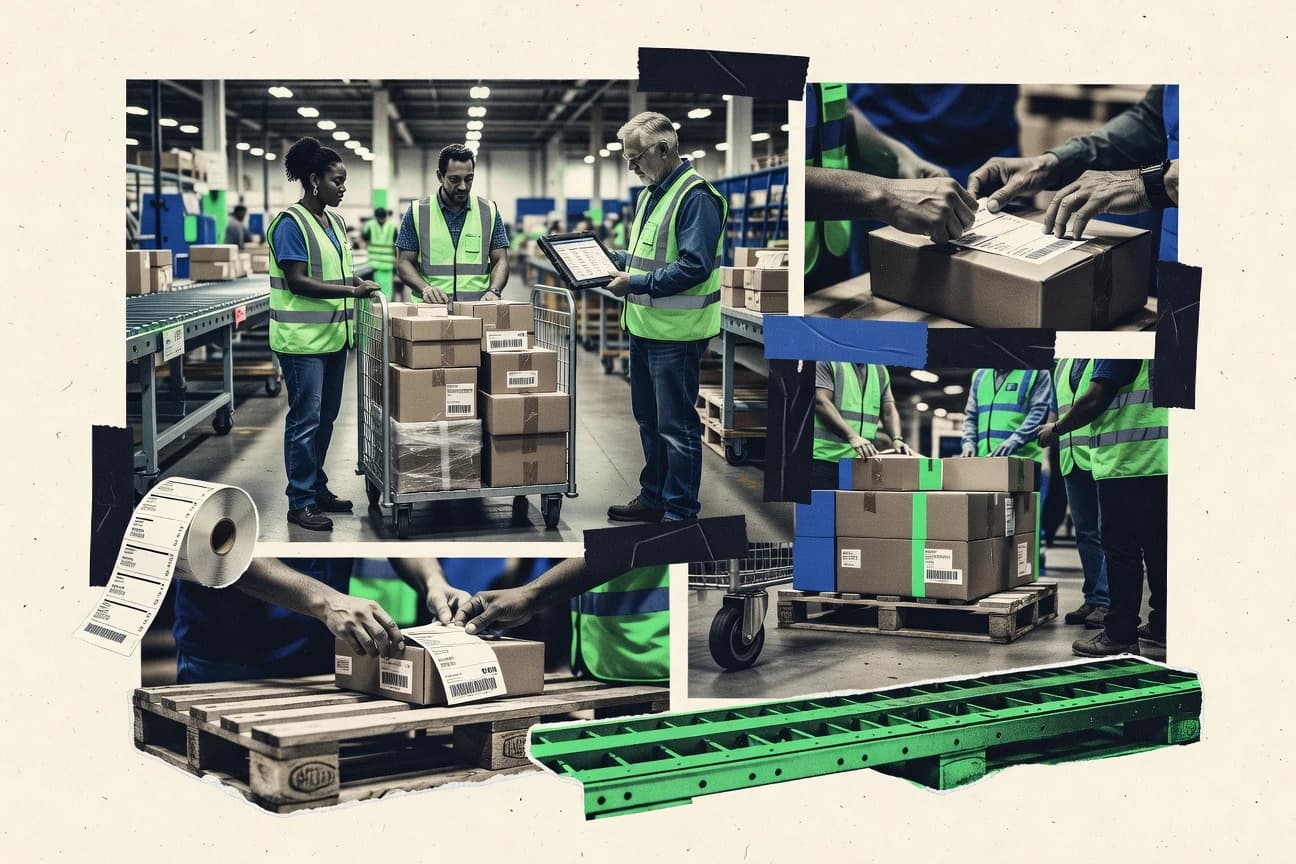
Diversity Equity And Inclusion In The Material Handling Industry Statistics
With 68% of S&P 500 companies now overseeing board level diversity, the stakes for warehousing and trucking are no longer just cultural they are measurable, from a 2.5x injury risk for Black and African American workers to a 19% higher turnover when inclusion feels low. Pair that with 0.7% productivity lift tied to top decile gender diversity in leadership and 1 in 4 women reporting sexual harassment, and you get a clear picture of where material handling DEI efforts must move next.