GITNUX MARKETDATA
Browse Our Category
Agriculture Farming
Latest update:


Backyard Chicken Statistics
Backyard chicken stats show a sharp 2026 shift toward smarter, smaller flocks with higher survival rates, but backyarders still fight the same bottlenecks around predators and feed costs. If you want a real-world benchmark for how many hens to start with and what to watch, this page translates the numbers into decisions you can make this season.

Kenya Sugar Industry Statistics
Kenya Sugar Industry numbers move fast, with 2025 production and pricing trends showing how quickly demand, costs, and output can pull in opposite directions. Get the statistics behind what changed, why it matters for millers and farmers, and where the pressure points are heading next.
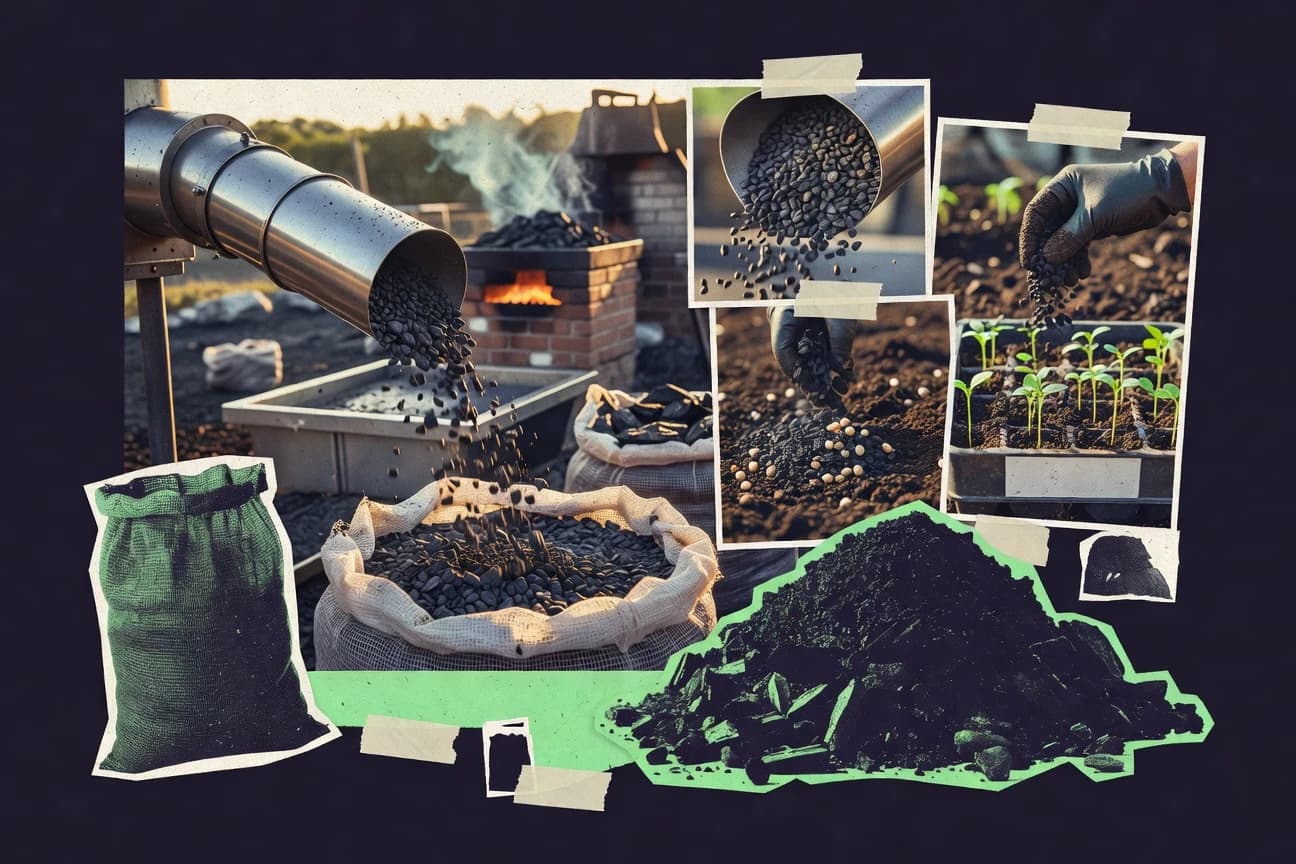
Biochar Industry Statistics
Biochar Industry tracks how production and investment are shifting fast, with 2025 figures pointing to a market that is no longer waiting in the wings. See where capacity is concentrating and which country signals the biggest near term momentum as these numbers pull demand forward.

Turf Industry Statistics
Turf Industry’s statistics reveal how the newest turf trends are shifting demand and spending, with 2025 data pointing to a faster change than many crews expected. You will see where participation and investment are rising while older assumptions about seasonality and product choices no longer hold up.

Vertical Farming Statistics
Vertical farming is forecast to grow at a 3% CAGR from 2024 to 2032, but the real shock is operational contrast: lighting alone can drive 30 to 45% of electricity use, yet optimized LED and climate control can cut operational costs by 25 to 35% while reducing nutrient runoff by 40 to 60% through recirculating hydroponics. If you want the clearest path to less waste and steadier harvests, this page connects the facility tradeoffs behind 3.2 times higher yield per unit area and faster controlled cycles with the energy and water metrics that determine whether the model pencils out.

Us Beef Industry Statistics
US Beef Industry statistics point to a clear 2025 shift in how cattle, feed, and prices are moving together, not in isolation. You will see which numbers tightened the squeeze for producers and which ones helped demand stay steadier than expected.
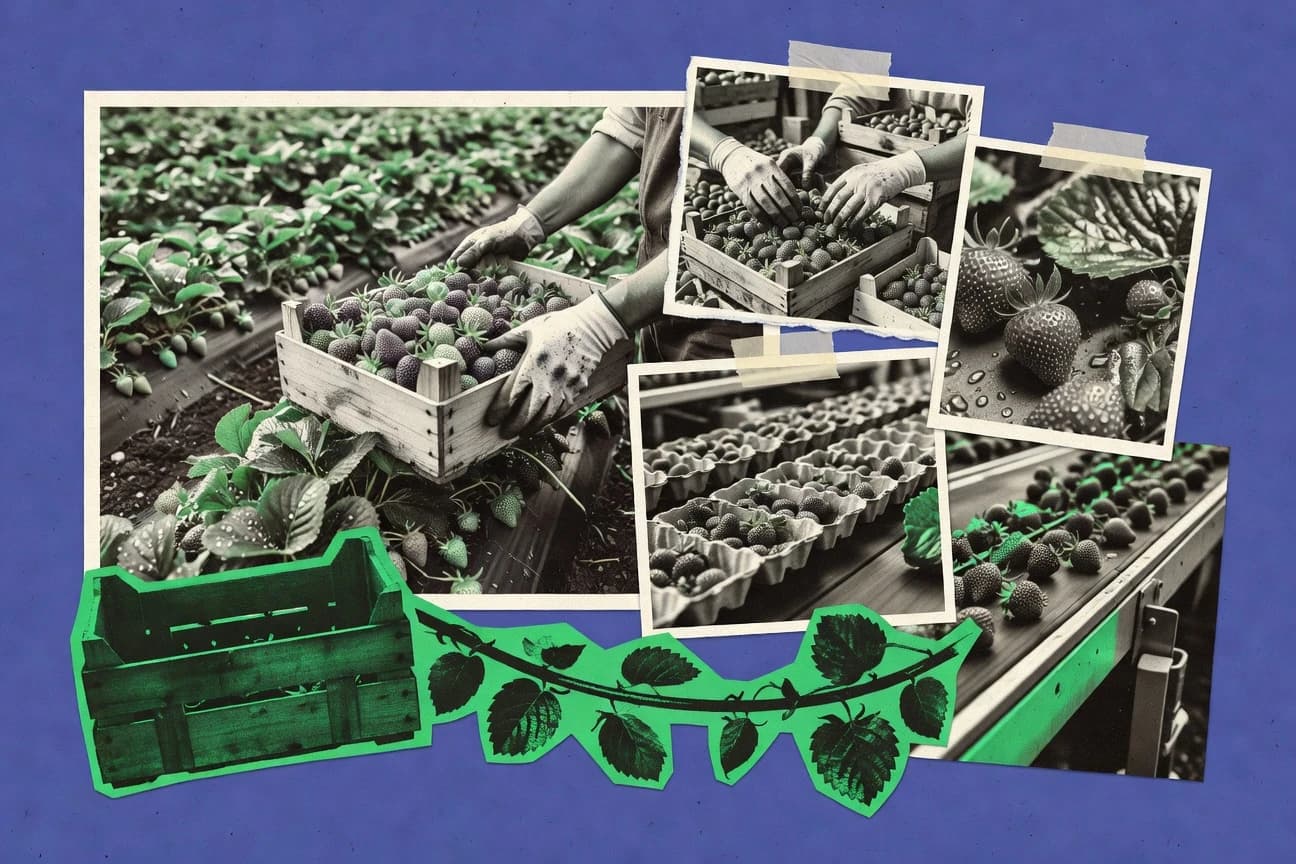
Berry Industry Statistics
Berry Industry brings you the most up to date snapshot of the category where 2026 production, market share, and export momentum matter most. Expect a few surprising contrasts between growth and profitability that explain why berry decisions right now look different than last year.

Wool Statistics
Wool is showing a sharp 2026 shift in how people are choosing warmth and texture, with key stats that explain why the trend is accelerating rather than fading. Read the page to see what those changes mean for real purchasing habits and where the wool signal is getting stronger.
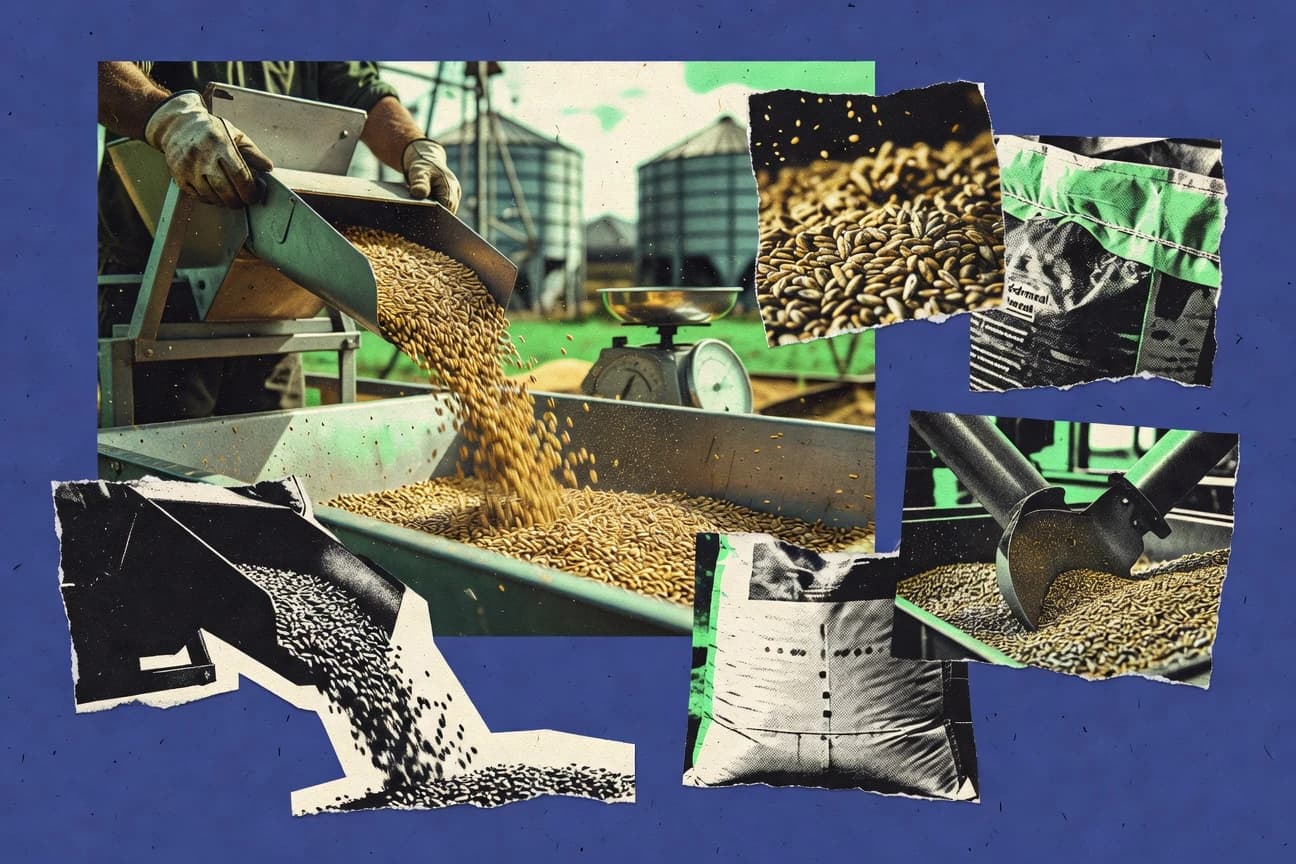
Livestock Feed Industry Statistics
Forecasts point to a 9.4% CAGR for the global animal feed market through 2032, with growth targets reaching about 1xx.xx billion by then, while profitability pressure stays tightly linked to ingredient costs that make up 60% to 70% of total feed manufacturing. Track the signals behind safer formulations and better performance, from EU residue and hygiene compliance to enzyme and additive impacts like phytase boosting phosphorus availability by up to about 40% and aquafeed enzyme trials improving feed conversion by roughly 5% to 10%, alongside the digital and automation shifts reshaping mills and supply chains.

Equine Industry Statistics
See how equine trade and workforce numbers are reshaping day to day operations, with the latest 2026 figures showing a noticeable swing compared with earlier baselines. If you manage stables, breed, or source feed and services, these stats will help you spot where demand is tightening and where capacity is shifting.

Flowers Industry Statistics
Find out why U.S. retail flower sales are projected to top $8.2 billion in 2025, even as imports surge and pricing pressures reshape what growers and retailers choose to stock. See which trends are driving that shift and what it could mean for margins and sourcing decisions right now.
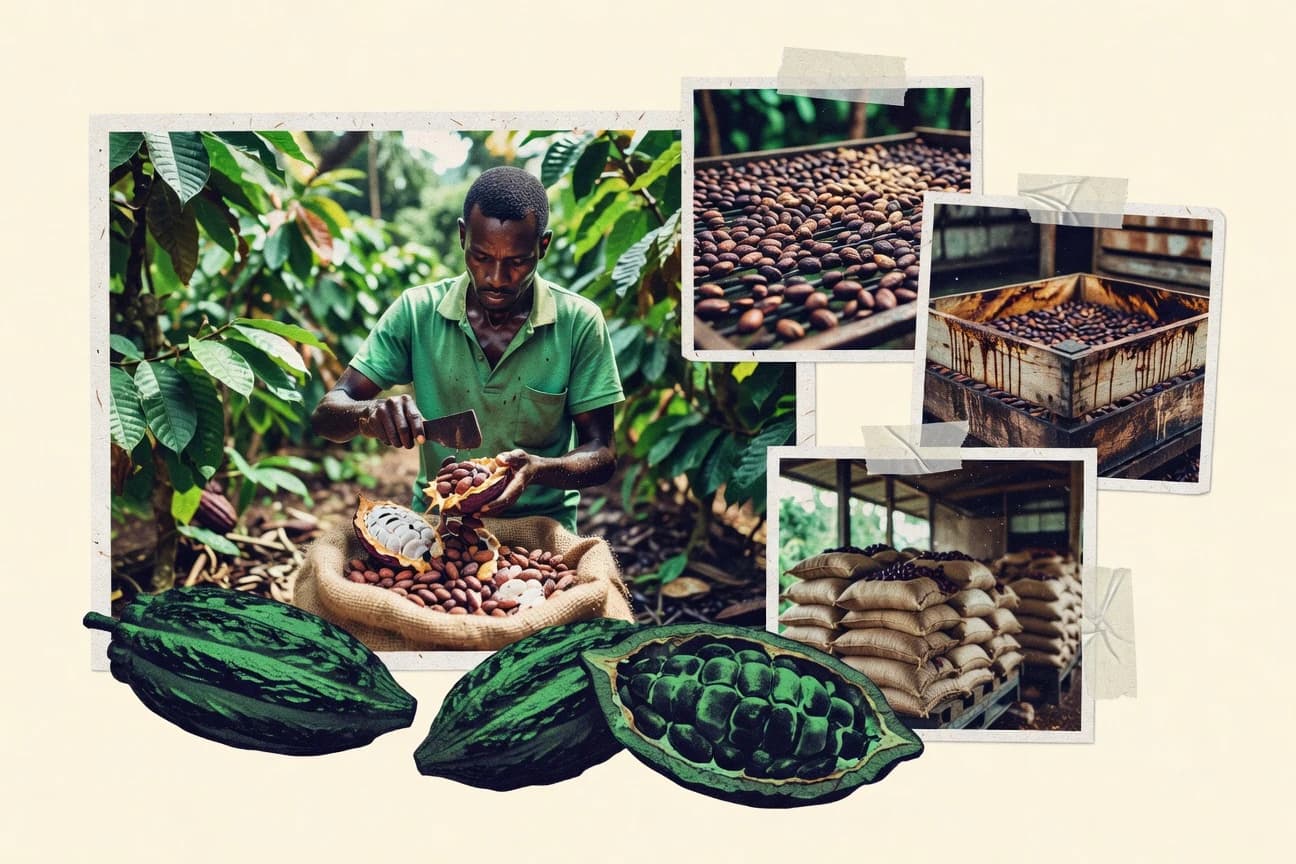
Cacao Industry Statistics
See how Cacao Industry metrics shifted in 2025, with yield and processing pressure moving faster than many farms and processors can adjust. This page puts the latest figures side by side to show where the biggest strain is building and what it could mean for next season.
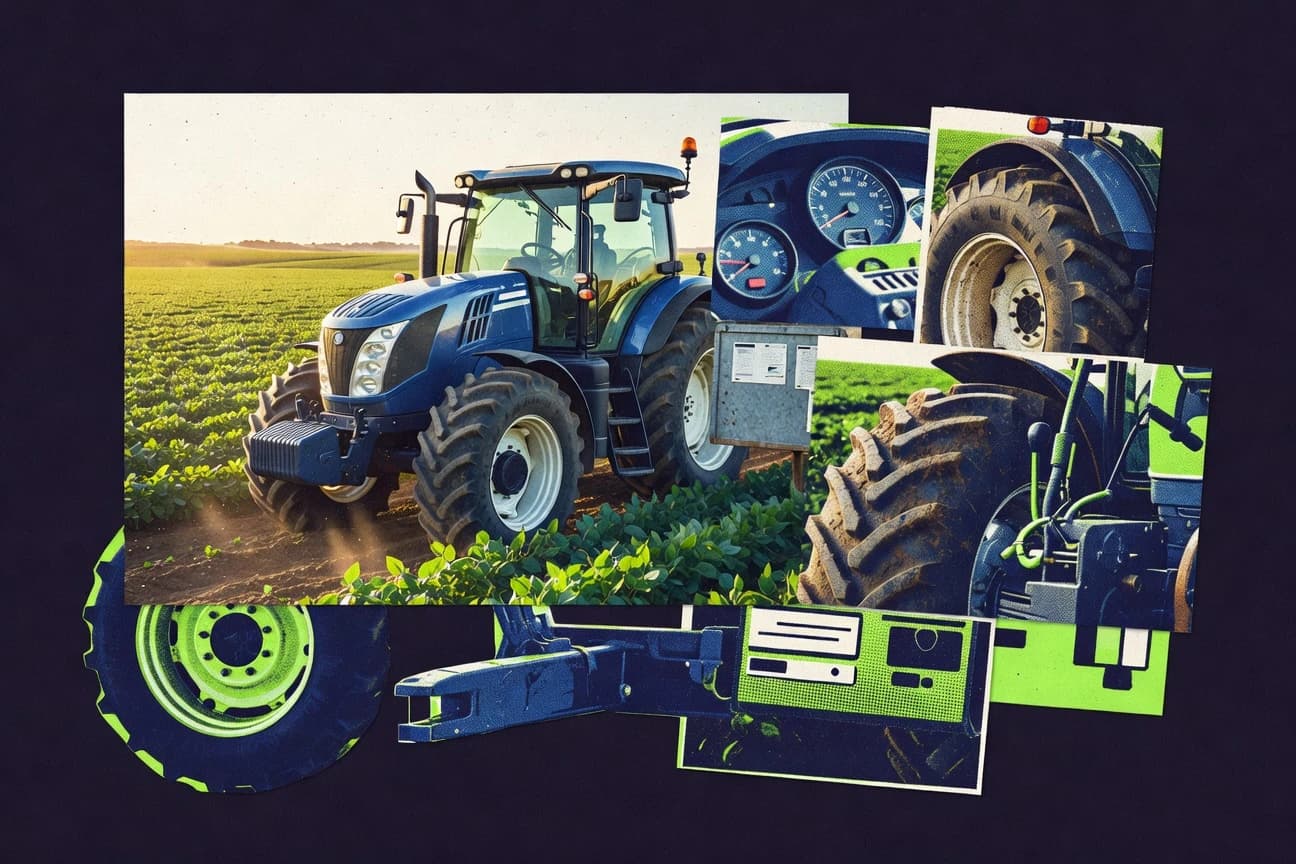
Tractor Industry Statistics
From 78% reporting more fatigue on older, unergonomic tractors to 47% lower crush and entrapment risk with properly used ROPS, these Tractor Industry statistics explain why “progress” can look like a safety upgrade and not just a comfort feature. You also get the 2023 market context behind that urgency, including a $60.3 billion global tractor market, alongside real-world injury costs such as $1.2 billion in annual U.S. economic burden from tractor injuries.
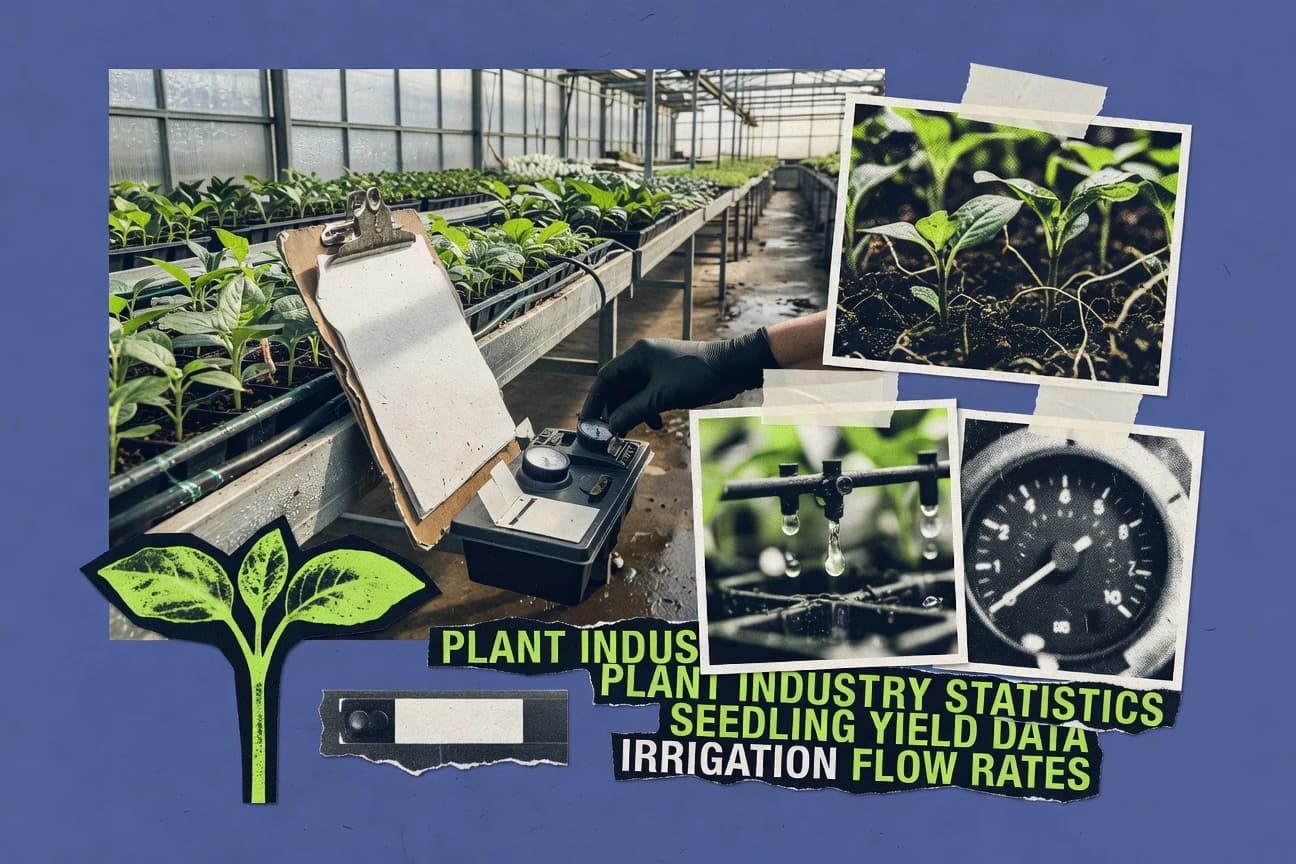
Plant Industry Statistics
Greenhouses blanket 26,832 km² in the Netherlands and the sector keeps expanding with $6.6 billion in 2023, while global hydroponics sits at $31.2 billion and CEA growth is forecast to accelerate from 2024 to 2030 at an 11.3% CAGR. Plant Industry pulls together the practical signals behind those totals, from how climate computers are used by most Dutch growers to the measurable gains and tradeoffs in water, energy, yields, and input costs.

Beef Industry Statistics
From faster trace data retrieval and precision tools that cut labor and shrink, to EU rules that expand cattle traceability events and recordkeeping uptake reaching 76% in a recent US survey, this page connects operational wins to beef system outcomes. You will also see how technology and management choices ripple through costs, emissions, and performance, including feedlot systems estimated at 0.35 kg CO2e per kg of edible beef under EU modeling assumptions.
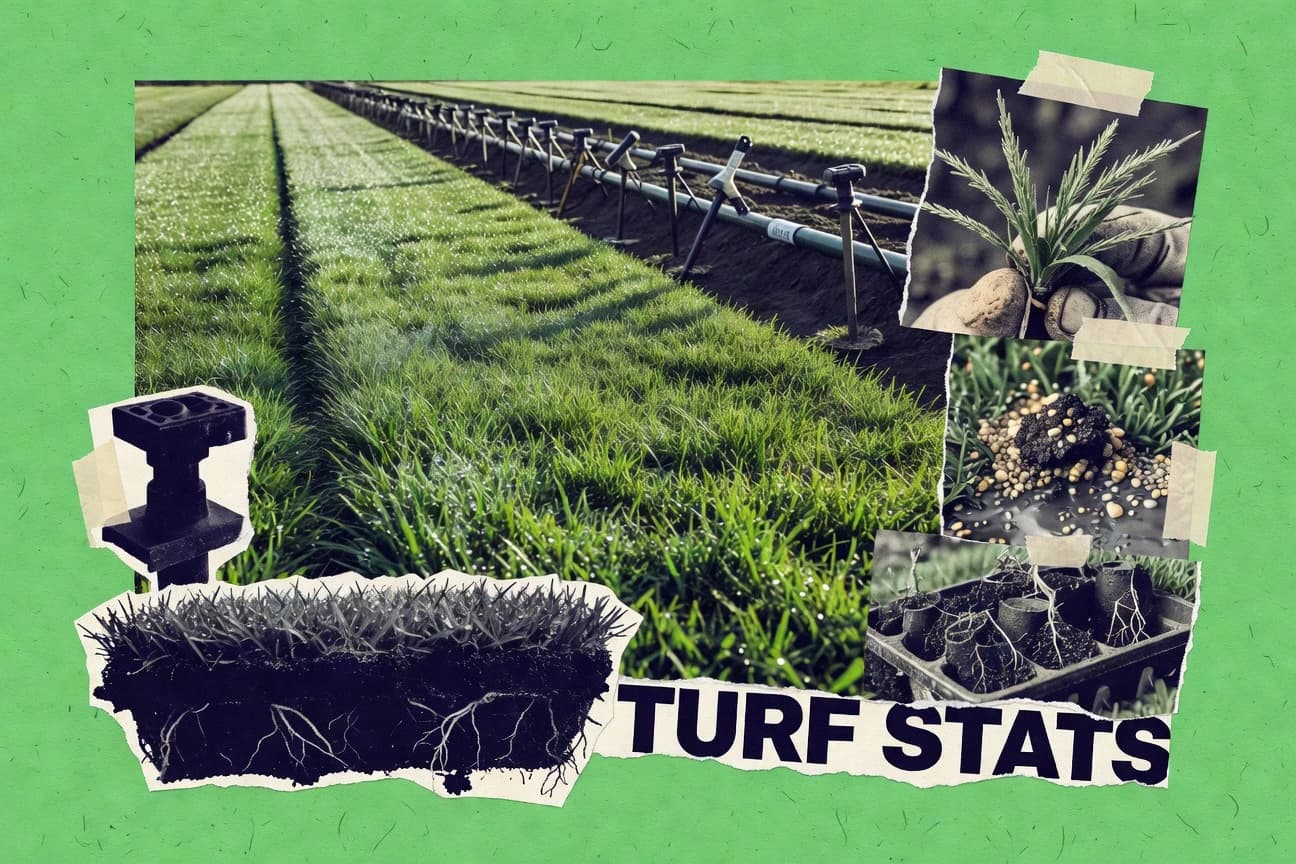
Turfgrass Industry Statistics
See how 2025 turfgrass industry figures shake up expectations, including a $1.4 billion lawn and turf grass seed market and a 6% projected annual growth rate through 2026. Pair that momentum with the reality of 32 million acres of managed turf to understand where demand is headed and what it could mean for product planning and resource decisions.

Palm Oil Industry Statistics
Global palm oil production reached 73.7 million metric tons in 2020/21 while the US imported 4.3 million metric tons in 2022, and the same page connects those volumes to today’s cost and compliance pressures from sustainable sourcing, EU RED II and EUDR rules, and carbon pricing. It also pins down the mechanics behind what you pay for and what you get from the mill, from typical extraction and fractionation yields to the trade reality of CIF benchmarks, derivatives liquidity, and how B20, B35, and biodiesel demand can reshape supply.
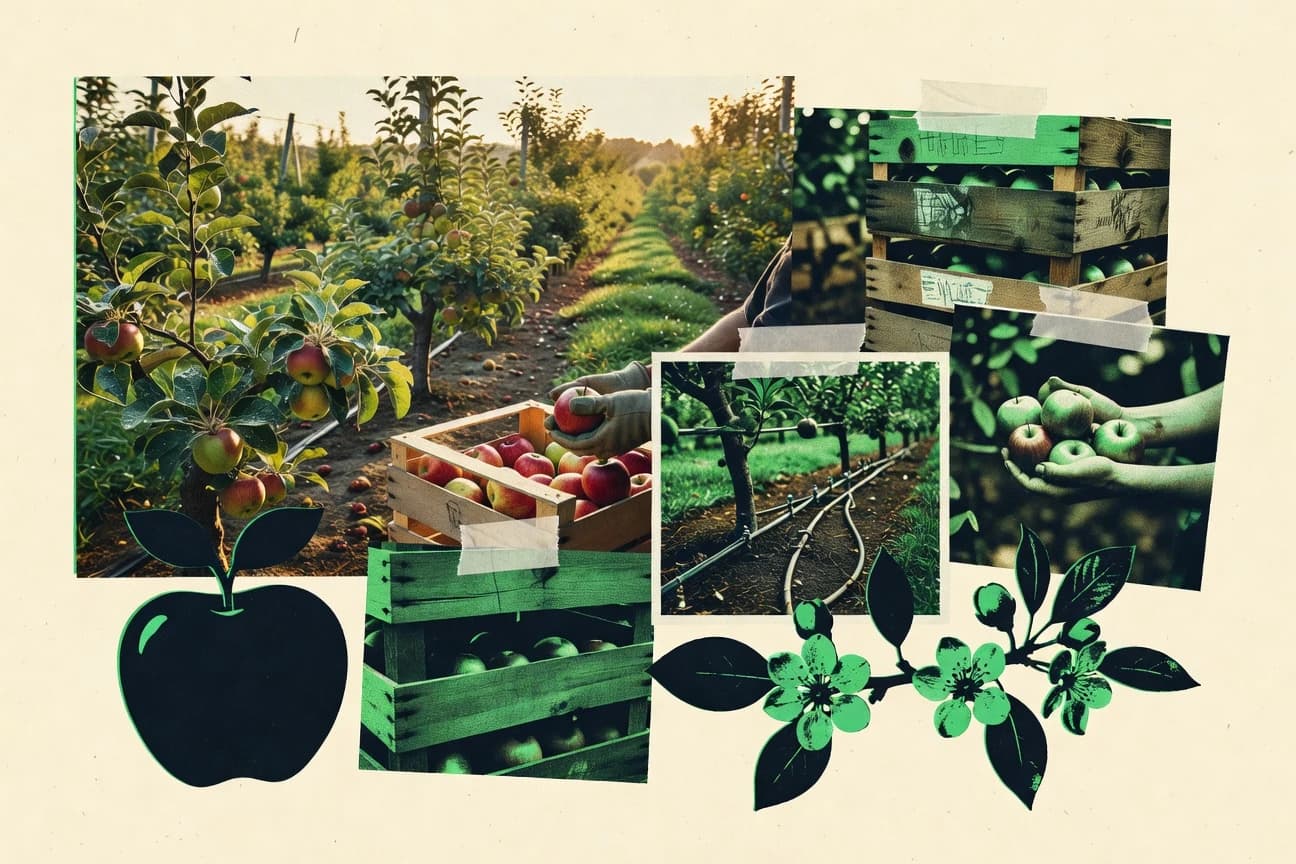
Apple Industry Statistics
Apple Industry’s most telling figures for 2026 and 2025 reveal where demand is tightening and where supply is adjusting, often in ways that contradict the usual assumptions. Read the page to see the exact swings side by side so you can spot what’s changing now and what is still lagging behind.

Thailand Rubber Industry Statistics
See how Thailand Rubber Industry data lays bare where growth is accelerating and where it’s slipping as production and exports shift toward new price pressure and demand swings in the most recent year. Use the latest 2025 figures to spot the contrast between volume momentum and value outcomes before the next market turn.
Pesticide Statistics
Pesticide reporting in 2026 shows a sharp shift toward stricter oversight, with enforcement actions climbing to 18,000. That change raises the practical question of what it means for actual field use and crop safety, which is exactly what this page breaks down.