GITNUX MARKETDATA
Browse Our Category
Agriculture Farming
Latest update:


Japan Fishing Industry Statistics
Japan’s latest fishing industry figures show a sharp mismatch between tightening supply realities and the economics of what’s landed. If you want to understand why processing and market demand are reshaping coast to counter, the 2025 numbers here will tell you exactly where the shift is happening.

Global Meat Industry Statistics
Global Meat Industry statistics pull a sharp contrast between record production levels and the pressure building across supply, prices, and trade flows as 2025 data reveals which regions are gaining leverage and which are getting squeezed. If you care about where meat demand is headed next and what could disrupt costs, this is the fastest way to see it.

Plant Statistics
Plant’s plant stats turn the usual “growth is up” narrative inside out by comparing what people expect from plants with what they actually measure now, including 2026 figures that sharpen the latest trends. If you care about where the numbers are heading next, these key statistics show the real pressure points, not the comfortable averages.

Korea Pork Industry Statistics
See how South Koreans are eating, producing, pricing, and trading pork, from 2,890,000 tons consumed domestically in 2022 to samgyeopsal driving 42% of total intake. The page also tracks the supply chain and market shifts behind the numbers, including processed pork rising 5.2% to 456,000 tons and e commerce sales tripling to 89,000 tons.

Flower Statistics
Flower shoppers are trending toward fresh, local purchases, with 2026 showing the biggest jump in in demand varieties since the last cycle. See which blooms are gaining ground fastest and what that shift means for pricing, supply, and what people are actually buying right now.

Insect Industry Statistics
From 2026 figures that put insect protein and production capacity in sharp focus, to the latest trends shaping costs, supply, and market momentum, this page shows what is actually changing in the insect industry rather than what forecasts hope will happen. You will see the surprising gap between ambition and real-world output that investors, producers, and policy watchers are using to make their next moves.

Pistachio Industry Statistics
Global pistachio trade hit $2.9 billion in export value, with 1.6 million metric tons shipped worldwide, yet the balance of demand is shifting fast across Pakistan, Germany, India, and Turkey. The page also ties market movement to real-world pressures like California groundwater limits and processing energy costs, while grounding it with health and quality evidence behind pistachios.

Insect Protein Industry Statistics
Global insect protein is scaling fast with an estimated $7.2 billion insect protein market by 2030, while investors poured $3.6 billion into insect farming start ups from 2014 to 2020. See how biology and policy line up at once with 85 percent plus digestibility in trials, aquaculture expected to drive 45 percent of demand by 2028, and EU rules since 2017/893 shaping what can be used in feed.

Dates Industry Statistics
In 2025, dates are no longer just a seasonal treat as the latest industry statistics track how demand, pricing, and production pressures are reshaping sales and supply chains. Read this to see the sharp swing behind the headlines and what it means for growers, distributors, and retailers planning for 2026.

Agriculture Equipment Industry Statistics
See how 2025’s pullback in trade volatility and shifting demand are reshaping the agriculture equipment balance sheet, from production lines to dealer inventory. This page connects the dots between adoption and pricing pressure so you can spot what will likely matter next across tractors, implements, and service.
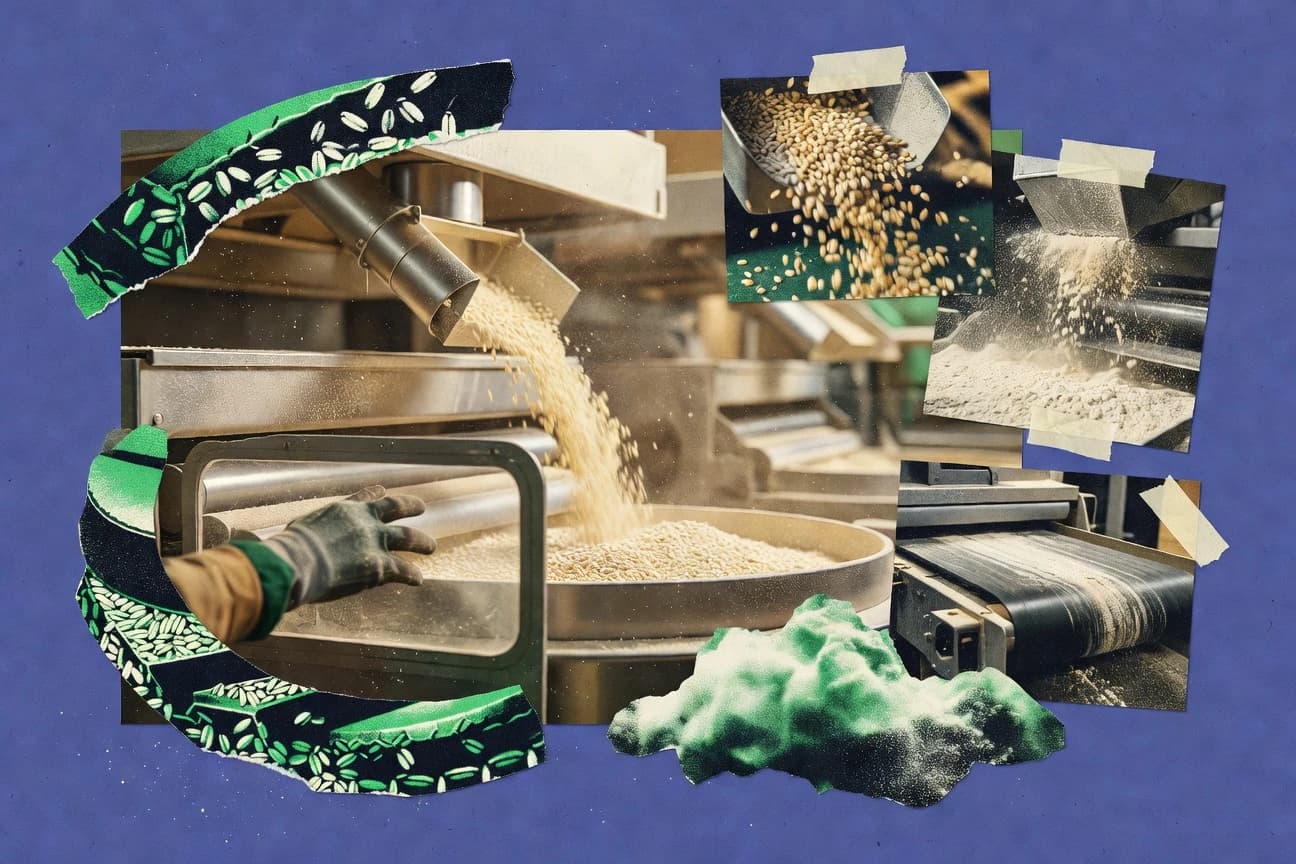
Grain Milling Industry Statistics
Philippines wheat imports topped 26.1 million metric tons in 2023, feeding downstream milling while global energy, shipping, and food safety pressures tighten across the supply chain. From a 5,650 Baltic Dry Index shock on 23 March 2022 and ISO 22000 and HACCP driven compliance to industrial flour market forecasts reaching USD 90.0 billion by 2030, this page connects capacity, cost, and regulations into one practical view of grain milling demand and risk.
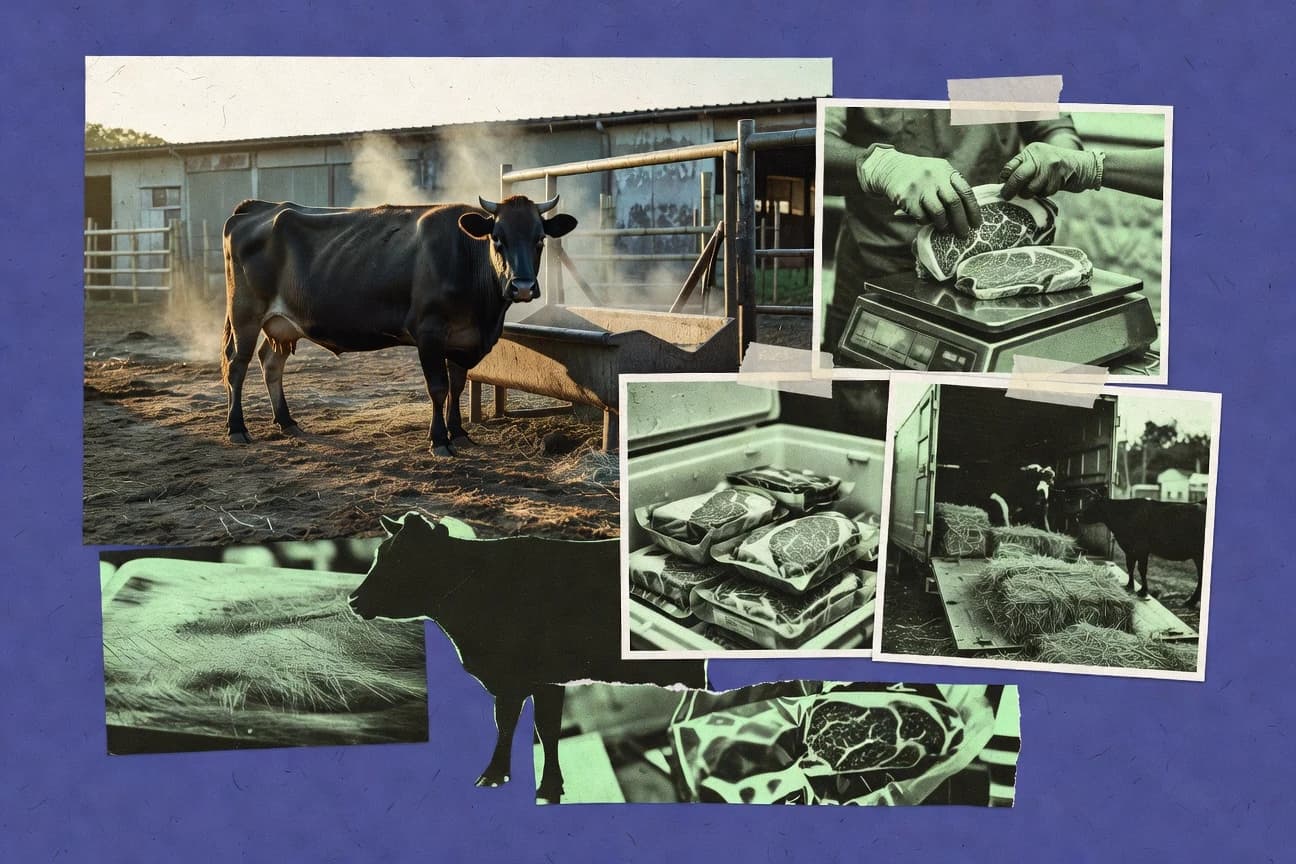
Japan Beef Industry Statistics
See how Japan beef trade, demand, and pricing moved in 2025, including what happens to imports and consumer costs as production and market supply tighten. The page puts the latest shifts side by side, so you can spot the sharp turn where cattle and beef industry realities start to hit the retail bill.

Global Dairy Industry Statistics
See how the global dairy value chain is reshaping itself in measurable ways, from cheese forecast to a 4.2% CAGR from 2024 to 2032 to cold chain losses of about 14% in food supply systems where timing still matters more than ever. You will also find the sustainability and economics tensions side by side such as dairy manure ammonia emissions of 10 to 30 kg NH3 per animal per year and energy use that can reach 40% of total plant demand, alongside market scale like $88.3 billion in global dairy imports in 2023.

Agtech Industry Statistics
Agtech investment hit $40.2 billion in 2026 even as adoption priorities shift toward smarter, data driven farms and more efficient supply chains. See how those swings map to the technologies and regions reshaping yield, labor needs, and resilience.

Lavender Industry Statistics
Lavender production has scaled to 600,000 tonnes globally, while the essential oil market keeps climbing toward 26.0 billion USD by 2032 at a 7.2% CAGR from 2024 to 2032 and Europe’s 4.5 billion euros market size in 2022 keeps demand tightly linked to distillation realities like 8 to 12% processing losses. You will also see how lavender essentials move through EU CN codes, what dominates the oil profile, and why linalool rich lavender sits at the intersection of trade rules, allergen labeling, and clinical evidence for anxiety support.
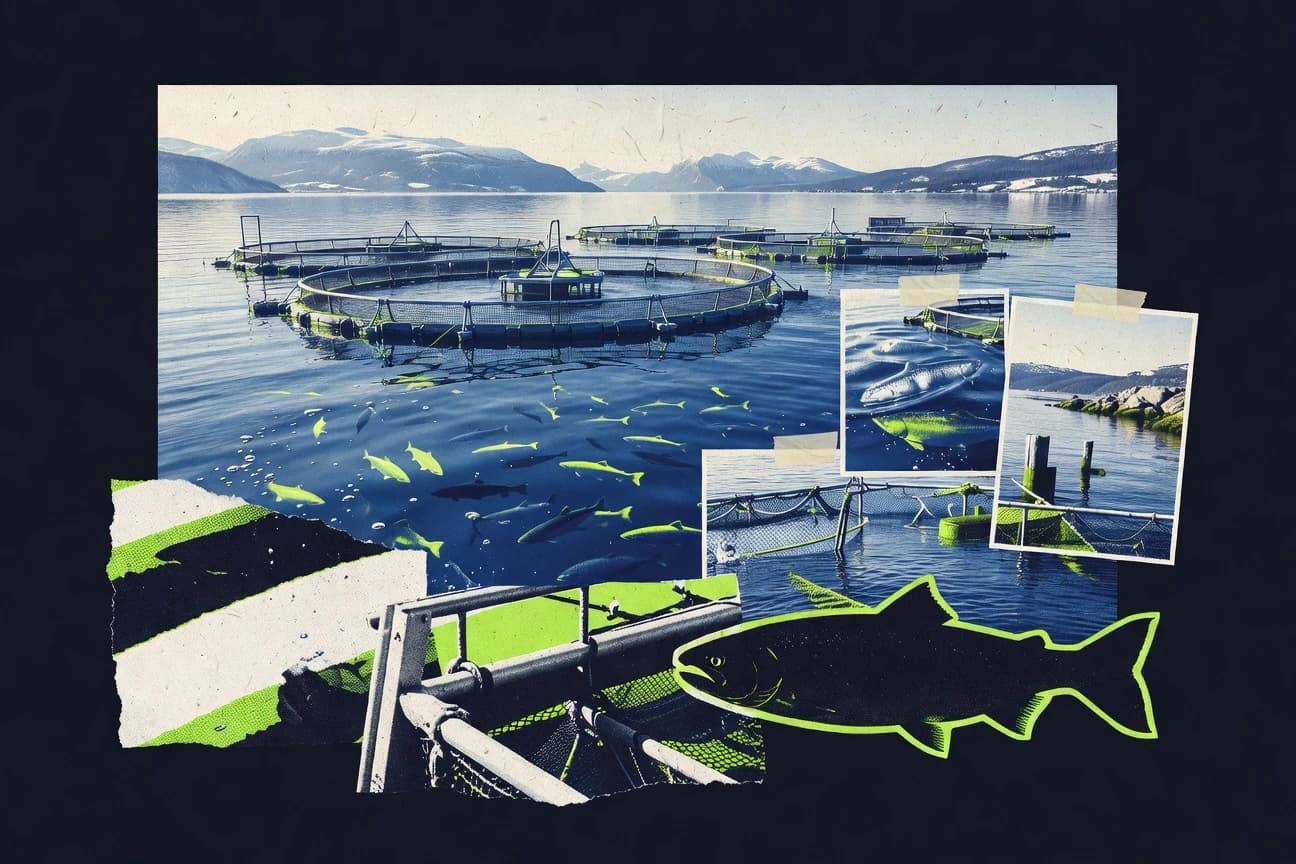
Norway Salmon Industry Statistics
Norway Salmon Industry statistics track how production, exports, and farm performance are moving together, and where the real pressure points have shifted. See the latest 2025 figures side by side to understand why some gains look solid while others tighten margins fast.

Merino Wool Industry Statistics
From 5% typical protein mass loss and 10 to 20% shrinkage that quietly reshapes effective cost per kg to a 0.1% foreign matter cap that can trigger costly rejects, this Merino Wool Industry statistics page connects the mill floor details to today’s market pressure where China’s wool and related imports sit at $3.0 billion. It also weighs sustainability and performance signals side by side with Merino’s reported 4.9 kg CO2e per kg wool equivalent and a 2 to 3% moisture regain advantage for better yarn spinning, so you can see why superfine fibers are pulled toward premium sportswear rather than traded as a commodity.
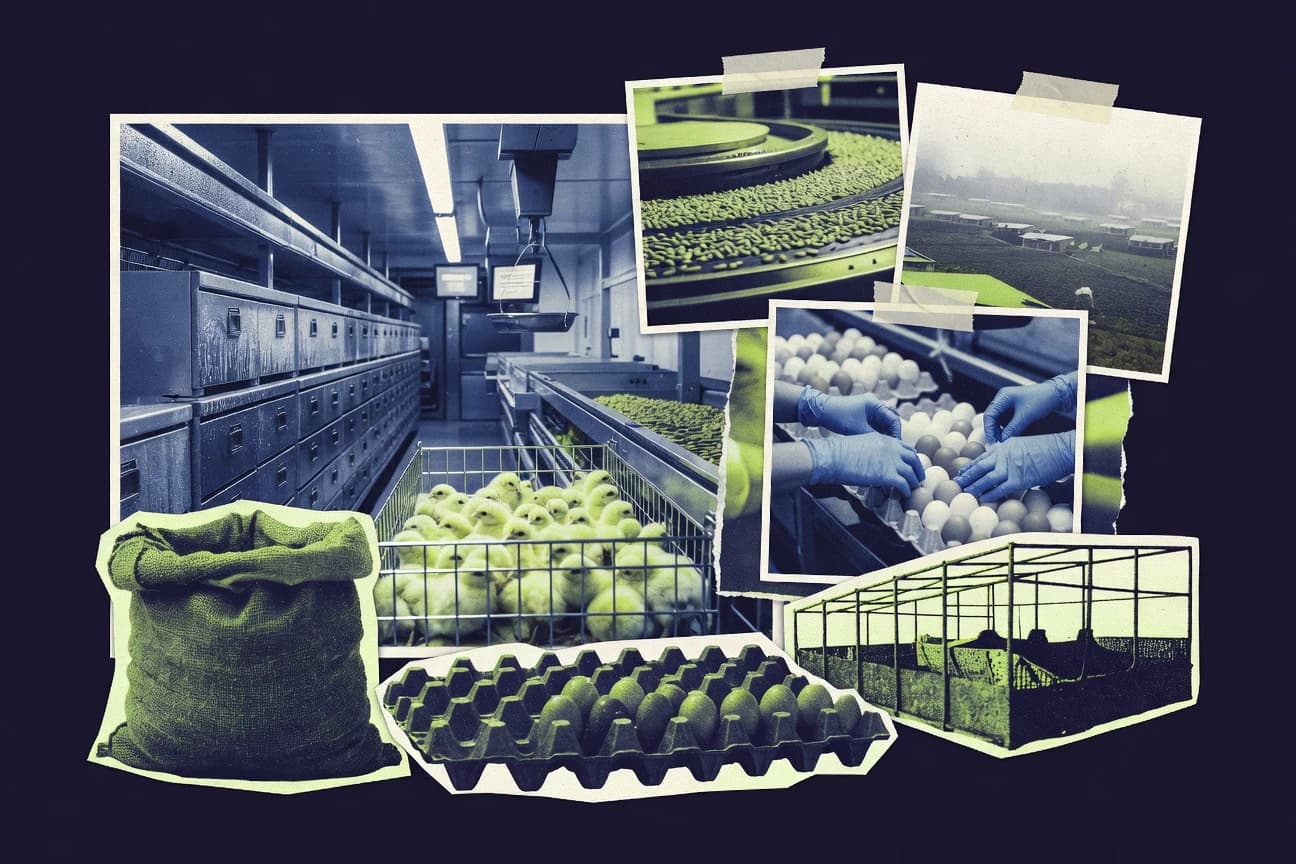
Global Poultry Industry Statistics
Global Poultry Industry’s latest figures track how chicken production, trade, and consumption are shifting in 2025 and what that means for farmers and buyers facing tighter margins and changing demand. If you think the market is stable, these numbers make the contrast impossible to ignore.

Sandalwood Industry Statistics
See how India’s 2019 to 20 exports of 42,000+ tons help drive a forecast US$ 1.2 billion global sandalwood market by 2033 alongside CITES Appendix II permit rules that actively shape every cross border shipment. You will also find how 10% to 25% β santalol benchmarks, steam distillation throughput, and 20 to 30 year rotation cycles collide with testing and anti adulteration checks to explain why pricing and supply reliability can flip fast.
Eu Meat Industry Statistics
Feed prices are still 19% above the prior year, while EU meat processing is cutting greenhouse gas intensity by 3.2% per kg carcass since 2019 and reducing energy intensity by 6.5% from 2020 to 2023. The page tracks how EU rules on antimicrobial use, hygiene, welfare at slaughter, and climate reporting are landing in costs, inspection intensity, and even export demand.