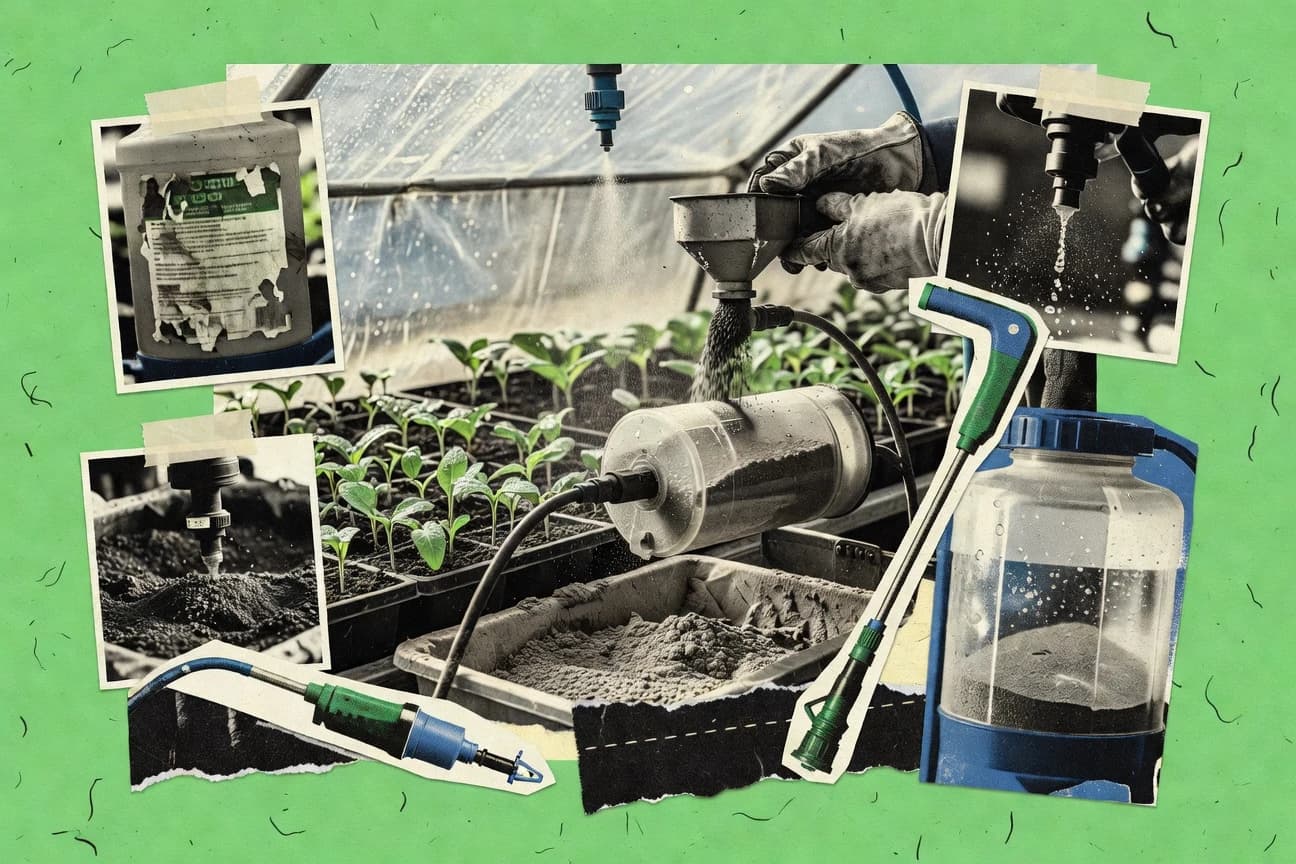

By 2026, global crop protection spend is forecast to reach US$ 95.0 billion, yet the biggest shifts in outcomes are coming from how chemicals are used, not just how much is sold. Policies now push farmers toward integrated pest management, precision application, and lower hazard choices, while research links pesticide intensity to both yield gains and measurable risks. The result is a tightly regulated industry where training, timing, and product rules can change costs, residue limits, and even ecosystem effects.
Key Takeaways
- Changing from calendar spraying to IPM can reduce pesticide costs by about 10%–20% in monitored program implementations.
- Global insecticide resistance is documented in 500+ insect species by 2023 in the Insecticide Resistance Action Committee (IRAC) database statistics.
- Biopesticide products can be priced at roughly 2–5x per hectare vs some conventional pesticides depending on efficacy and crop, as reported in a comparative cost analysis.
- EU Directive 2009/128/EC requires all professional pesticide users to use general principles of integrated pest management by Jan 1, 2014.
- Globally, 3.2% of pesticide expenditure was attributed to biopesticides in 2022, reflecting early but growing substitution.
- Biopesticides sales grew 10% in 2023 compared with 2022 in leading markets, per market tracker estimates.
- Under the EU’s Regulation (EC) No 1107/2009, approval of active substances is time-limited and subject to renewal at fixed intervals.
- EU Regulation (EU) 2019/1009 includes rules for EU fertilising products containing biological agents; it affects how biostimulant/biocontrol products can be marketed alongside agricultural inputs.
- EU Regulation (EC) No 1272/2008 requires CLP classification for hazardous substances; this covers labels and safety data sheets required for pesticide chemicals.
- Globally, 48% of pesticide-related risks are associated with toxicological hazards rather than exposure differences in risk models reviewed in peer-reviewed literature.
- In a meta-analysis of occupational pesticide exposure, adverse health outcomes increased with higher exposure intensity by an average odds ratio of 1.6.
- In the EU, 2.2% of groundwater bodies had pesticide concentrations exceeding thresholds in 2021 (EEA assessment).
- In a global synthesis, pesticide use contributes to preventing about 20% of crop losses from pests.
- 2.5x higher yield benefit reported for insecticide use in areas with high insect pest pressure in a meta-analysis (relative to no insecticide).
- 20% reduction in weed biomass achieved with herbicides in controlled field trials averaged across common modes of action (meta-analysis).
Switching to integrated pest management and precision use can cut pesticide costs and environmental risk.
Related reading
01 · Category
Cost Analysis5 stats
01
Changing from calendar spraying to IPM can reduce pesticide costs by about 10%–20% in monitored program implementations.
02
Global insecticide resistance is documented in 500+ insect species by 2023 in the Insecticide Resistance Action Committee (IRAC) database statistics.
03
Biopesticide products can be priced at roughly 2–5x per hectare vs some conventional pesticides depending on efficacy and crop, as reported in a comparative cost analysis.
04
Regulatory compliance costs for pesticide active ingredients can exceed US$ 10 million per substance during the approval process (industry and regulatory cost estimates).
05
EU public spending for integrated pest management programs averaged € 50 million per country per year in support schemes tracked by member-state reports.
Interpretation
Cost Analysis Interpretation
For cost analysis, shifting from calendar spraying to IPM can cut pesticide costs by 10% to 20%, while broader price pressures and compliance costs show why many growers and regulators are reevaluating how they spend, especially as resistance is documented across 500 plus insect species and approvals can cost over US$ 10 million per active ingredient.
02 · Category
Adoption And Practices3 stats
01
EU Directive 2009/128/EC requires all professional pesticide users to use general principles of integrated pest management by Jan 1, 2014.
02
Globally, 3.2% of pesticide expenditure was attributed to biopesticides in 2022, reflecting early but growing substitution.
03
Biopesticides sales grew 10% in 2023 compared with 2022 in leading markets, per market tracker estimates.
Interpretation
Adoption And Practices Interpretation
Adoption of safer pesticide approaches is accelerating as EU rules require integrated pest management by 2014 and biopesticides reached 3.2% of global pesticide spending in 2022, with sales growing 10% in 2023 in leading markets.
03 · Category
Regulation And Compliance5 stats
01
Under the EU’s Regulation (EC) No 1107/2009, approval of active substances is time-limited and subject to renewal at fixed intervals.
02
EU Regulation (EU) 2019/1009 includes rules for EU fertilising products containing biological agents; it affects how biostimulant/biocontrol products can be marketed alongside agricultural inputs.
03
EU Regulation (EC) No 1272/2008 requires CLP classification for hazardous substances; this covers labels and safety data sheets required for pesticide chemicals.
04
EU’s Farm to Fork strategy targets a 50% reduction in pesticide use by 2030 (with 25% reduction in more hazardous pesticides).
05
EU’s pesticide maximum residues standard is enforced through Regulation (EC) No 396/2005, which applies to both domestic and imported food.
Interpretation
Regulation And Compliance Interpretation
Under Regulation and Compliance pressures, EU rules are tightening on pesticide oversight, especially with Farm to Fork aiming for a 50% cut in pesticide use by 2030 and a further 25% reduction in more hazardous pesticides.
04 · Category
Safety And Risk5 stats
01
Globally, 48% of pesticide-related risks are associated with toxicological hazards rather than exposure differences in risk models reviewed in peer-reviewed literature.
02
In a meta-analysis of occupational pesticide exposure, adverse health outcomes increased with higher exposure intensity by an average odds ratio of 1.6.
03
In the EU, 2.2% of groundwater bodies had pesticide concentrations exceeding thresholds in 2021 (EEA assessment).
04
A study found neonicotinoid use is linked to a 24% reduction in honey bee survival rates under field-relevant exposure levels.
05
In a 2019 peer-reviewed review, pesticide exposure explained 29% of observed declines in non-target arthropod abundance across studies (meta-analytic estimate).
Interpretation
Safety And Risk Interpretation
Safety and risk in agricultural chemicals are driven more by toxicological hazard than exposure modeling, with 48% of pesticide-related risks tied to toxicity and occupational exposure showing worsening outcomes as intensity rises by an average odds ratio of 1.6.
More related reading
05 · Category
Performance And Impact11 stats
01
In a global synthesis, pesticide use contributes to preventing about 20% of crop losses from pests.
02
2.5x higher yield benefit reported for insecticide use in areas with high insect pest pressure in a meta-analysis (relative to no insecticide).
03
20% reduction in weed biomass achieved with herbicides in controlled field trials averaged across common modes of action (meta-analysis).
04
Fungicide treatments increased grain yield by an average of 10% in cereal crop field experiments compiled in a peer-reviewed review.
05
In a 2022 review of biopesticides, biocontrol products delivered a mean crop-protection effect size equivalent to about 60% of synthetic pesticide efficacy in the included studies.
06
A 2018–2021 field study reported 1.3% mean reduction in mycotoxin (DON) levels in treated wheat plots using fungicide programs vs controls.
07
In IPM programs documented in peer-reviewed studies, insect pest population reduction averaged 35% relative to conventional calendar spraying.
08
Precision application can reduce pesticide use by 10%–30% while maintaining pest control effectiveness, based on a synthesis of field and model studies.
09
Variable rate spraying reduces active ingredient overspray by about 25% on average in controlled trials (precision ag literature review).
10
A meta-analysis found that training and IPM education reduced pesticide application frequency by 17% on average.
11
In a 2019 study, improved application timing reduced disease severity by 18% relative to standard timing schedules.
Interpretation
Performance And Impact Interpretation
Across performance and impact evidence, pesticide inputs deliver meaningful crop protection with measurable average gains, such as insecticides providing about 2.5 times higher yield benefits under heavy pest pressure and IPM and training cutting pesticide application frequency by 17% while still achieving strong pest and disease control outcomes.
06 · Category
Regulation & Compliance5 stats
01
In 2023, 86% of active substances approved under the EU pesticide framework were classified as low-risk (share of approvals in the Low-risk active substances category in ECHA/EU pesticide active substance tracking).
02
In 2022, the EU recognized 17 new active substances under Regulation (EC) No 1107/2009 (count of new approvals in that year’s active substance approval updates).
03
In 2023, the European Chemicals Agency reported 1,492 pesticide-related CLP classifications notifications in ECHA’s PCN ecosystem (reported number of notifications for pesticide active substance/mixture related submissions).
04
ECHA reported 1,900+ substance-based entries under harmonised classification for pesticide-relevant chemicals in the CLP system as of 2024 (count of harmonised classification entries relevant to EU hazard classification system).
05
In 2023, the EU submitted 1,120 notifications under the EU Rapid Alert System for dangerous non-food products (RAPEX) where pesticide-related products were among notified categories (count of relevant notifications in RAPEX public dataset filtered by pesticide-related terms).
Interpretation
Regulation & Compliance Interpretation
Regulation and compliance in European agricultural chemicals is trending heavily toward safety-driven oversight, with 86% of pesticide active substances classified as low risk in 2023 alongside a steady stream of enforcement and hazard reporting such as 1,492 pesticide-related CLP notifications and 1,120 RAPEX notifications in that same year.
07 · Category
Market Size1 stats
01
The global spend on crop protection is forecast to reach US$ 95.0 billion by 2026 (projected market size).
Interpretation
Market Size Interpretation
The market size for agricultural chemicals is set to keep expanding as global crop protection spending is forecast to reach US$ 95.0 billion by 2026.
08 · Category
Sustainability & Risk1 stats
01
In 2022, biopesticides accounted for 3.3% of U.S. pesticide usage by active ingredient (share of usage from EPA’s biopesticides category in pesticide usage dataset).
Interpretation
Sustainability & Risk Interpretation
In 2022, biopesticides made up just 3.3% of total U.S. pesticide usage by active ingredient, indicating that while greener biological options are part of the sustainability and risk toolkit, they are still used at relatively low scale.
Reference
Cite This Report
This report is designed to be cited. We maintain stable URLs and versioned verification dates. Copy the format appropriate for your publication below.
APA
Sophie Moreland. (2026, February 13). Agricultural Chemicals Industry Statistics. Gitnux. https://gitnux.org/agricultural-chemicals-industry-statistics
MLA
Sophie Moreland. "Agricultural Chemicals Industry Statistics." Gitnux, 13 Feb 2026, https://gitnux.org/agricultural-chemicals-industry-statistics.
Chicago
Sophie Moreland. 2026. "Agricultural Chemicals Industry Statistics." Gitnux. https://gitnux.org/agricultural-chemicals-industry-statistics.
Sources & references
36 datasets cited across this report · attribution is report-level
+18 additional datasets cited (not shown individually)