GITNUX MARKETDATA
Browse Our Category
Agriculture Farming
Latest update:


Agrochemical Industry Statistics
Global agrochemicals are heading toward US$96.1 billion in 2024 crop protection demand as soil salinity already hits 191.1 million hectares worldwide, while precision gains and resistance threats create a sharp tradeoff for growers and regulators. With the crop protection market projected to reach US$91.7 billion by 2029 and biopesticides rising toward US$18.7 billion by 2030 under EU authorization and reporting rules, the page connects market growth, crop loss drivers, and compliance costs into one decision ready picture.

Milling Industry Statistics
Find out how milling industry metrics are reshaping the business case right now, with 2026 figures that highlight where downtime, demand shifts, and efficiency gains are moving fastest. It is a clear contrast to earlier performance expectations, showing which parts of the process are delivering results and which are lagging behind.

Texas Beef Industry Statistics
See how Texas beef numbers are shifting in 2026 and what that means for feed, herd, and pricing pressures across the state. If you think the story is just about demand, these figures make it clear the supply side is changing fast.

Rose Industry Statistics
Rose Industry’s latest figures reveal how quickly the market is shifting, highlighted by the 2026 greenhouse output trend and the new balance of where demand is actually forming. If you think rose decisions are driven by tradition, these statistics will force you to reconsider what is moving fastest right now.

Dairy Industry Statistics
Global dairy exports hit $239.4 billion in 2022 while the global whey protein ingredients market reached $5.7 billion in 2023, setting up a sharp contrast between trade momentum and ingredient demand. From emissions at 3.4 billion tonnes CO2e and 30% of agricultural methane tied to dairy to recalls where dairy foods accounted for 19.6% of violations in 2020, the page connects farm practices, animal health, and EU and US rules to what consumers actually face.

Florida Nursery Industry Statistics
See how Florida’s nursery industry is shifting right now, with the latest figures showing which products and markets are pulling ahead. One set of numbers may surprise you, because the growth story does not look the same everywhere in the state.

China Seed Industry Statistics
China Seed Industry’s latest statistics track how new varieties, tighter regulation, and shifting demand are reshaping what gets planted and what farmers can actually access, with current 2025 signals that feel different from prior years. If you want to understand where seed power is moving now, not where it was a few seasons ago, this page puts the most telling figures side by side.
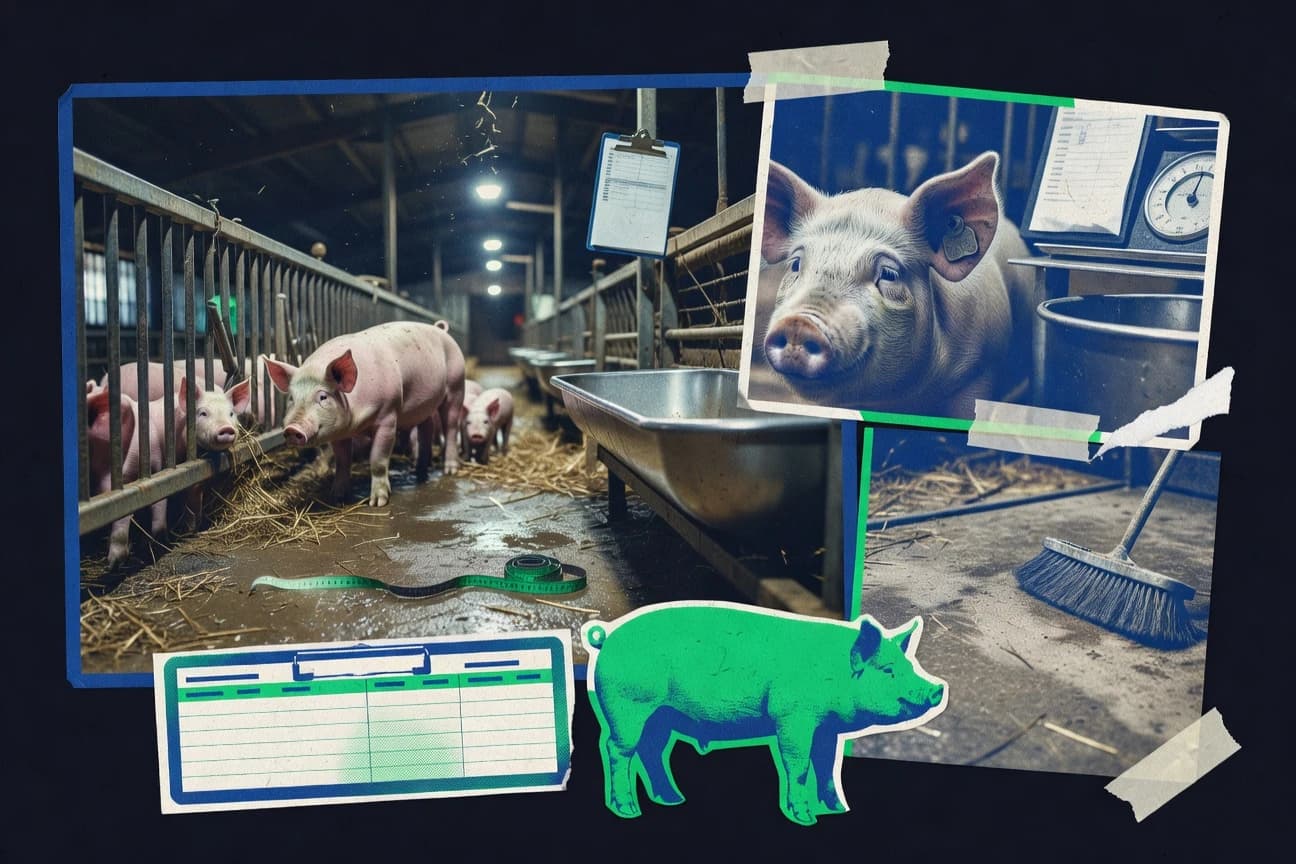
Swine Industry Statistics
See how 2025 USDA projections reshape the swine feed and production picture, with costs, supply, and market pressure moving in different directions than many producers expect. The page lays out the specific headcount, pricing, and supply shifts that will matter most when planning next year’s operations.

Germany Meat Industry Statistics
Germany’s meat market is worth €31.4 billion to consumers in 2023 but rising compliance pressure is reshaping costs, with 24.7% of firms reporting higher operating expenses from regulatory compliance and enforcement activity up 31% for animal welfare inspections versus 2022. Preferences and production tell a second, sharper story with 42% of consumers demanding traceability, 47% of meat processors using on site renewable electricity, and Germany shipping $6.1 billion of meat and edible offal while importing $5.0 billion.

Japan Egg Industry Statistics
Japan’s egg industry data in 2025 puts production and supply in sharp focus, highlighting how quickly volumes and prices can swing when demand and feed costs move. If you want to understand where the next shift is likely to land for farms, retailers, and consumers, these up to date figures make the tension impossible to ignore.
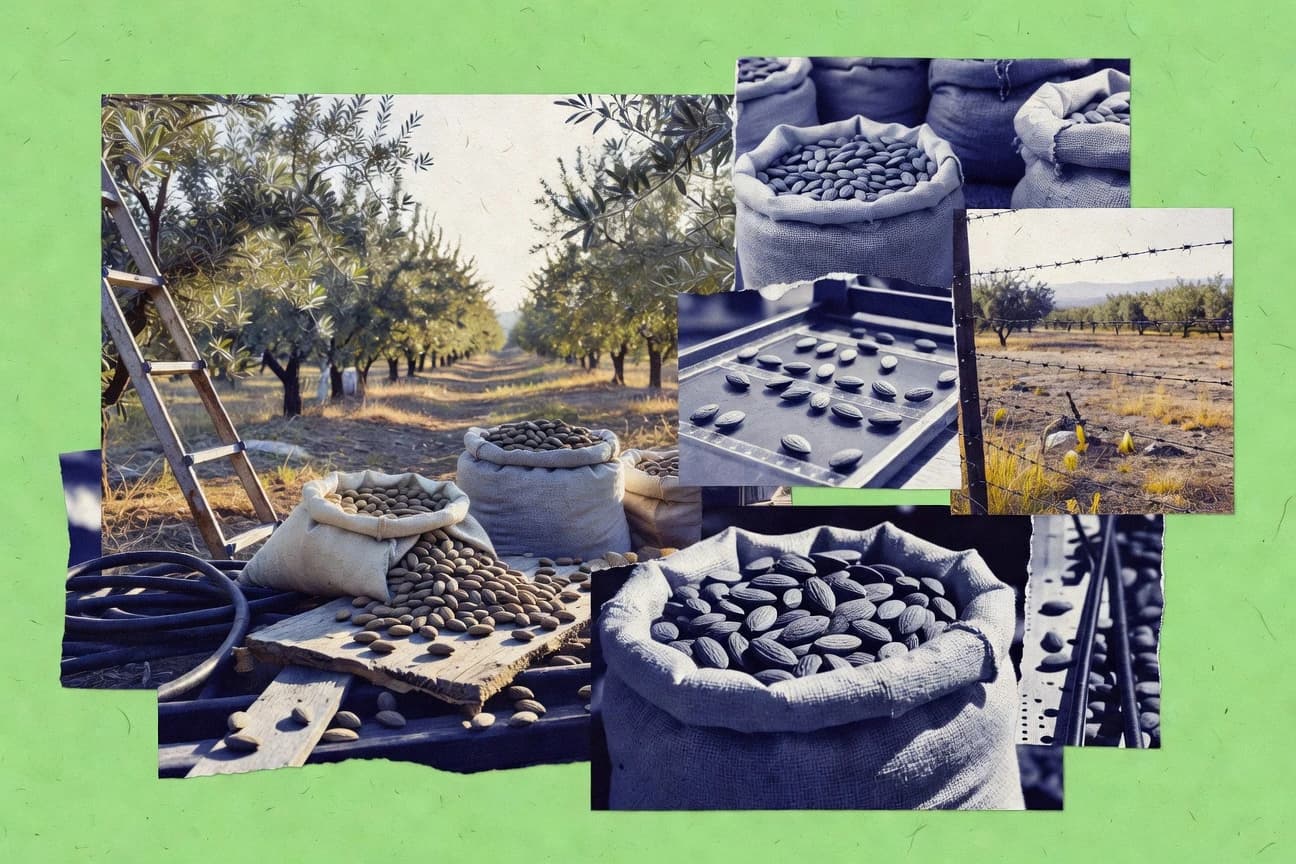
Almond Industry Statistics
Almond economics and risk management collide in one page with 2023 US almond exports topping $5.0 billion and California processing capacity at about 5 billion pounds per year while pricing, water use, and emissions sit under tight regulatory checks. You will also see how health evidence and industry standards line up, from cold pressed oil yields and allergen labeling to FDA and EU controls on aflatoxin and pesticide residues, where even tiny shipment exceedances can matter.

Agricultural Crop Protection Industry Statistics
How quickly agricultural crop protection priorities are shifting in 2025 becomes clear when you compare emerging disease pressure with the year’s latest market and investment signals. Read the page to see where growth is accelerating and where spending is tightening, so you can separate real risk from noise for the next season.

Avocado Industry Statistics
Avocado Industry charts where demand and money meet, with a forecast global market size of $4.9 billion by 2030 alongside trade receipts like over $7 billion in export value and sharply different import footprints across Europe and North America. It also connects the cold chain and ethylene control that keep fruit on shelves to the nutrient and cardiovascular research that keeps consumers coming back, all backed by the EU rules and residue limits shaping every supply decision.
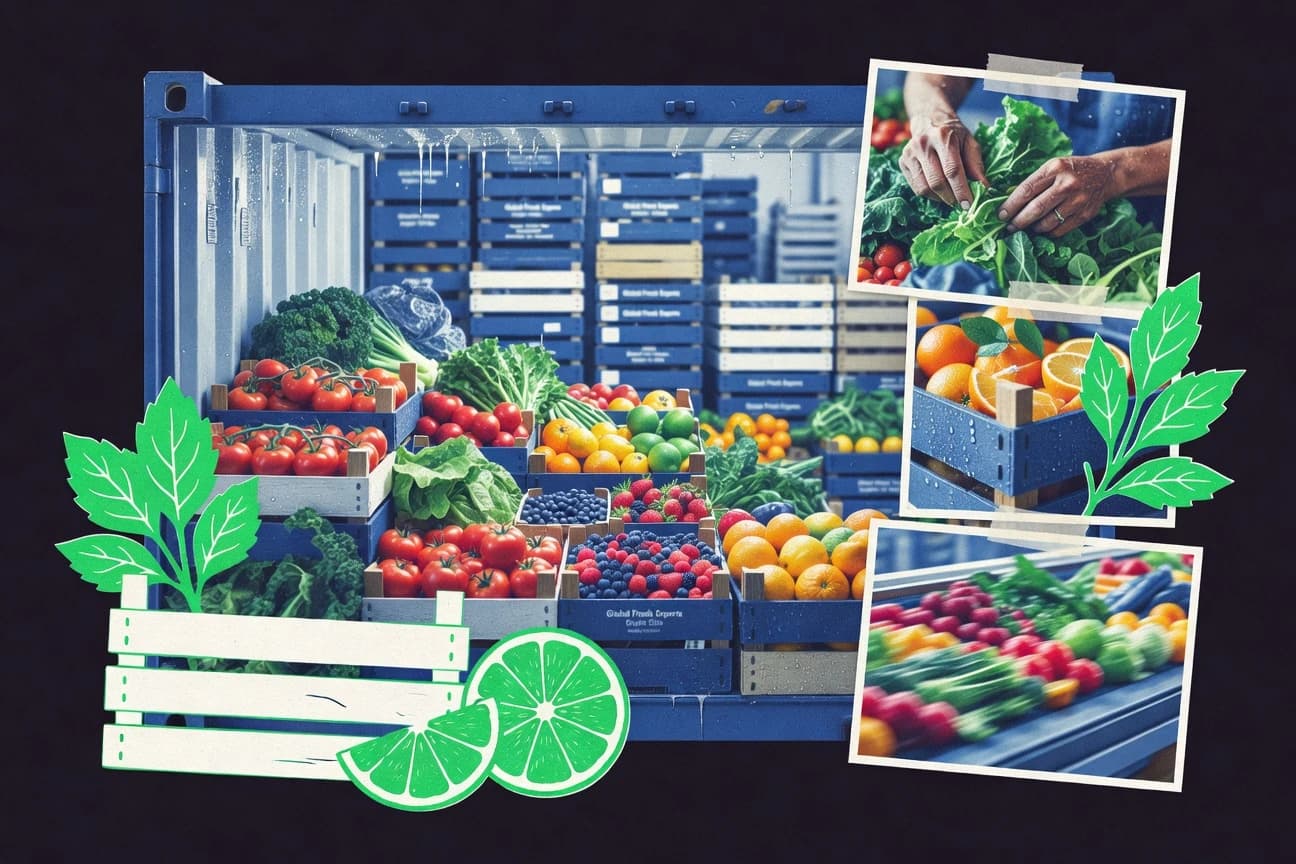
Top 10 Global Fresh Produce Industry Statistics
From a US$39.1 billion produce packaging market in 2023 to a US$1.9 billion traceability software spend, this page shows why fresh produce increasingly wins or fails on cold chain, compliant records, and faster recalls, not just harvest volume. You will also see where the real leakage happens, from the 15% of food lost between harvest and retail to consumption level waste, alongside the scale of global cold chain spend and refrigerated transport growth that keeps perishable supply moving.

Lobster Industry Statistics
U.S. lobster trade is anything but symmetrical with 2023 imports at $223 million yet exports reaching $1.62 billion, while China alone drove $1.09 billion of frozen and prepared lobster imports. You will also see the supply chain pressure behind the scenes, from cold chain costs and HACCP inspections to pricing swings and market growth projected at a 5.4% CAGR through 2032.

Grain Industry Statistics
See how Grain Industry performance is shifting with 2026 U.S. corn exports projected at 2.6 billion bushels and global wheat stocks tightening to 270 million metric tons by 2026. One set of figures points to growing outbound momentum, while the other hints at a tighter supply balance, creating the kind of tension that can move pricing and planning fast.

Down Feather Industry Statistics
See how the down feather industry is shifting in 2026, with trade and pricing signals pointing to real volatility rather than steady growth. If you think the story is just supply and demand, these key figures reveal where the margins and sourcing pressure are quietly moving.

Sod Industry Statistics
Sod Industry tracks how quickly the market is shifting, with the latest 2026 figures showing momentum in demand that looks nothing like the slower growth patterns many expected. Read the statistics page to see which regions and products are driving the change and where the biggest mismatches between supply and needs are emerging.
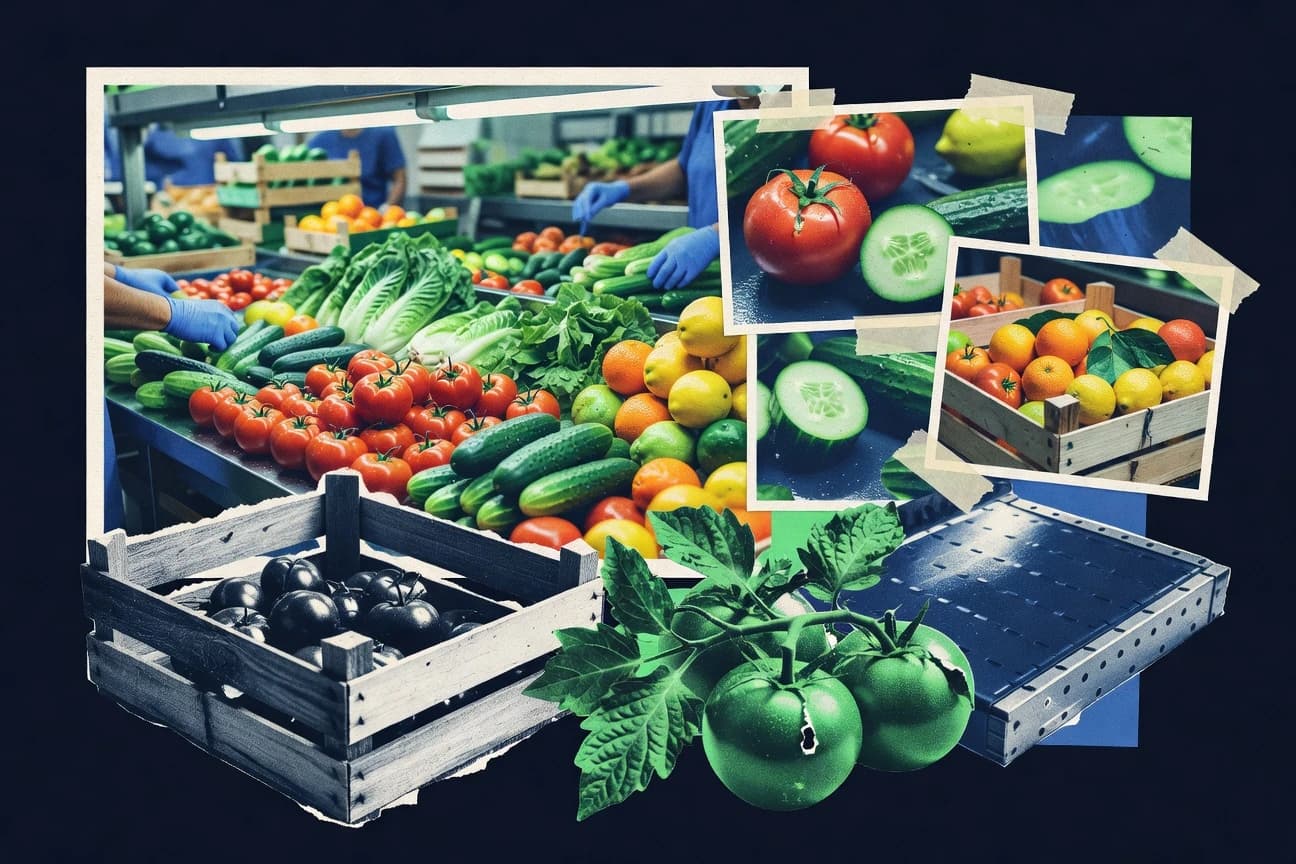
Fruit And Vegetable Industry Statistics
Track how Fruit and Vegetable Industry performance is shifting right now with the latest 2026 data alongside the big swings in production, prices, and trade that caught markets off guard. It’s a quick way to spot what’s staying resilient and what’s suddenly moving, so you can separate day to day noise from the trends that actually matter.

Philippines Coconut Industry Statistics
See how the Philippines coconut industry is shifting in 2026, with key production, processing, and market figures revealing what growers and processors can realistically expect next. The latest totals are sharp enough to challenge familiar assumptions about demand, pricing, and where value is concentrating across the supply chain.