GITNUX MARKETDATA
Browse Our Category
Agriculture Farming
Latest update:

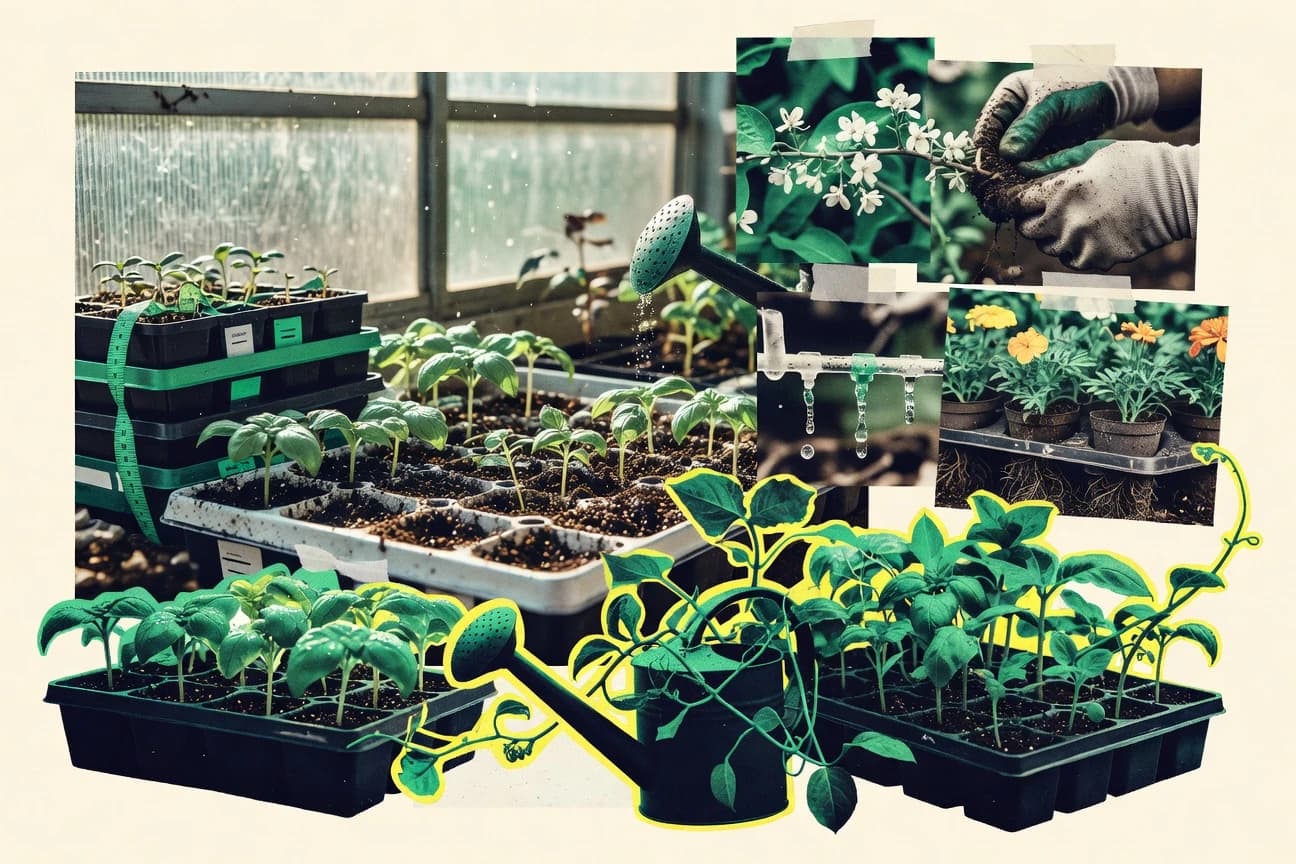
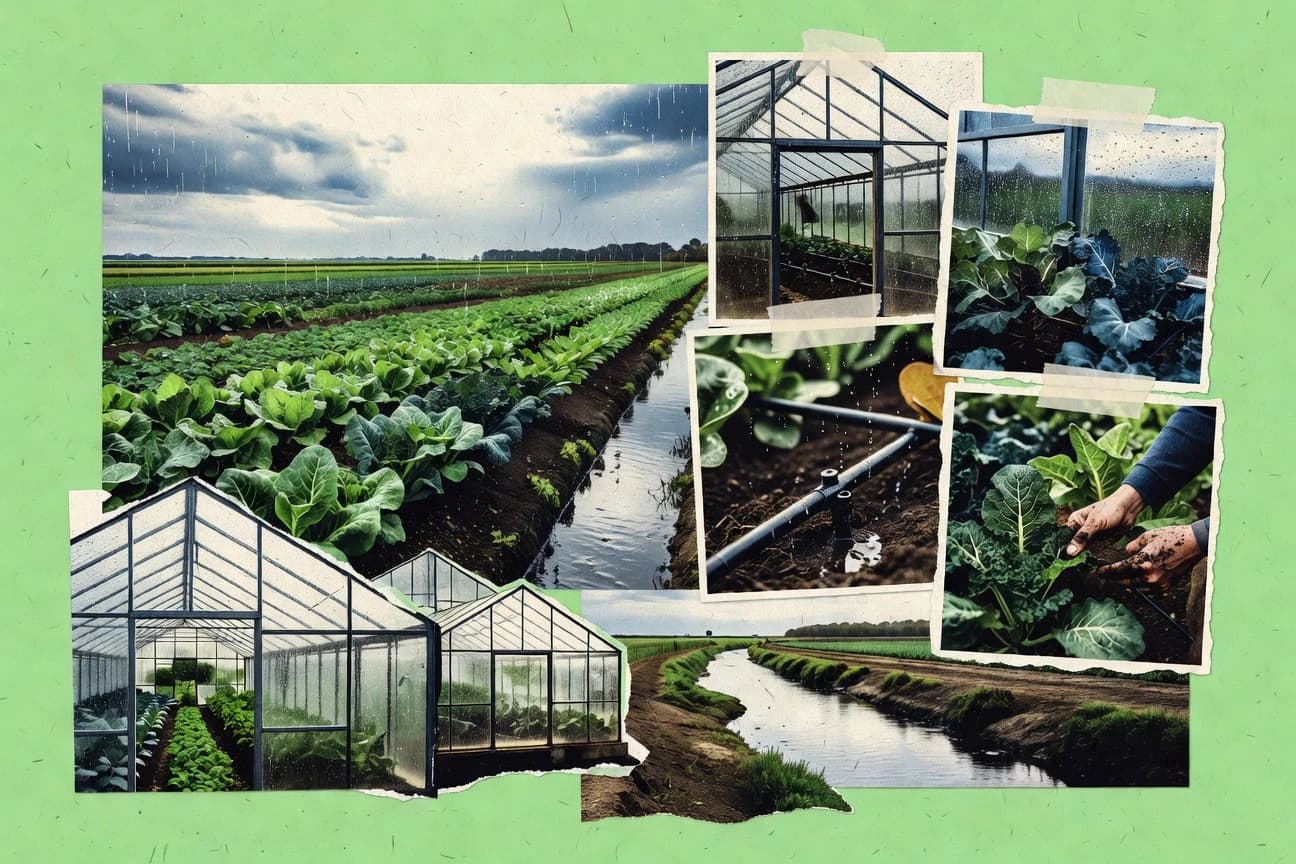
Horticulture Industry Statistics
Greenhouse and controlled environment agriculture are accelerating fast, with the global greenhouse market forecast to grow at a 3.9% CAGR from 2024 to 2034 and reach about $28.7 billion by 2034, while growers push for practical gains like up to 50% water savings from drip irrigation and 20 to 40% less irrigation with root zone moisture sensors. The page also weighs how biologicals, beneficial insects, and circular substrates are reshaping inputs and yields, from $2.2 billion of biological pesticides sold in 2023 to a 20 to 60% drop in substrate environmental impact, so you can see where horticulture is spending and where it is saving.

Mushroom Industry Statistics
See how 2025 mushroom industry production and trade figures reveal a fast-moving pivot in where mushrooms are growing and selling. If you track pricing, supply, or export opportunities, the 2026 signals in these statistics are the difference between planning and guessing.
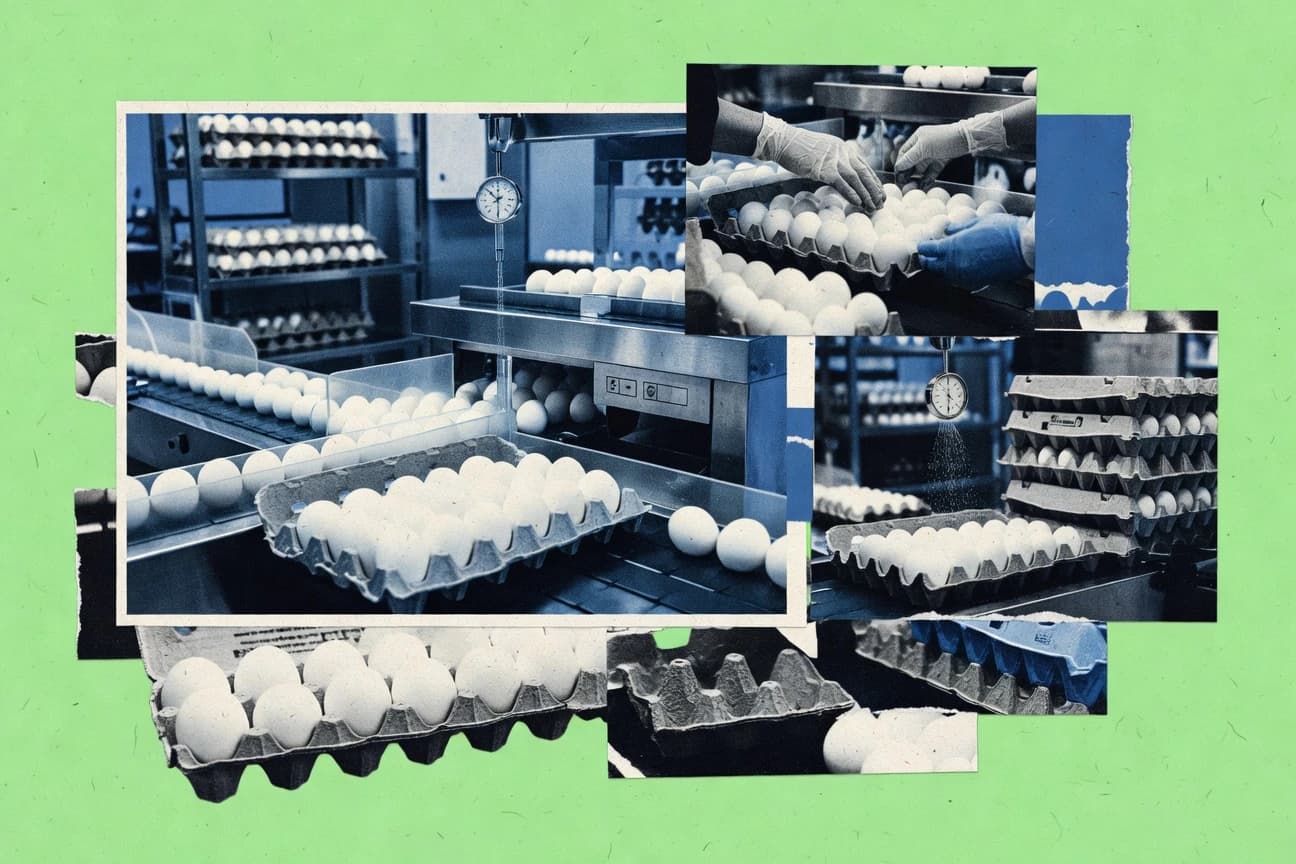
Taiwan Egg Industry Statistics
See how Taiwan’s egg industry is shifting with 2026 snapshot numbers that reveal where production and market pressure are tightening or easing. One glance at the latest figures helps you understand why the egg supply story is not just about volume but about fast moving costs and output decisions.

Houseplant Industry Statistics
Houseplant Industry’s latest stats reveal how dramatically buying habits are shifting, with 2026 figures pointing to a new center of gravity in demand. See what’s driving the change from where sales growth used to come from to what shoppers now prioritize, and why that matters for growers, retailers, and brands.
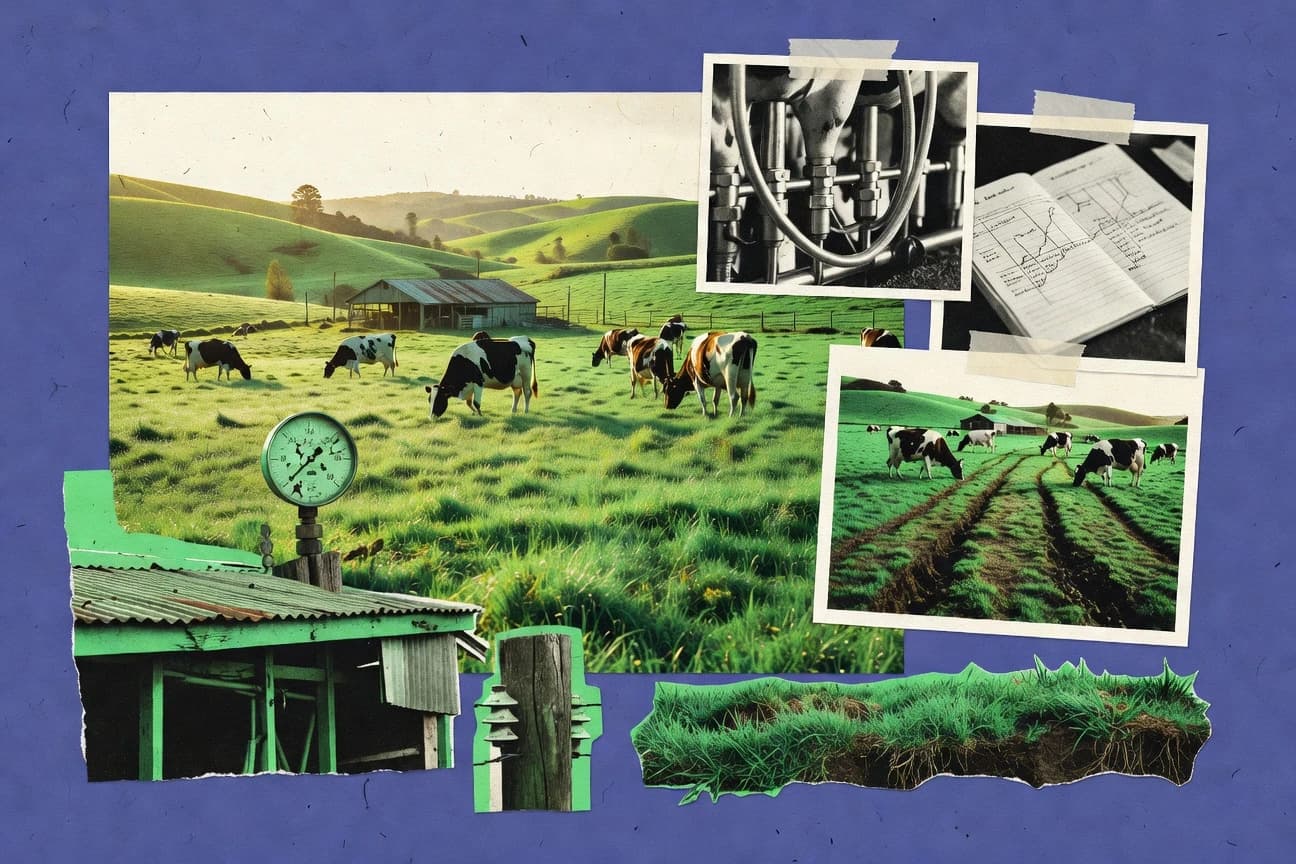
New Zealand Dairy Industry Statistics
Even with dairy’s 6.2% share of New Zealand’s export earnings in 2022, it still outshines every other category and sits at the centre of climate and water debates, from 31.2 Mt CO2-e agricultural emissions in 2021 to the way Canterbury’s irrigation schemes largely serve dairy regions. Track how farmers and processors move nutrients, energy and products through the system, including 94% effluent storage use and trade flows that send whole milk powder and China-bound dried milk equivalents at scale.

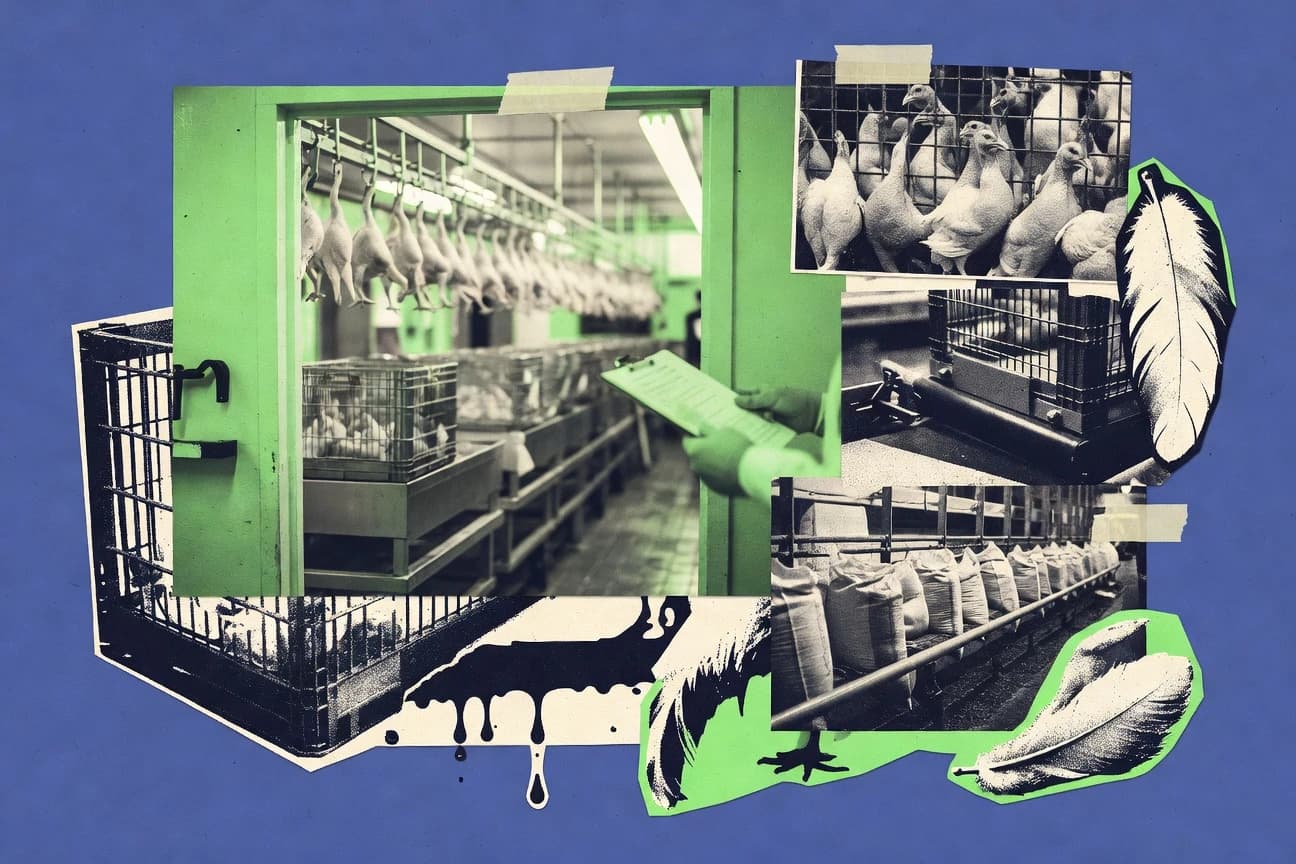
Factory Farming Animal Cruelty Statistics
From manure and ammonia to land use and embedded fossil energy, factory farming links cruelty to climate and public health in measurable ways, including manure at about 4% of global greenhouse gas emissions and an energy footprint where food systems contribute about 30% of total anthropogenic greenhouse gases including land use change. It also exposes how scale normalizes harm, with 77% of global birds farmed for meat or eggs and studies finding pervasive welfare and contamination risks across broilers, sows, and waterways.
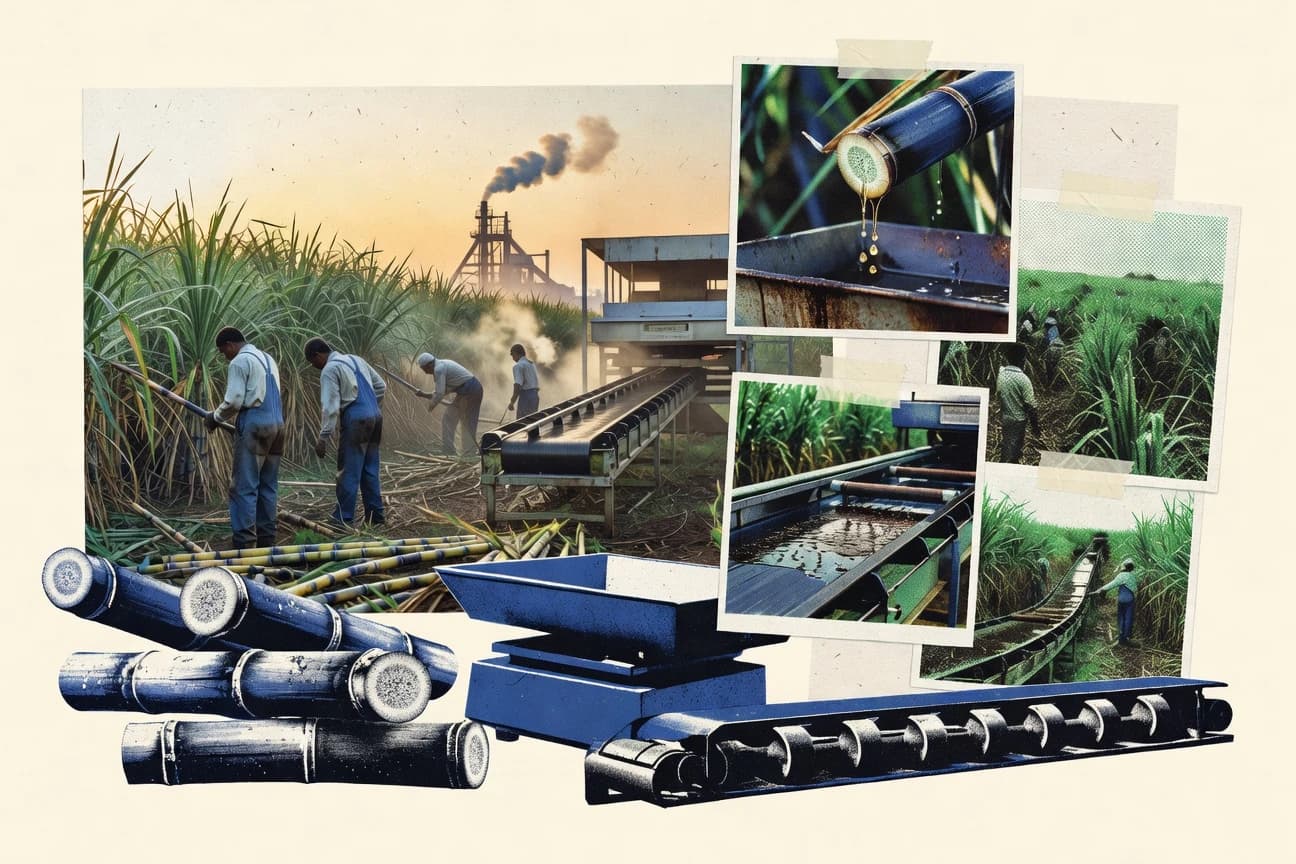
Brazil Sugar Industry Statistics
Brazil Sugar Industry data for 2026 shows how quickly the balance is shifting between sugar production, domestic use, and export demand, with the latest figures testing whether growth is broad based or concentrated in a few months. Get the hard numbers behind the trend that matters most for mills, traders, and investors as the market tightens and prices react.
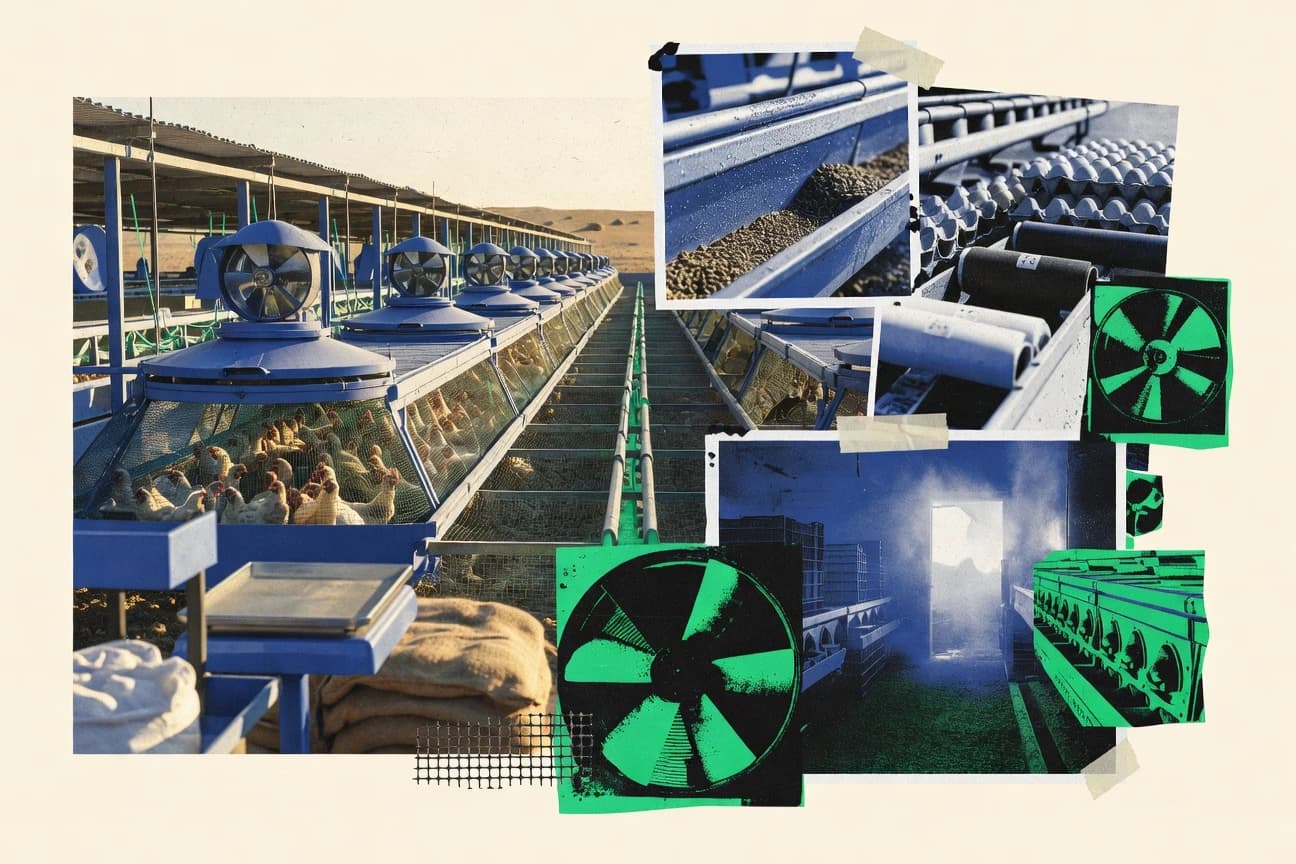
Saudi Poultry Industry Statistics
Saudi Poultry Industry stats reveal how quickly the sector’s feed and production realities are shifting, with the newest 2026 or 2025 figures putting growth and cost pressure side by side. It is the kind of contrast that helps you see where demand is tightening and where capacity is actually keeping up.

Cut Flower Industry Statistics
With 6.7 million metric tons of global cut flower output and 3.3 billion stems moving through Aalsmeer in 2023, the page tracks what scale looks like in practice, then flips to what it costs when postharvest biology and cold chain go wrong, including losses that can reach 30 to 40%. You will also see how shipping choices and modern monitoring, from air freight versus sea to IoT temperature checks, can swing both vase life and logistics CO2, plus what buyers and consumers are actually pulling off shelves for home décor, weddings, and events.
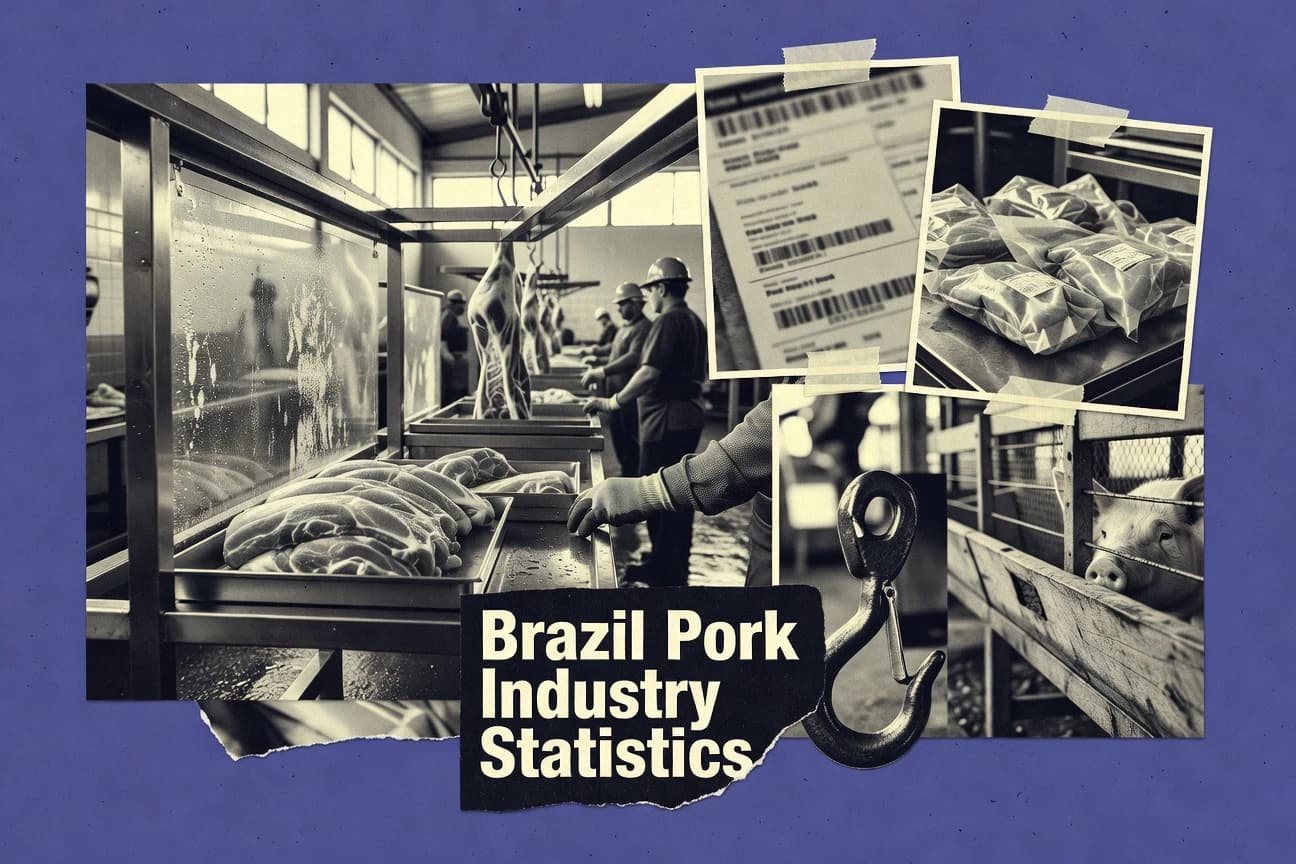
Brazil Pork Industry Statistics
With soybean meal output surpassing 40 million tonnes and corn production around 125 million tonnes, this Brazil pork stats page shows how 2023 export value of US$ 1.62 billion can swing just as fast as corn price volatility hits pig feed costs. It also connects fast ASF-related throughput drops, MAPA governed disease controls and SIF inspection capacity, and even EU RASFF scrutiny, to the operational reality behind processing margins and biosecurity.
Netherlands Agriculture Statistics
See how Netherlands agriculture is shifting right now, with the latest figures showing what changed from farm output to land use. One snapshot makes the tension clear: growth in some areas is matched by pressure elsewhere, and the newest numbers explain where the balance is tipping.

Flower Industry Statistics
A 2.93% year over year lift in global flower and ornamental plant trade value in 2023 signals growing momentum, even as cut flower quality can still be lost in the first 24 to 48 hours without the right cooling and 1 to 3°C storage discipline. This page connects the big market figures and trade volumes to the practical bottlenecks that shape costs, margins, and sustainability demands for growers, florists, and retailers.
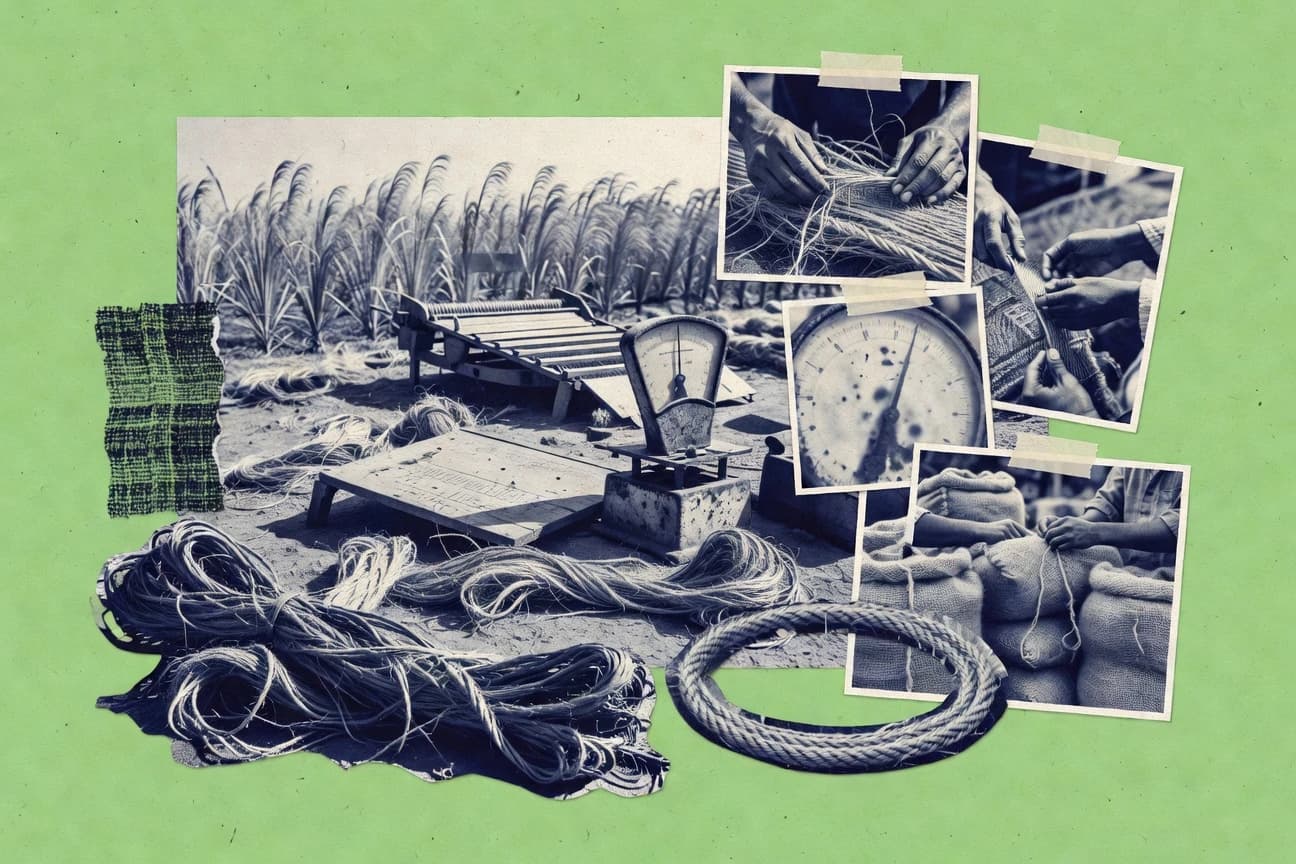
Jute Industry Statistics
With jute demand holding steady in 2025 despite cost pressure, this statistics page pinpoints exactly what kept buyers and mills moving when other natural fibers stumbled. You will see the latest production and trade shifts side by side so the next move in jute sourcing becomes clearer, not just louder.

Factory Farming Statistics
Food systems drive 33% of all human made greenhouse gas emissions and livestock account for 14.5% of global emissions, while 74% of agricultural land is tied to animal feed and grazing. Trace how that climate and land footprint connects to antibiotic resistance and biodiversity loss across industrial supply chains, from EU growth promotion bans and tightened antimicrobial monitoring to the scale of beef, poultry, and aquaculture production and markets.
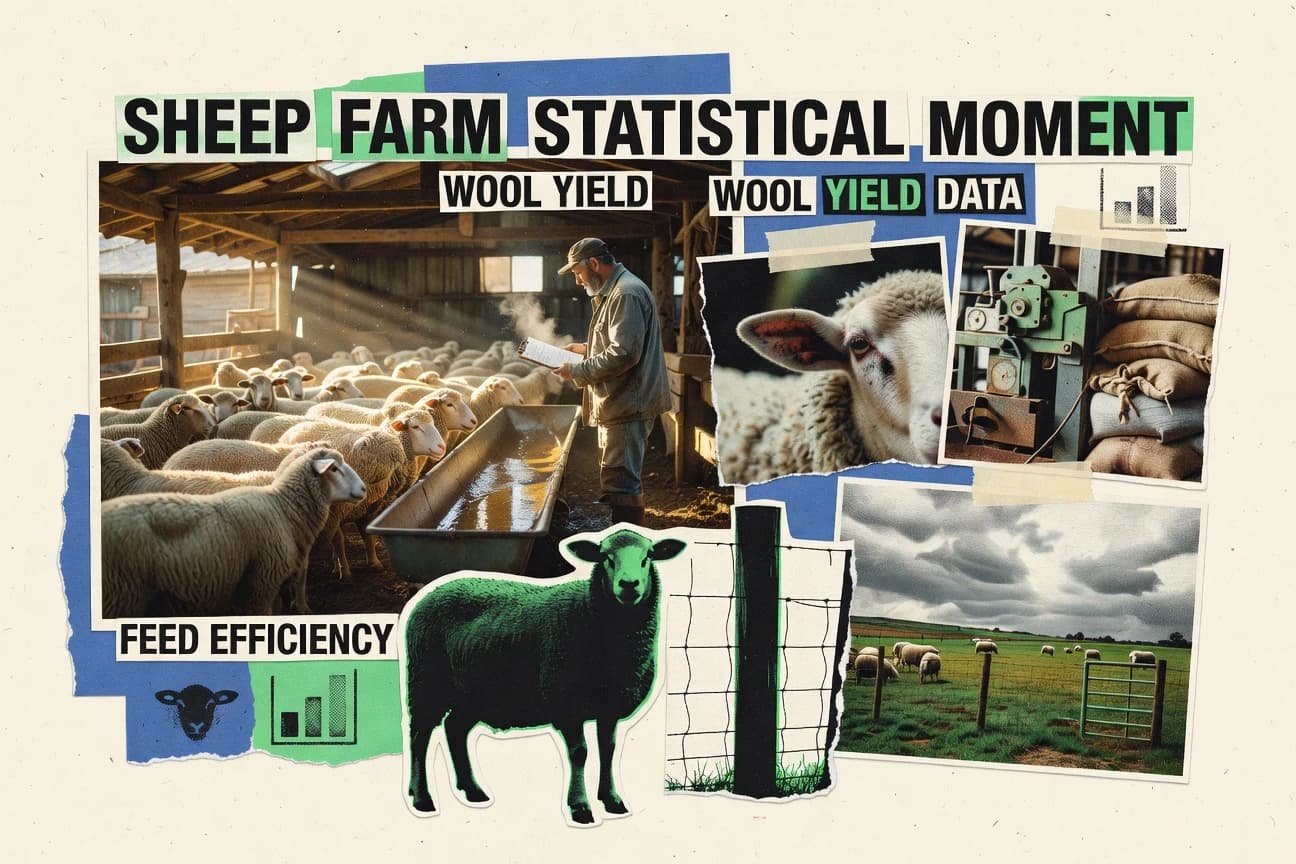
Sheep Industry Statistics
With 2026 turnout in mind, this Sheep Industry statistics page pinpoints what is changing in flock size, production, and market pressure, not just what used to be true. See where the gains are holding and where they are slipping so you can spot the next shift before it shows up on the books.
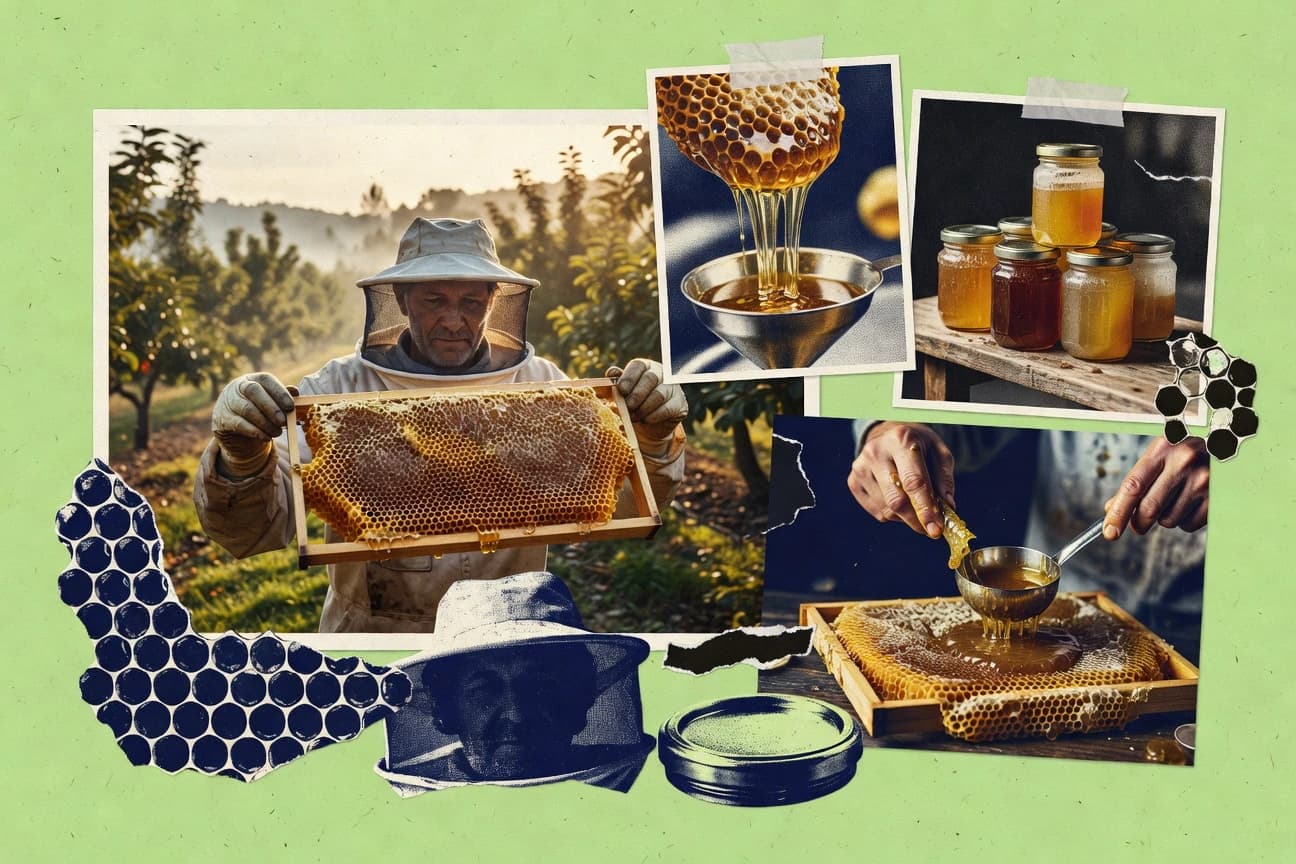
New Zealand Honey Industry Statistics
With New Zealand honey production and export performance shifting fast, the 2026 figures bring a sharper picture of what is changing across season by season demand and market reach. This statistics page connects the latest volume, trade, and farm level signals to explain why some buyers are leaning in while others are watching closely.
Us Poultry Industry Statistics
U.S. poultry margins get shaped by hard tradeoffs, from a 0.17 average 2023 retail price for chicken breast and 18% of farm operating costs tied to labor, to the steady push for automation that cut broiler processing time per bird by 5.4% in 2023 pilot programs. See how safety and traceability are changing the workflow too, including a 46% share of processors upgrading chillers and a 15% blockchain traceability adoption rate, alongside global indicators like 3.9% projected consumption growth through 2030.
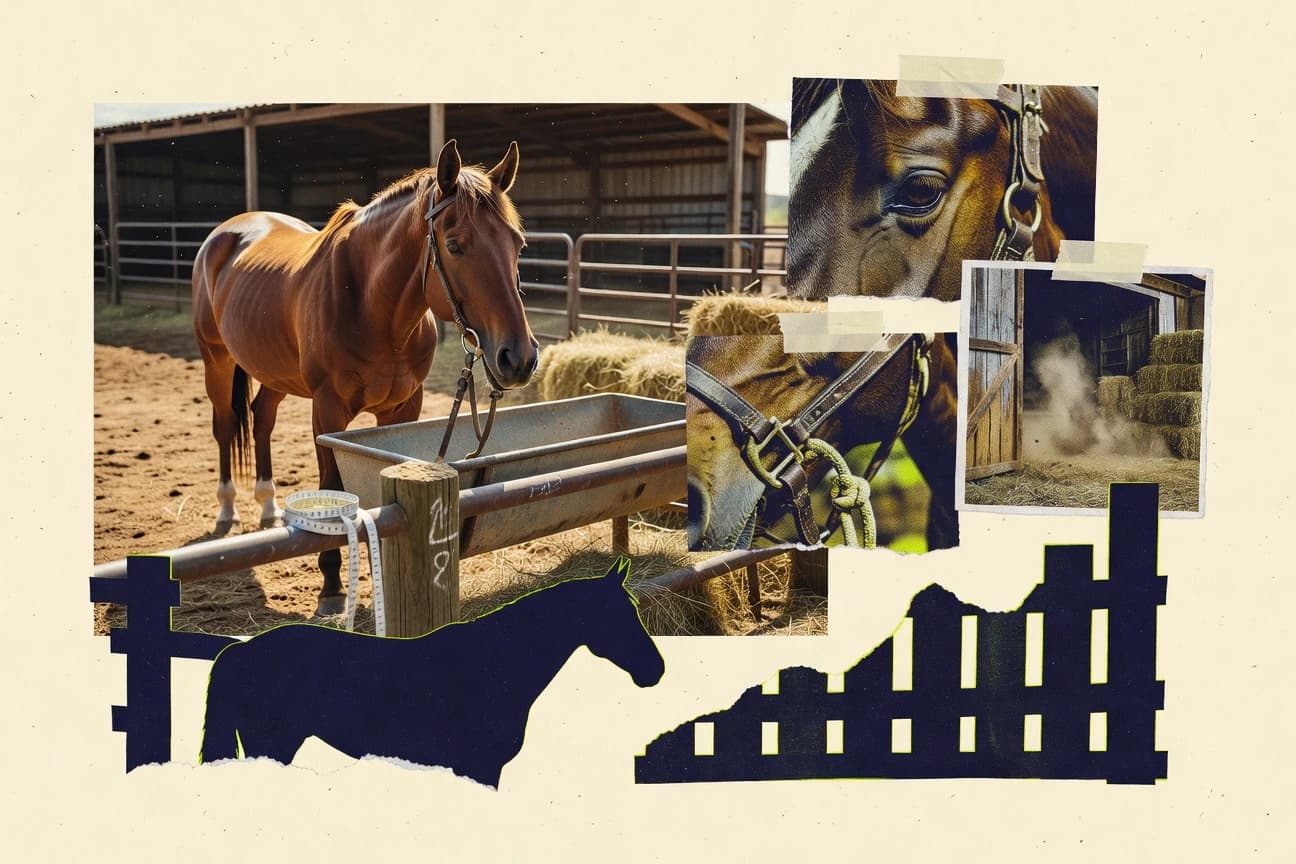
Horse Industry Statistics
How big is the horse economy when you add what’s on the ground plus what it takes to keep horses healthy and moving. The U.S. horse industry generated $122 billion in total output in 2017 and supported 1,067,000 full-time equivalent jobs, with owners spending $6.7 billion on board and $1.4 billion on veterinary and medical.
Brazil Poultry Industry Statistics
Brazil’s chicken output is still massive at 14.2 million tonnes in 2023 while exports climbed to 4.6 million tonnes and the world’s top export role sharpened with a trade surplus in poultry meat of about US$9.7 billion. You will also see how per capita consumption reached 13.9 kg alongside the scaling machine of 1,858 federally inspected plants and broiler slaughter of 14.8 billion birds, plus what turkey production and feed, disease, and integration dynamics mean for tomorrow’s demand.
Korea Dairy Industry Statistics
With 3.48 million tons of forecast raw milk production for 2024, South Korea is edging higher while consumption is forecast to reach 3.36 million tons milk equivalent, tightening the gap that imports still help fill. Track how 91,000 dairy farms feed a system driven by milk quotas, factory collection and HACCP, plus what that means for retail prices, dairy imports, and everyday demand from drinking milk to yogurt.