GITNUX MARKETDATA
Browse Our Category
Agriculture Farming
Latest update:

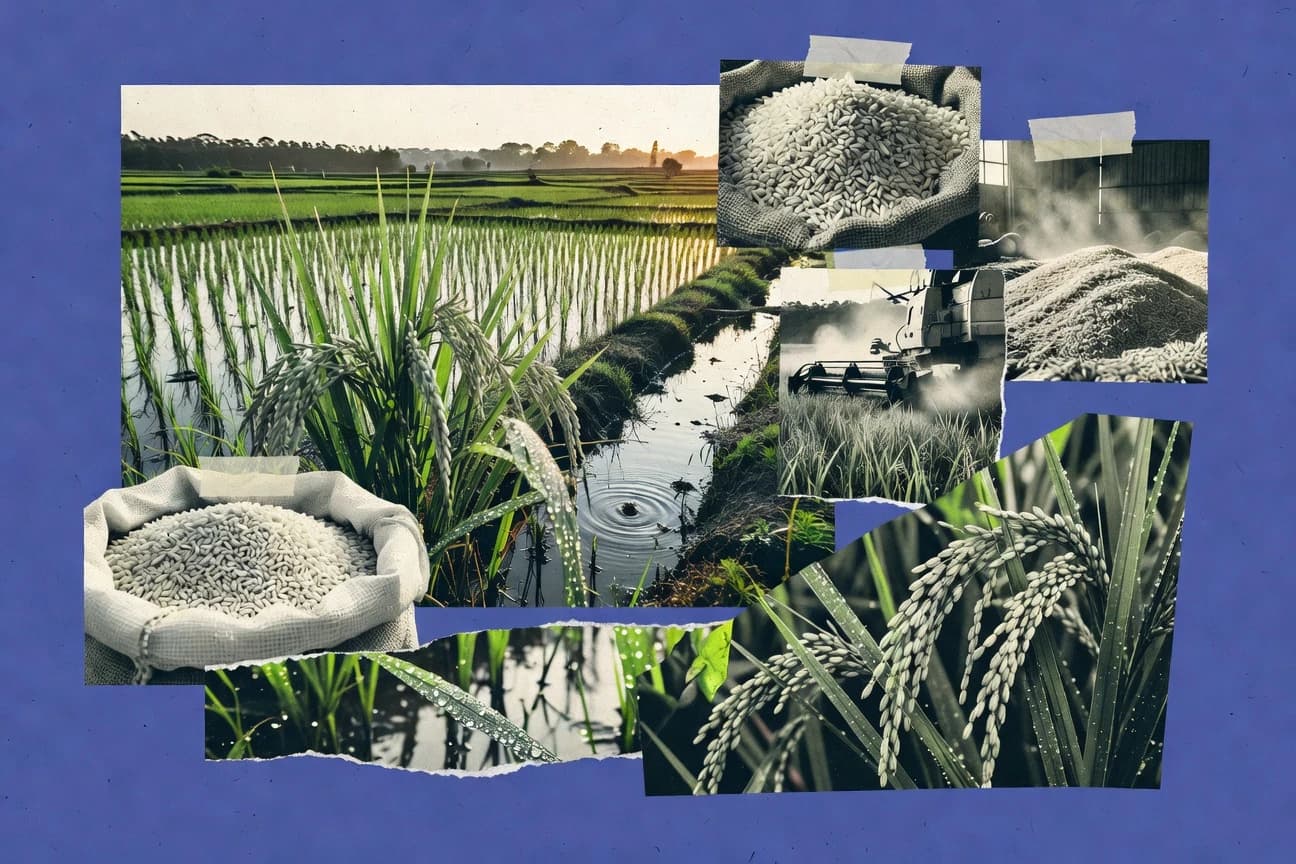
Rice Industry Statistics
Global rice yield sits at about 4.5 metric tons per hectare while methane and water pressures remain central, with rice cultivation responsible for roughly 10% of anthropogenic CH4 and improved water management cutting emissions by 30 to 50%. Track how demand and constraints meet, from a projected 154 million metric tons of stocks by 2030 to regulatory and mechanization realities that shape costs, safety, and food reliability for 3.5 billion rice eaters.

Bamboo Industry Statistics
Bamboo can regrow from its rhizomes and be harvested repeatedly for many years, and the industry numbers behind that staying power are moving fast, from a $5.2 billion global bamboo shoot market in 2022 to a forecast reaching $89.3 billion for bamboo products by 2027. You can also compare the material side and the climate side at once, from up to 91 cm of peak daily growth and fiber and board performance ranges to life cycle and carbon sequestration findings that often outperform conventional substitutes under the right boundaries.

Kelp Industry Statistics
The kelp industry is growing fast and already sits at the center of global value, with seaweed demand forecast at a 6.0% average annual growth rate through 2031 and hydrocolloids like alginate and carrageenan driving a big share of that upside. You will also see what matters beyond tonnage, including how kelp systems can cut nitrogen by double digit percentages in integrated trials and why processing energy and pricing grades can swing ingredient costs from one batch to the next.

Forestry Industry Statistics
With global wood products trade topping $250 billion in 2022 alongside forestry employment reaching 13.5 million people in 2020 and industrial roundwood production hitting 1.92 billion cubic meters in 2022, this page connects forests to real economic weight. It also puts 2025 readers in the drivers seat by pairing GDP and export scale across countries, from Vietnam’s 2022 forestry GDP share of 1.2% and $14 billion in wood products, to Sweden’s SEK 400 billion turnover, so you can spot which parts of the supply chain are powering growth and which are under pressure.
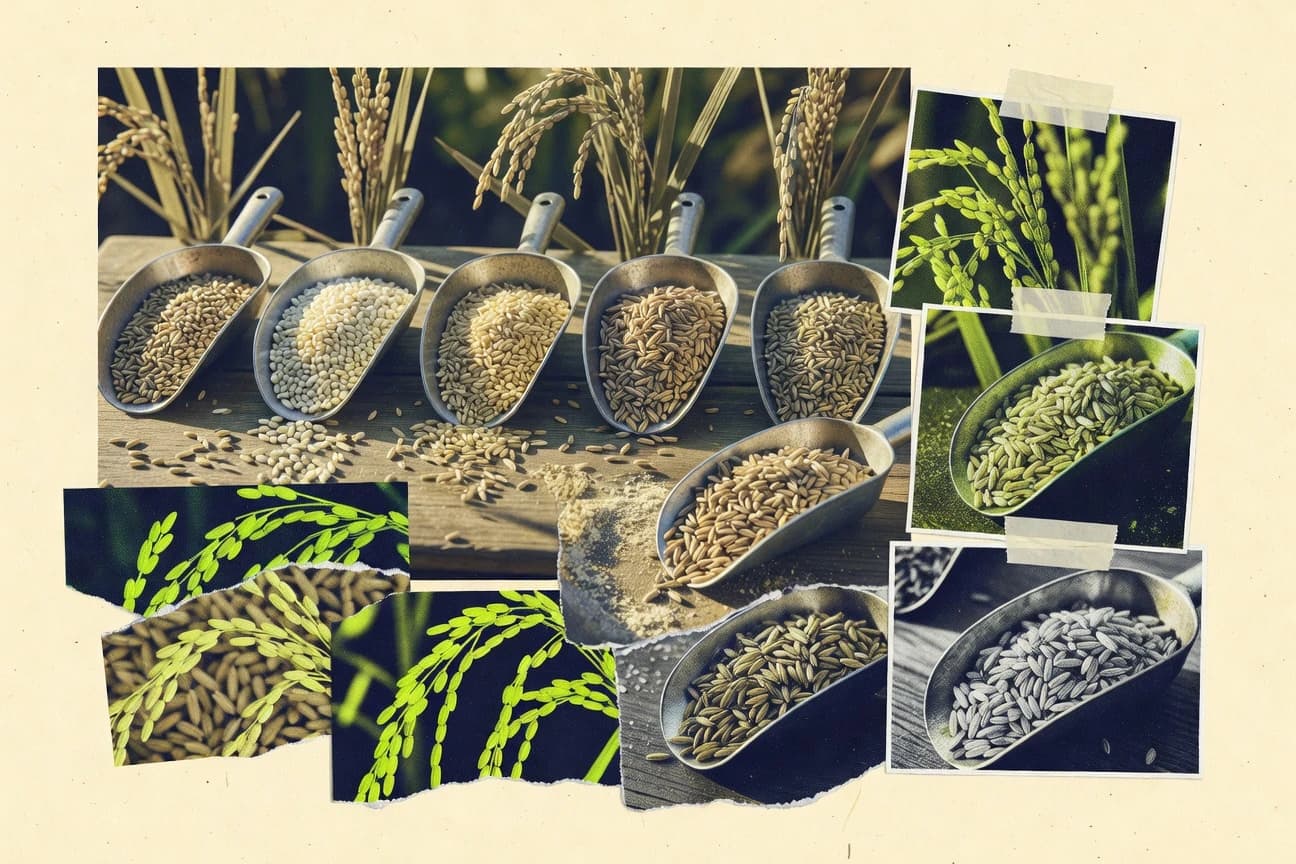
Rice Diversity Statistics
Rice’s newest diversity statistics bring admissions, outcomes, and campus composition into one place, from international representation that peaks at 28.1% among graduate students to undergraduate acceptance sitting at just 8.7% in Fall 2023. You will also see how persistence and completion hold steady across groups, including a 98.1% Hispanic first to second year retention rate and a 92.3% six year graduation rate for Black undergraduates.

Bee Statistics
Honey is big business and it is also tightly bound to bee stress and pest control, with New Zealand producing 1.6 million kilograms in 2023 and the Varroa destructor mite linked to 76% of colony health declines in European apiaries. Temperate crop pollination relies heavily on managed honey bees, yet heat stress risk rises as global temperatures climb by 1.5°C and only 4.8% of EU beekeepers adopted mite monitoring devices in 2021, making the gap between what is known and what is practiced feel urgent.
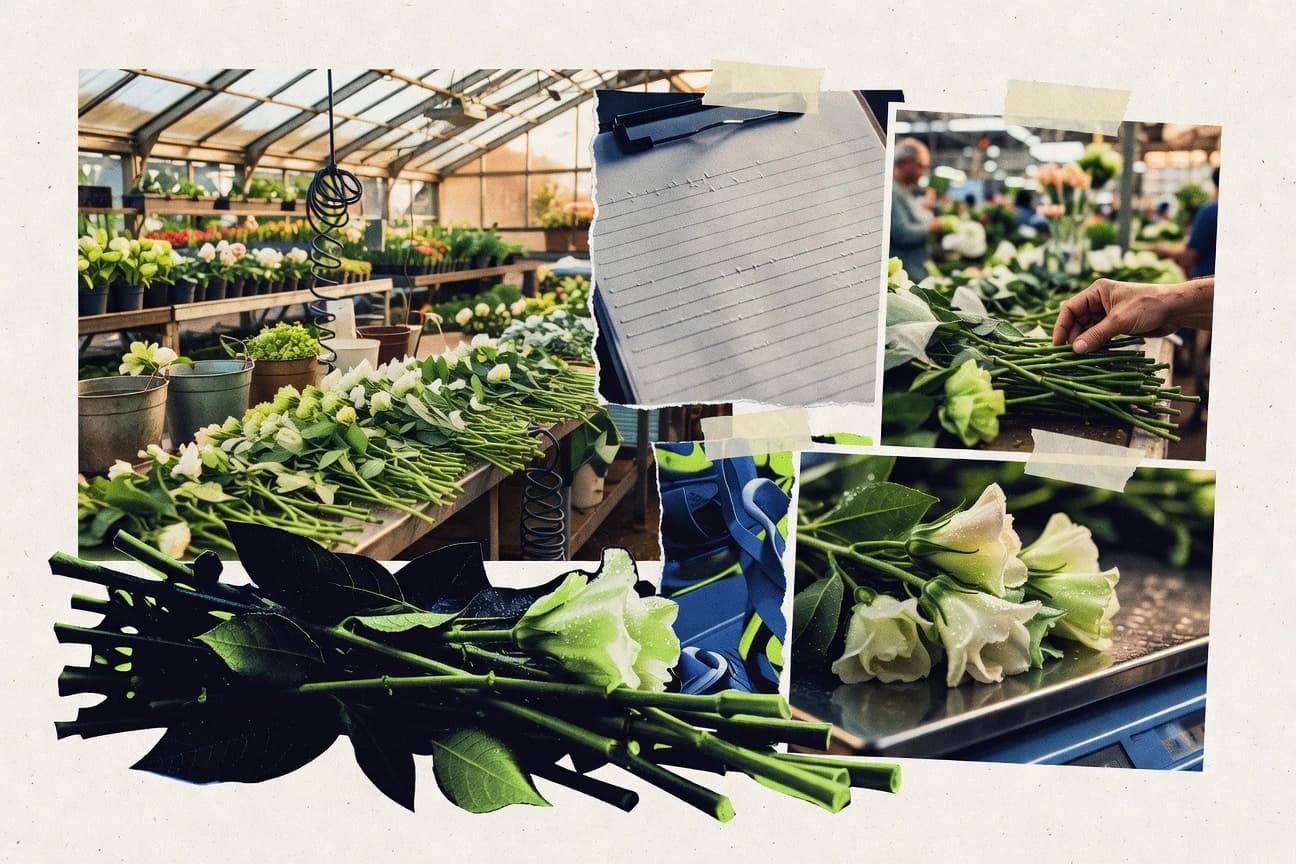
Floral Industry Statistics
With global indoor plants valued at $2.0 billion in 2023 and hydroponic floriculture projected to reach $2.4 billion in 2024, this page tracks what is really driving profitability versus volatility from auction price swings to electricity costs that consume 30% to 40% of greenhouse budgets. It also connects production choices like IPM and biosecurity, plus postharvest controls that cut losses and boost vase life, to buyer behavior and delivery expectations where 60% of B2B orders use digital platforms and only 18% of floral sales go same day or next day.
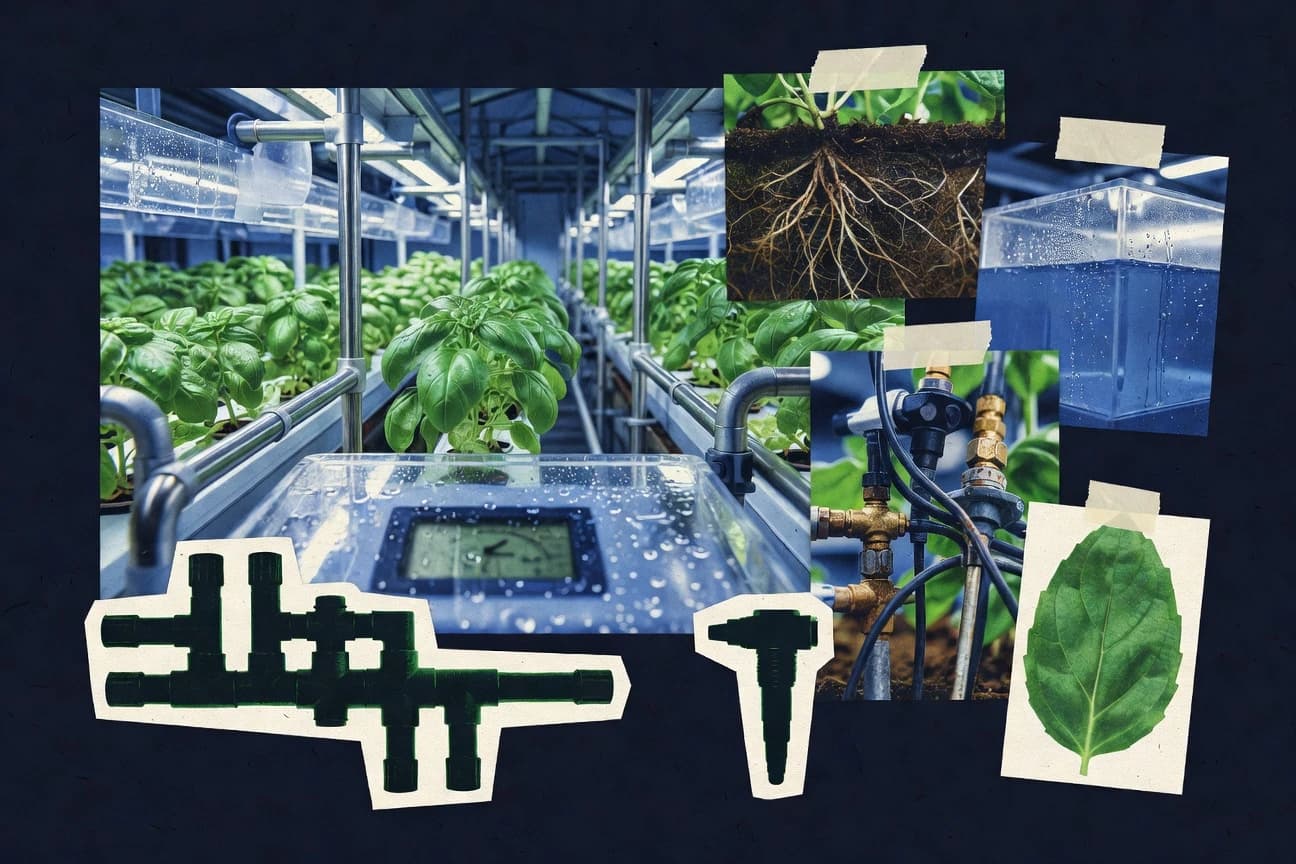
Hydroponics Industry Statistics
Hydroponics is moving from niche to infrastructure fast, with 60% of global vertical farms now using hydroponic systems and China operating 50,000+ hydroponic facilities as of 2023. This page connects those growth signals to the payoff, from 90% less water use and 30 to 50% lower long term operating costs to yield jumps that can turn lettuce into 200 heads per m² annually, alongside country snapshots from Singapore’s 2030 hydroponics mandate to Israel’s 18% adoption rate.
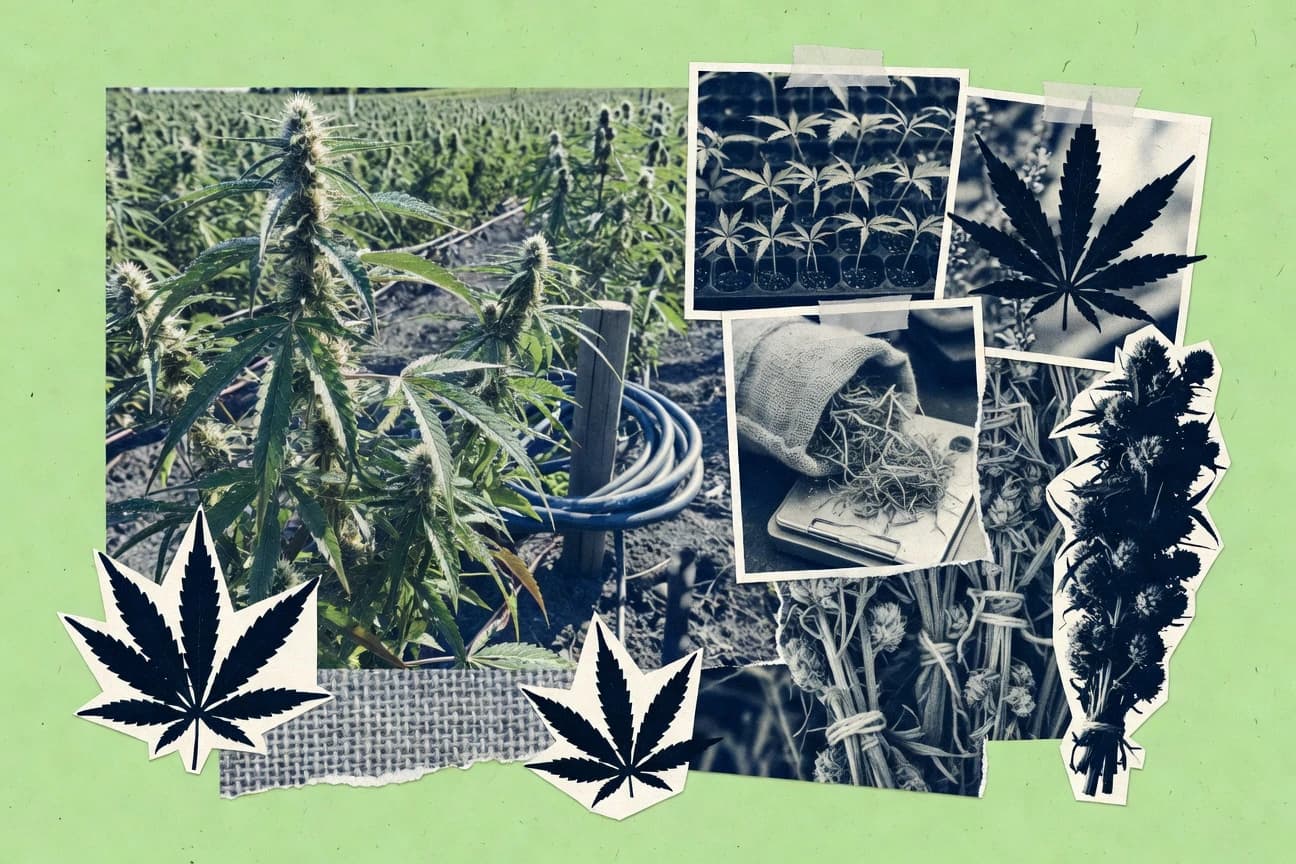
Hemp Industry Statistics
Expect growth on a big scale as the global hemp market is projected to reach $7.8 billion by 2030, while fiber and cannabinoids keep pulling demand higher. See how the economics and compliance story clash and align, from a global harvested area of about 0.7 million hectares in 2022 to seed, insulation, and building product markets that are reshaping inputs, exports, and regulation.
Malawi Agriculture Statistics
Malawi’s agriculture is mostly smallholder driven but surprisingly resource-constrained, with arable land under cultivation shaped by low credit access and rising input demands. See how fertilizer use climbed to 22 kg per hectare by 2022, yet only 30% of maize area uses improved seed and many households still face shocks, from 20% maize post-harvest losses to floods and soil degradation.
Gmo Statistics
From $186 billion in global farm income gains to global GMO seed sales reaching $25 billion in 2022, this page tracks how traits like Bt and herbicide tolerance reshaped yields, costs, and farm risk from field to food. It also weighs the science and approvals side with 550 trait approvals by 2022 plus a surprising sustainability payoff such as GMO crops reducing pesticide use by 776 million kg from 1996 to 2018.
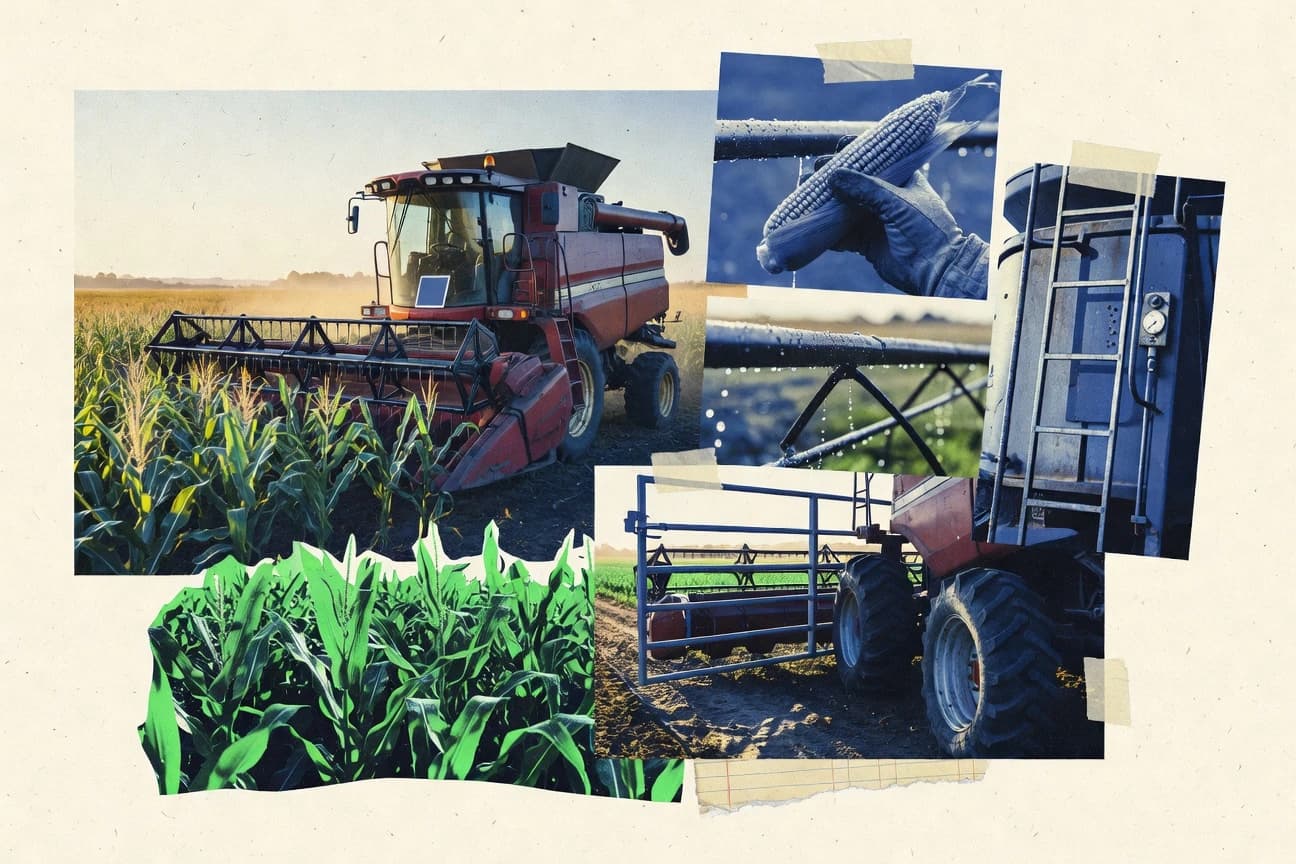
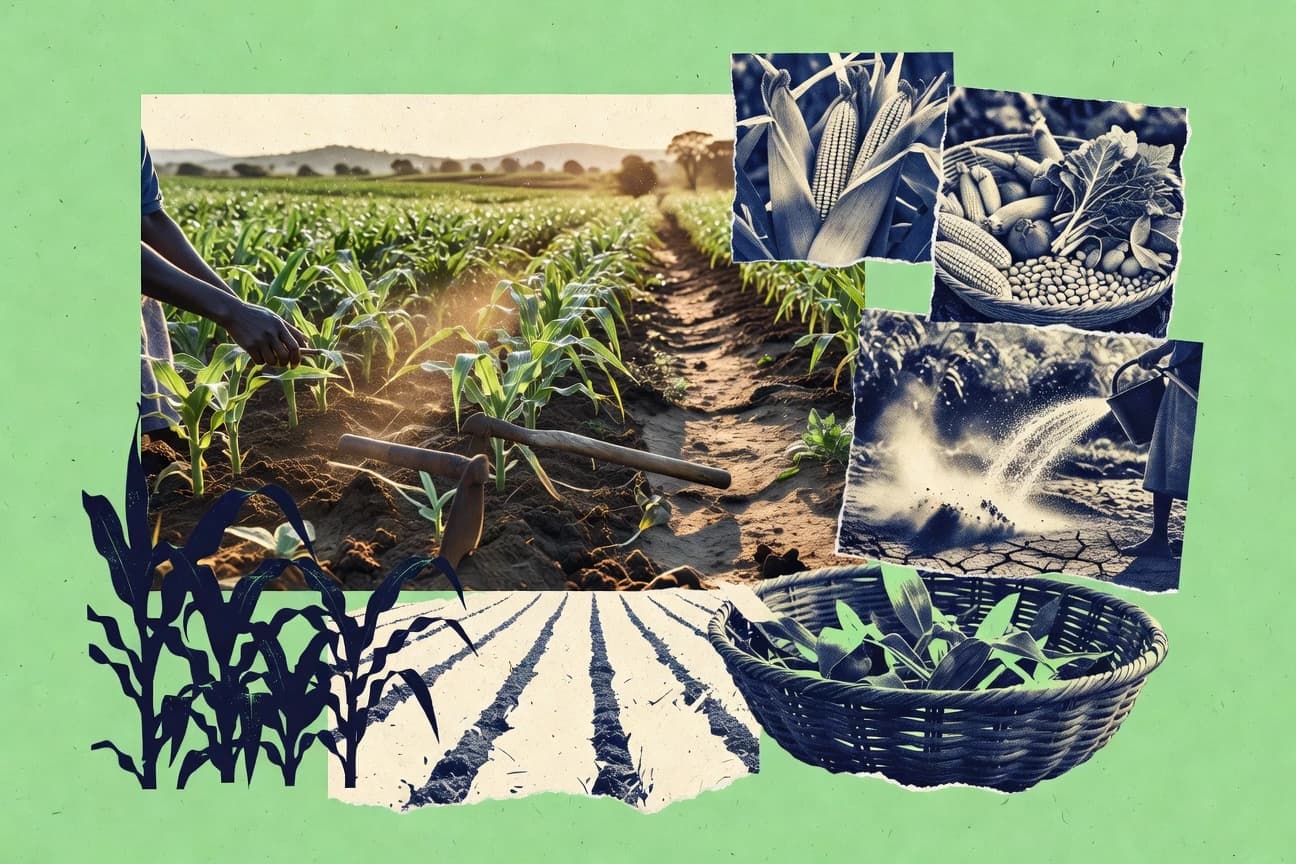
Farm Industry Statistics
Crop insurance and conservation are reshaping what farm risk looks like right now, from 280 million acres insured and 75% of policies covered by multiple peril to 27 million acres enrolled in CRP. Meanwhile, the pressure points are just as visible, with 1.9 million U.S. farms classified as small and food systems tied to 3.8 billion metric tons of CO2 equivalent in 2019, set against median farmworker wages of $16.20 per hour and 1.5 billion people facing moderate or severe food insecurity.
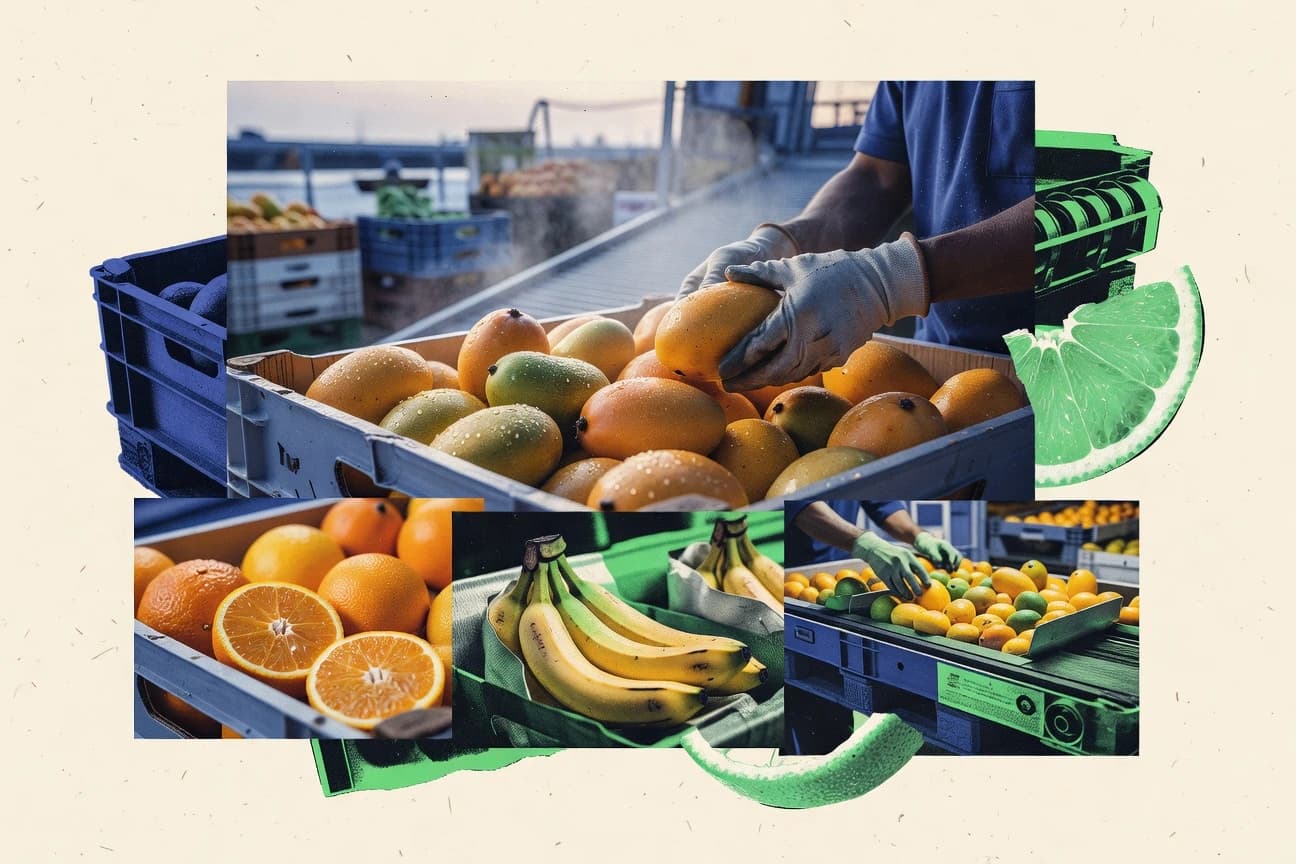
Global Fruit Industry Statistics
Cold chain limits and rising shipping costs shape what actually reaches shoppers as fruit losses hit 3.0% before market and retail accounts for 14% of global food losses, even as the banana market reached about US$30 billion in 2023 and avocados reached about US$14 billion. Follow the pressure points from HS 0805 citrus imports into the EU and pest-monitoring realities to packaging and storage technologies that can extend shelf life for months, with food systems driving roughly 34% of global greenhouse gas emissions.
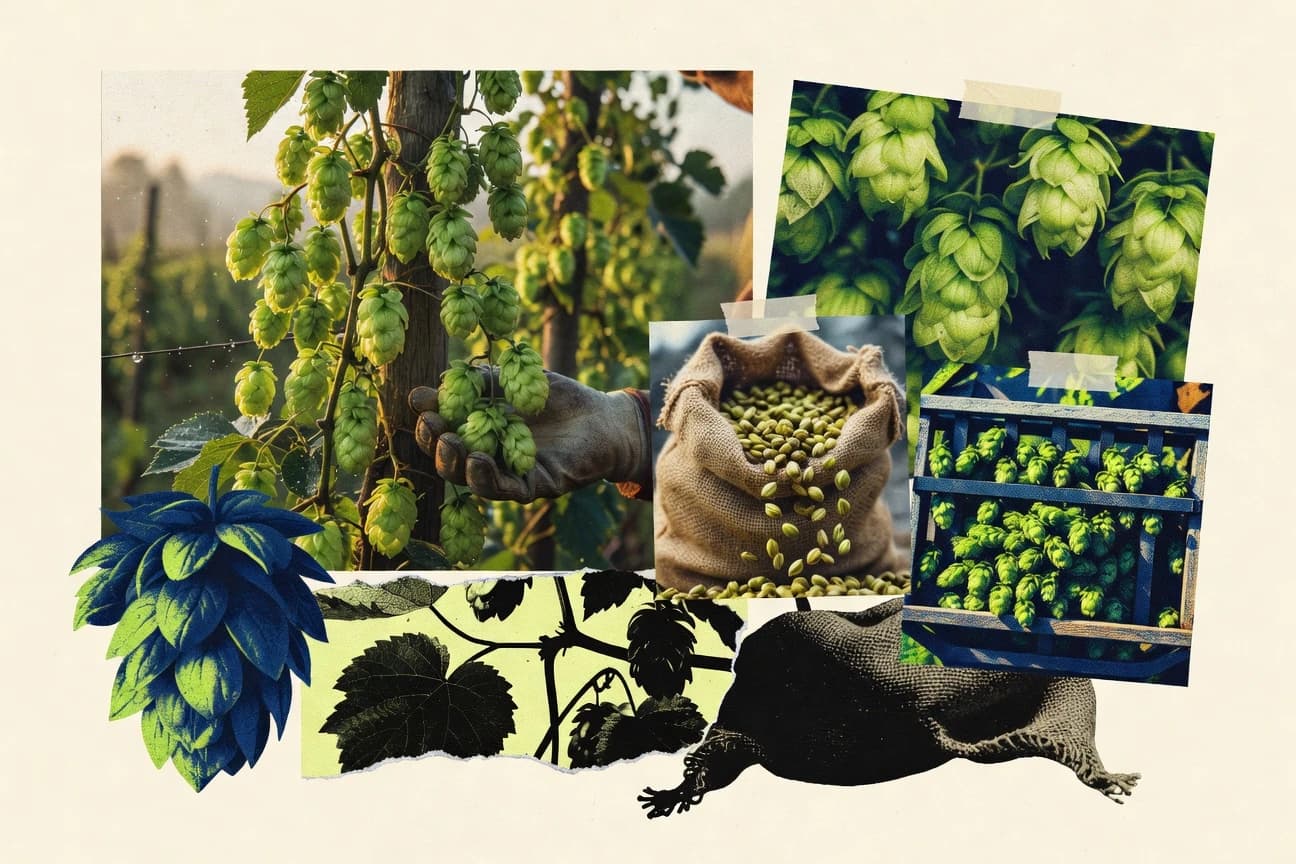
Hops Industry Statistics
With the U.S. beer market estimated at $19.0 billion in 2023 and craft pulling demand toward higher hop-rate styles like IPA, this page connects what happens in the kettle to where the hop dollars go, from 70% to 80% of hop bitterness potential coming from isomerized iso-alpha acids to how pellet storage stability and alpha acid losses can swing utilization and IBU targets. You will also see why the hop market is forecast to keep growing through 2030 while regional supply and trade signals, including an $8 plus billion by 2030 analyst view and barley logistics pressures, reshape ingredient costs long before the first boil.
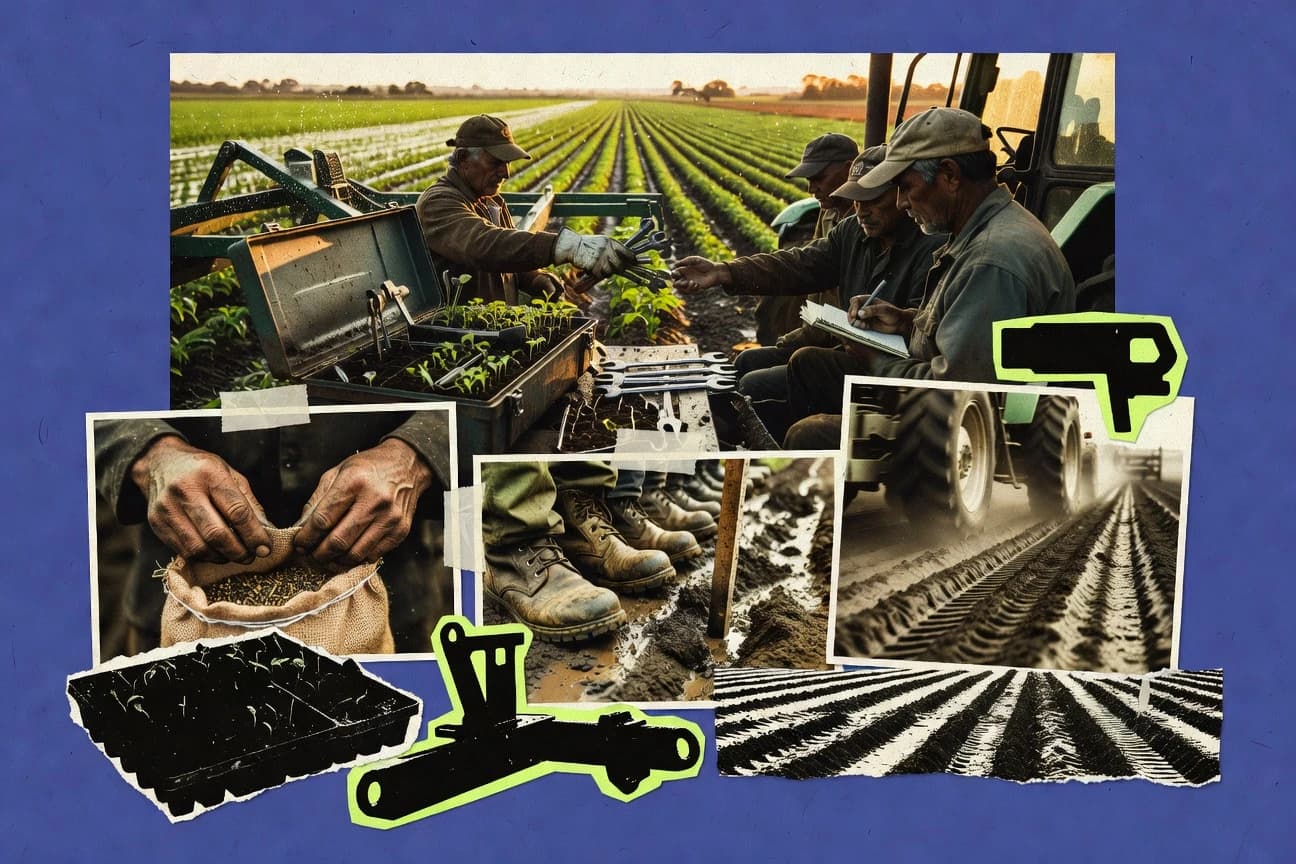
Agriculture Employment Statistics
With 47% of the agricultural workforce being women yet far fewer getting training and extension support, and global informal work still dominating employment in lower middle income countries, this page explains where agricultural jobs are expanding and where people are being left behind. You will also see how falling farm employment shares, youth and productivity shifts, and the fast rise of precision tech, robotics, and seasonal hiring are reshaping who does the work, with current figures for 2023 and 2025 wherever available.
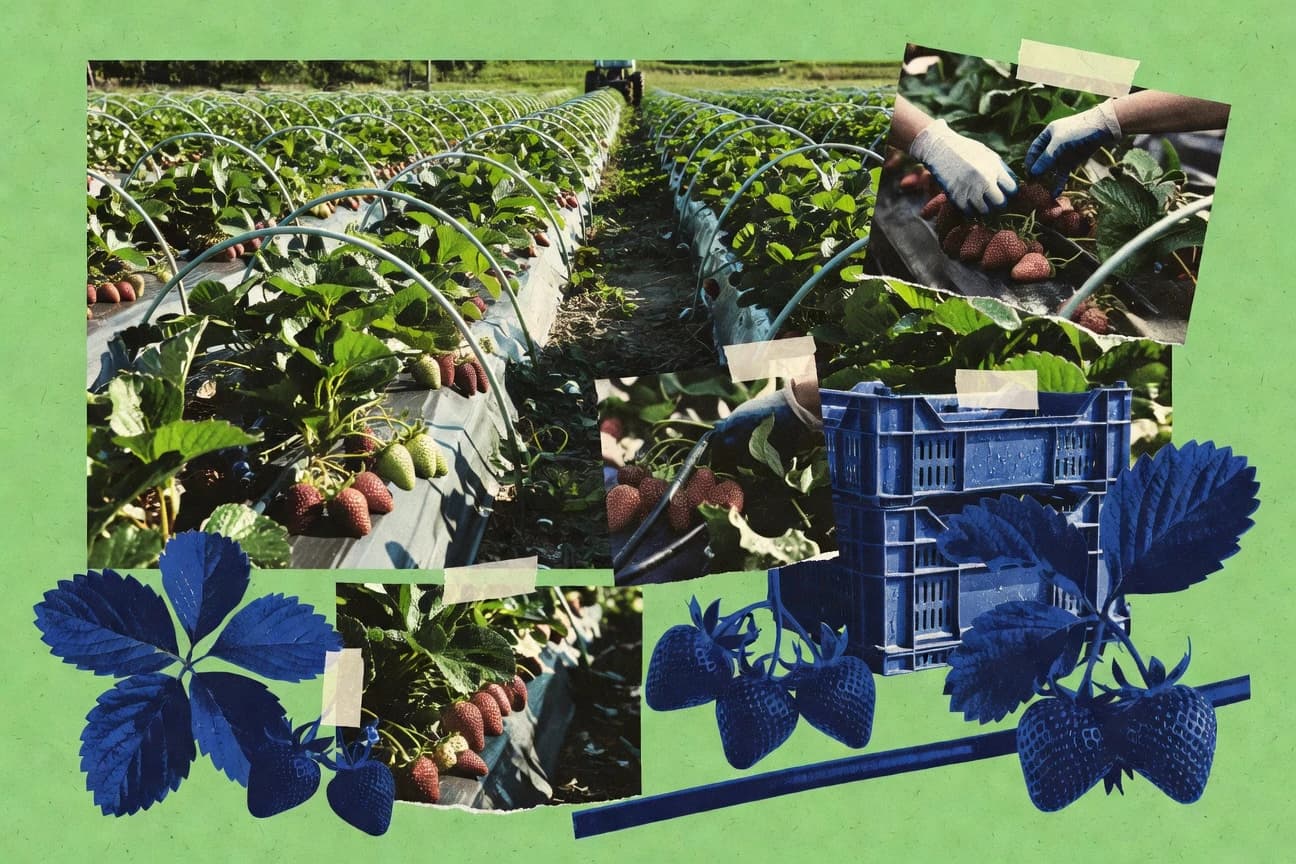
Strawberry Industry Statistics
From global yields hovering near 20.0 metric tons per hectare to EU import prices around €2.20/kg in 2023, Strawberry Industry’s stats bring the supply chain into focus alongside what shoppers will pay for and why. Expect sharp consumer and compliance tensions too, with no residue preference driving 39% of French buyers and EFSA monitoring spanning 12,000 plus strawberry samples, all while cold-chain and postharvest handling realities threaten quality after harvest.
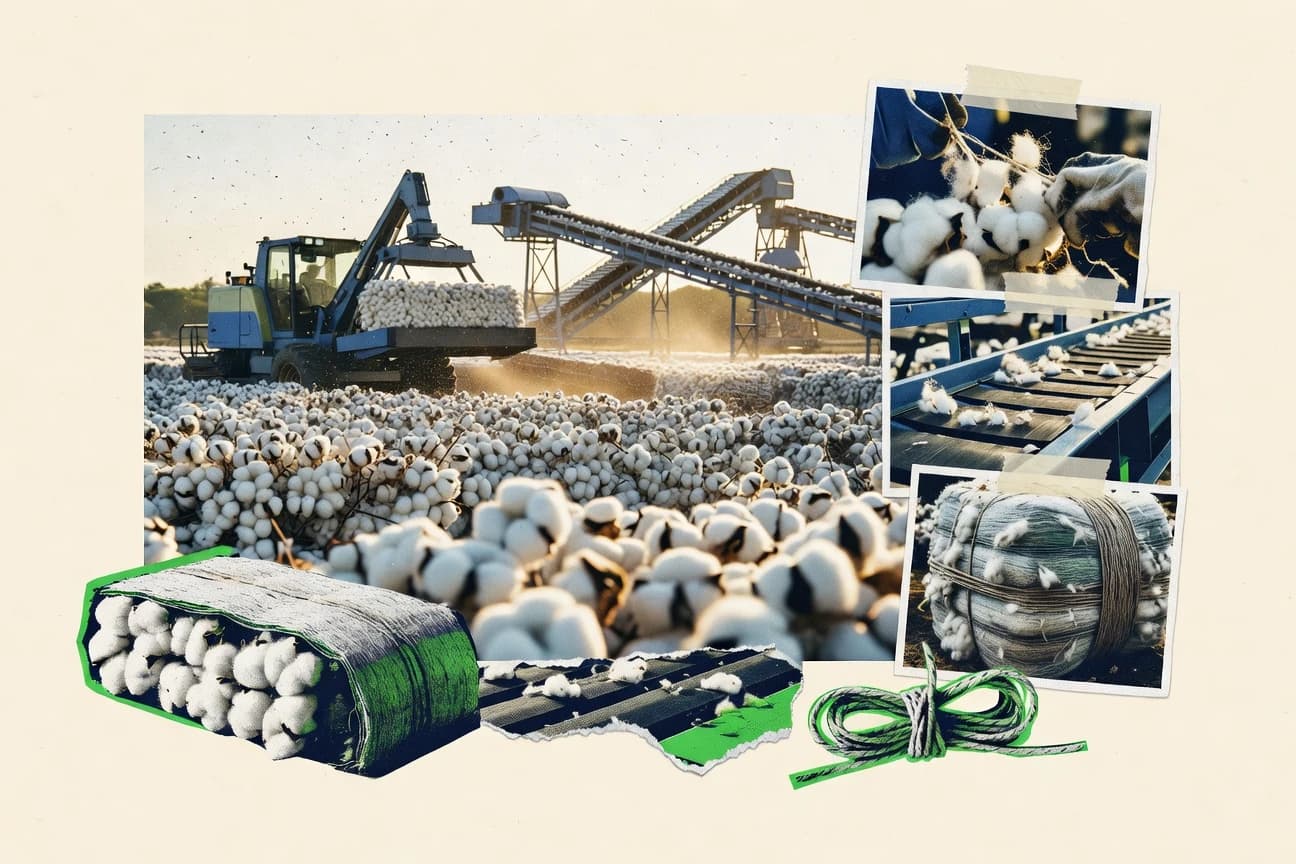
Cotton Industry Statistics
With global cotton mill use projected at 25.8 million metric tons in 2022/23, up 8% year on year as apparel demand rebounds, this page maps exactly where the yarn starts and where the capacity bottlenecks land. You will see how China’s 8.3 million tons powers 90% capacity mills while exporters like Bangladesh and Vietnam translate cotton supply into garment value, and how big producers and smaller spinners alike are being pulled into the same tight trade and price cycle.

Global Egg Industry Statistics
Retail egg prices climbed 8.2% year on year and the EU moved fully away from battery cages as enriched, barn, and free range systems took over, so the cost pressure and welfare rules are reshaping everything from margins to protein supply. Track how egg powder trade, import flows, and layer performance metrics such as FCR around 2.0 to 2.2 and eggs at about 0.33 per hen per day connect to energy and feed cost realities, plus what ISO 22000 evidence suggests about recall risk control.
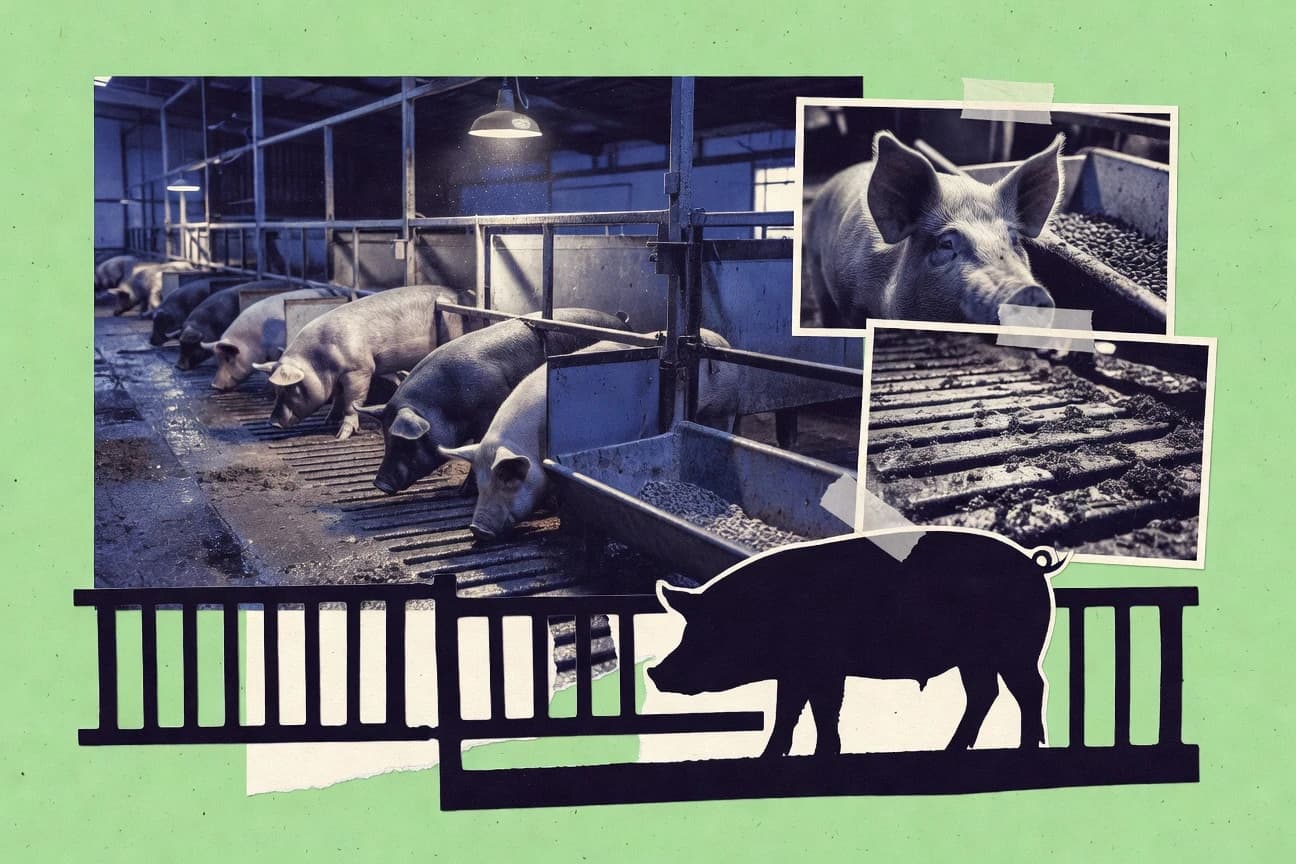
Hog Industry Statistics
With global pork demand projected to grow at a 4.8% CAGR from 2024 to 2029, Hog Industry puts the squeeze on margin by pairing price and feed signals with the risk side of ASF, where 62% of producers reported major biosecurity changes after outbreaks. You get a grounded view of scale from EU-27 slaughter at about 250 million pigs in 2022 to China’s 45.5 million tonnes of pork output in 2023, plus what precision tech and traceability are already changing in day to day production.

Global Pork Industry Statistics
With 2023 already changing the economic picture, this page links pork consumption, prices, and production costs to show why margins can swing quickly from feed shocks and ASF risk, with global wholesale pork averaging $1.92 per kg and China pork prices up 18.2% year on year. It also puts supply and sustainability in the same frame, from Asia’s 77% share of 2023 pig meat to how EU manure and welfare rules are reshaping sow housing and scale.