GITNUX MARKETDATA
Browse Our Category
Agriculture Farming
Latest update:

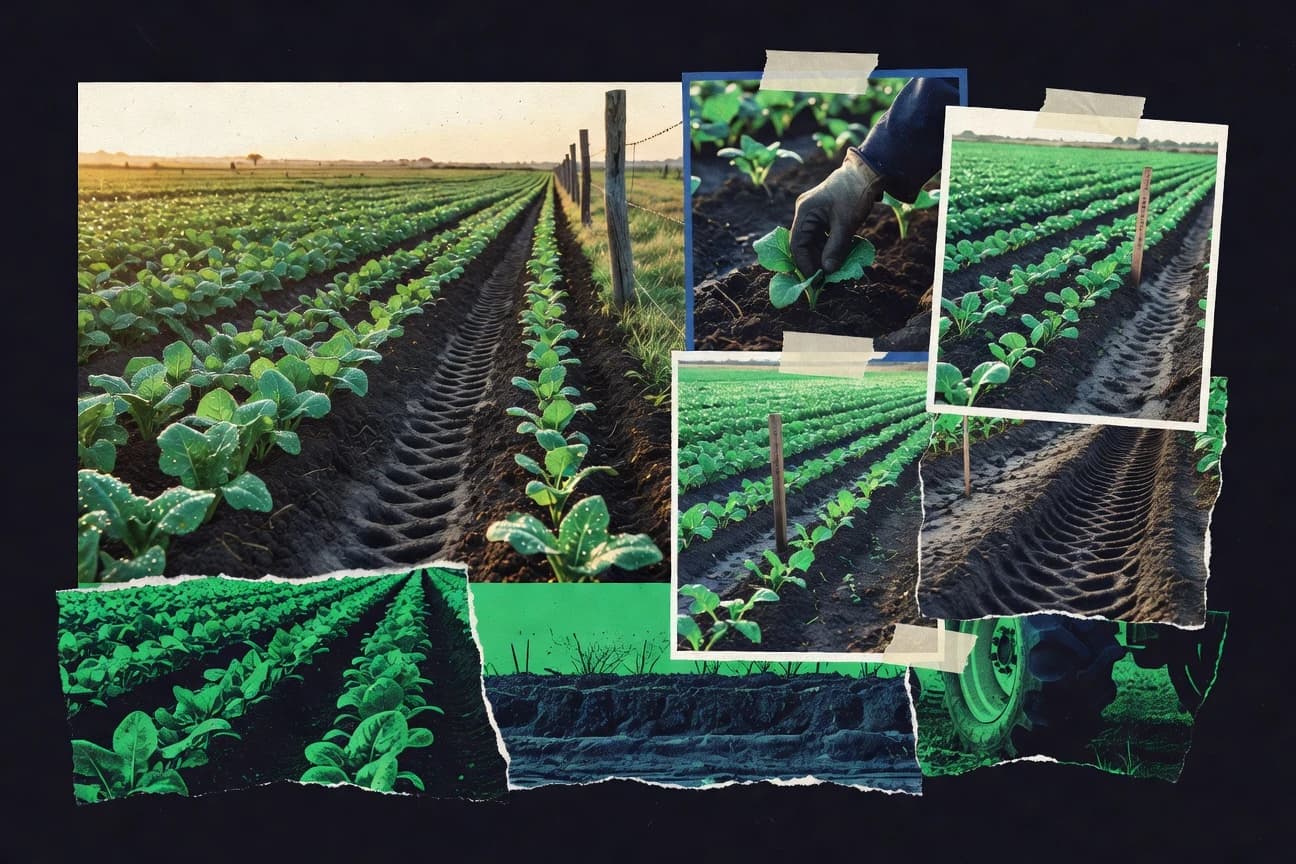
Agricultural Statistics
Agriculture still weighs heavily on the global economy, with projections putting total agricultural output at 9.1% of world GDP in 2024, while innovation is moving fast from biopesticides reaching a projected $12.5 billion by 2025 to precision farming forecast to top $17.0 billion by 2026. This page connects the farm level evidence behind yield gains and efficiency tools with the pressure points of pests, nitrogen losses, food waste, and climate risk.
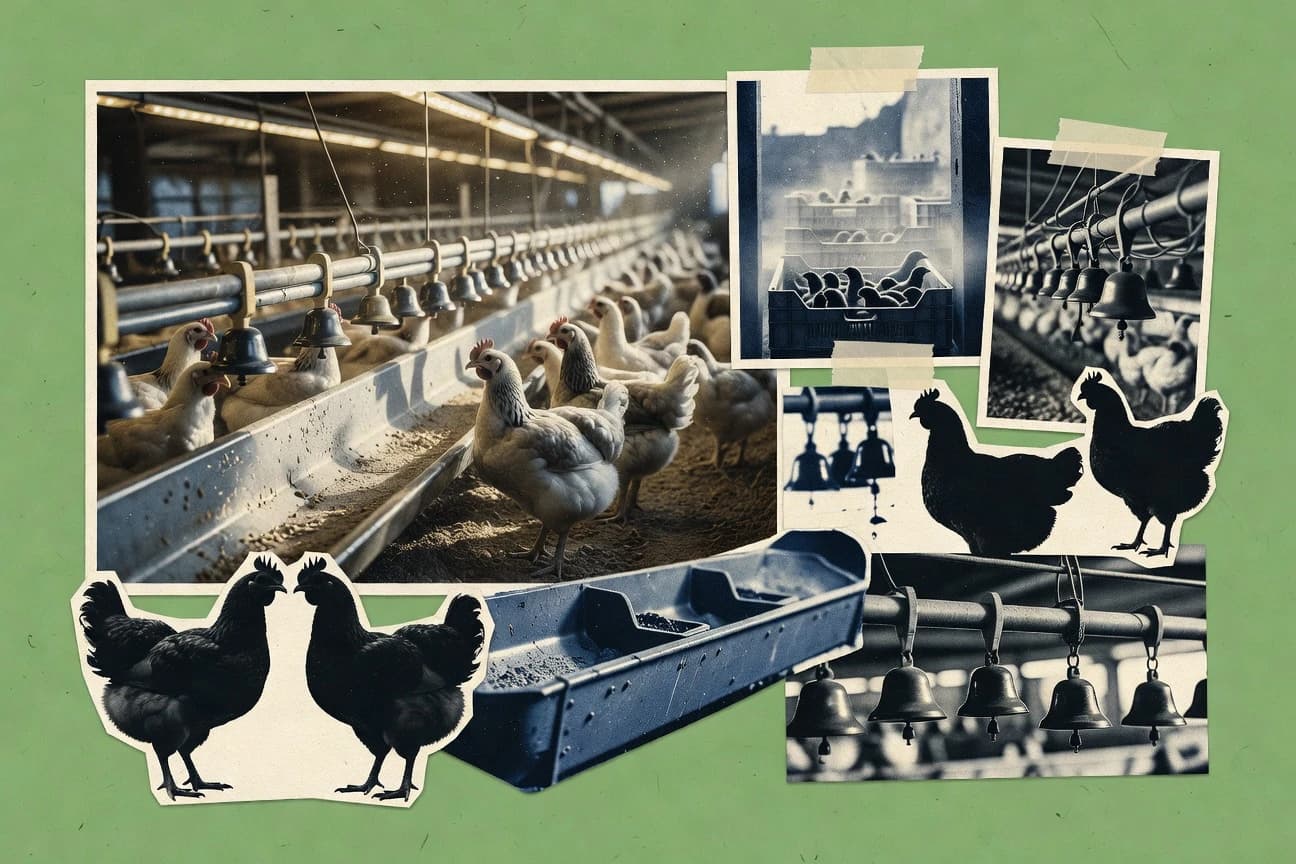
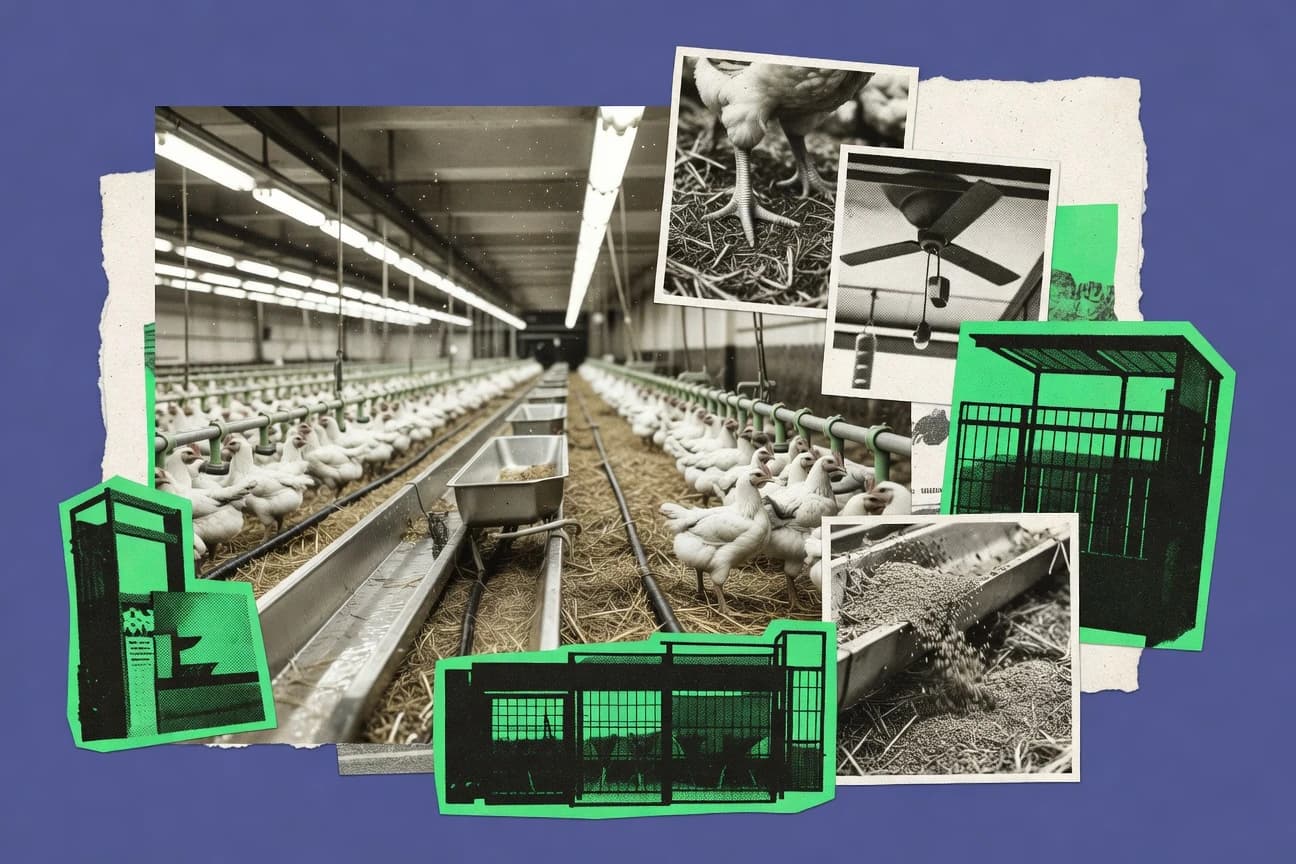
Broiler Industry Statistics
See how a fast global industry can still hide major tradeoffs, from broiler greenhouse gas emissions of about 1.5 to 3.0 kg CO2e per kg live weight to the fact that chicken drives most poultry meat exports while transport and processing alone can run 5 to 12 percent of final cost. The page pulls together up to 6.2 percent projected growth, feed and welfare benchmarks like typical starter lysine of about 1.1 to 1.2 percent and stocking densities around 33 to 42 kg per m², plus ingredient and biosecurity pressures from soybean meal prices to Campylobacter and salmonellosis surveillance.
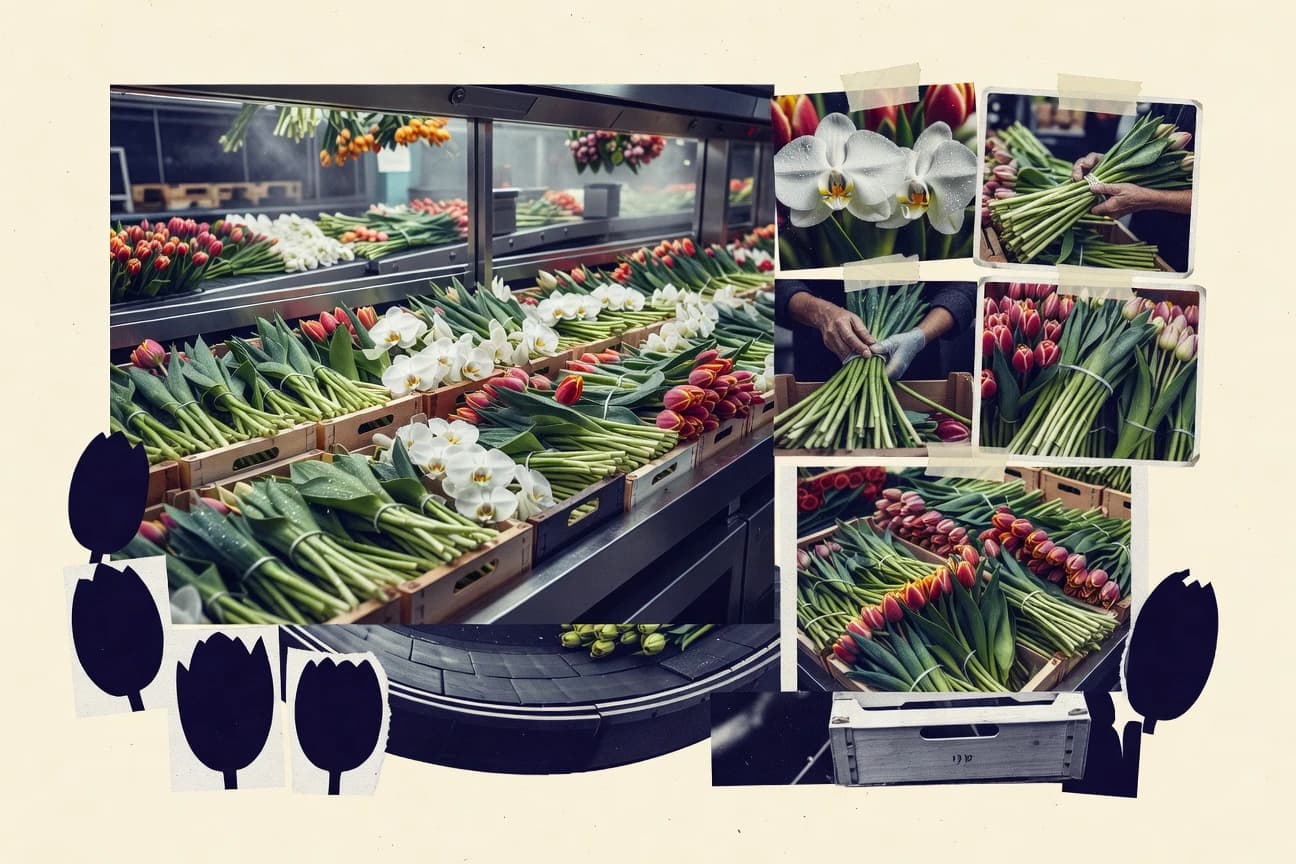
Global Flower Industry Statistics
With the global floriculture market valued at $54.0 billion in 2022 and a 9.3% expected CAGR for 2023 to 2030, this page maps how cut flowers and potted plants compete alongside massive trade flows and greenhouse production footprints. It also pairs supply chain reality checks such as up to 20–30% fresh cut losses between harvest and retail and CA storage gains of 10–30% with country export power, including Belgium’s $1.9 billion flower export haul in 2021 and the Netherlands’ €8.4 billion cut flower exports in 2022.
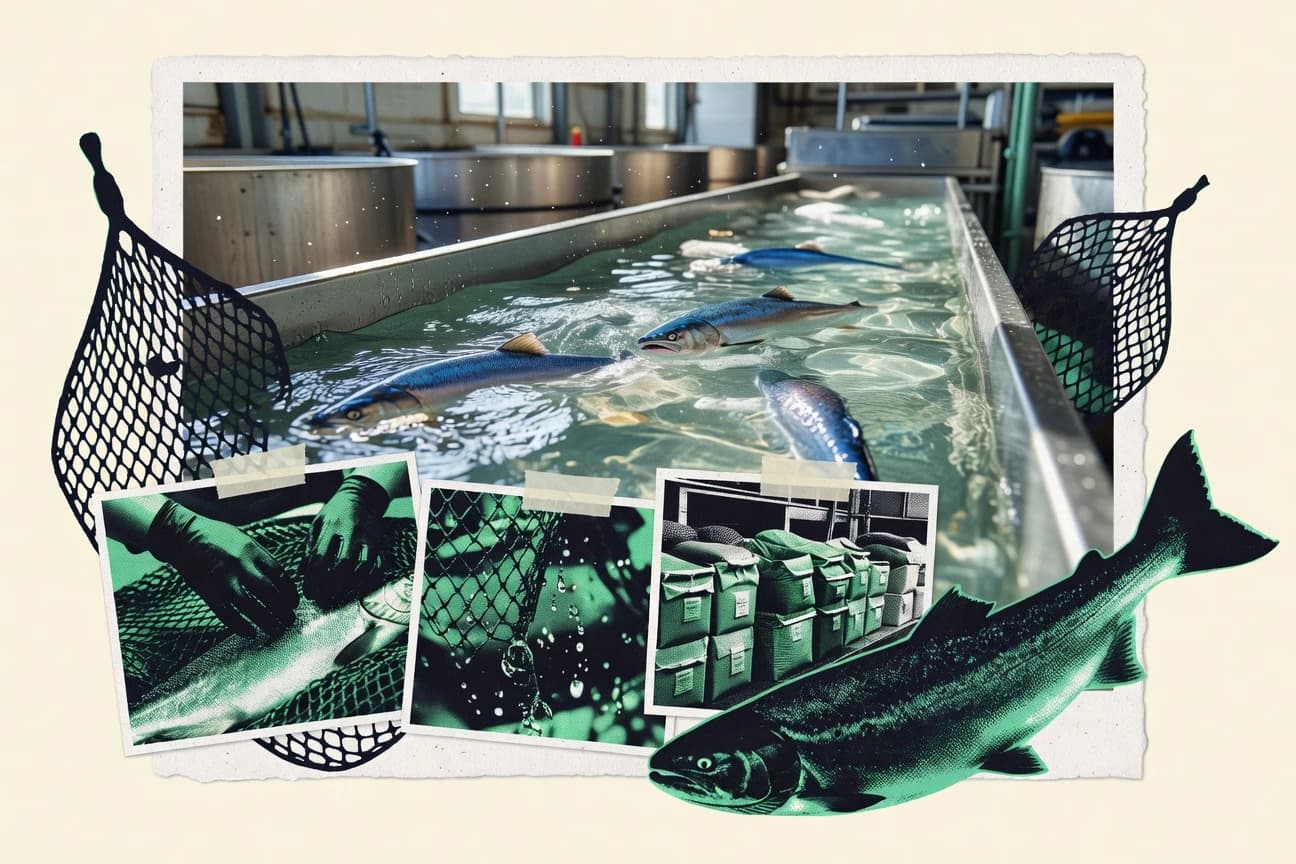
Salmon Industry Statistics
Track the salmon industry’s scale through 2022, with global revenue at $25.6 billion and Norway’s export value hitting 115 billion NOK, then zoom into what changes the bottom line like feed costs at 50% of production expenses and a 25% average ROI for Norwegian farmers. You will also see the trade and sustainability pressures side by side, from global antibiotic use of 0.01 g per ton biomass to nitrogen discharge estimated at 50,000 tons worldwide.
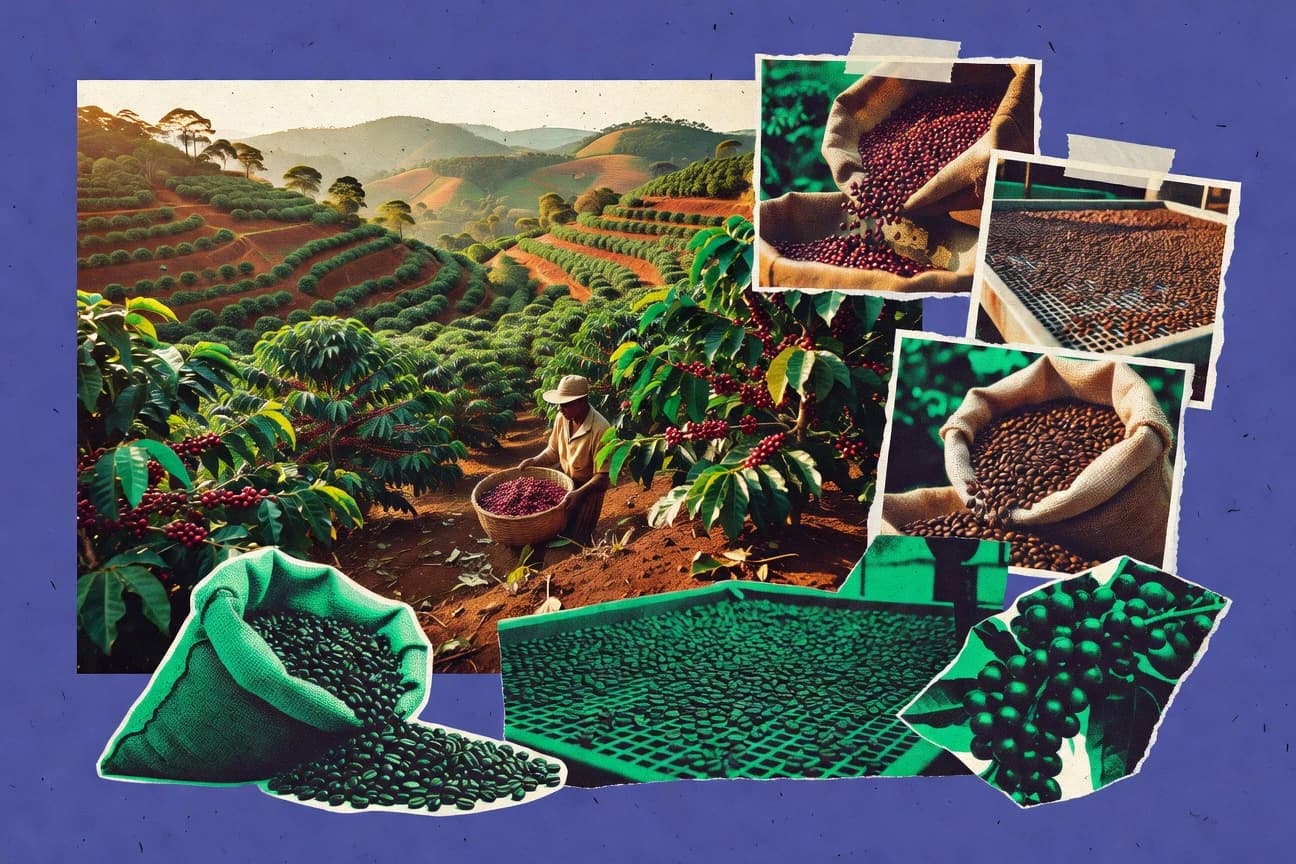
Brazil Coffee Industry Statistics
Brazil’s coffee productivity is up about 7% since 2014 as logistics and defect-reduction sorting lift specialty eligibility, even while extreme-weather hit rates in severe El Niño or La Niña years are estimated at 10–30% in affected regions. Roasted coffee exports reach about US$1.4 billion in 2023 alongside total HS 0901 exports of US$6.3 billion, revealing a sharp value split that can turn a 60 percent share of cooperative handled shipments into specialty premiums up to 3.6 times conventional lots.
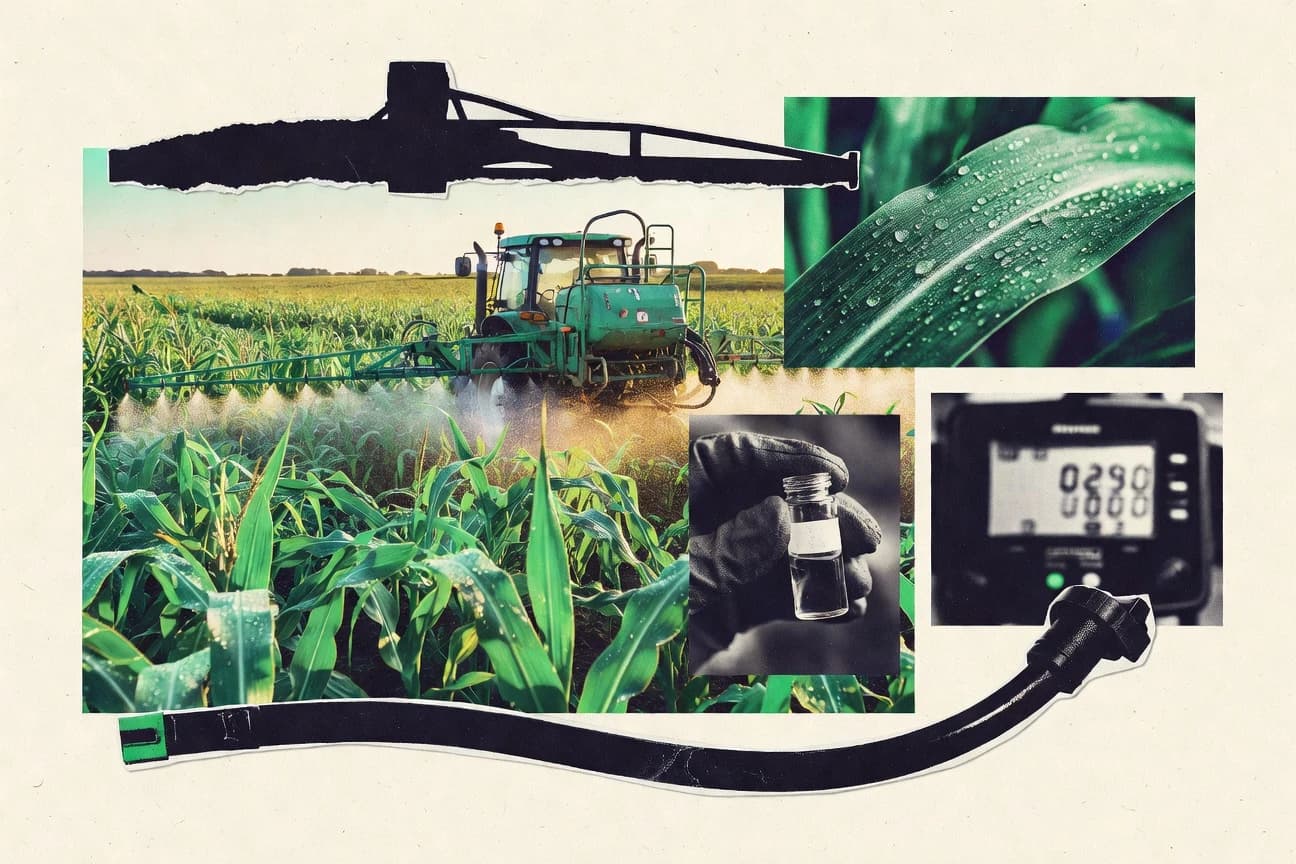
Crop Protection Industry Statistics
Global crop protection chemistry is projected to reach $85.6 billion by 2028 as the market CAGR stays at 4.9 percent from 2018 to 2023, yet the strongest momentum is increasingly in biocontrol and smarter use of inputs, including a 10.2 percent CAGR for biological crop protection and a 20 percent cut in pesticide application in 2023 trials of precision agriculture. Track how leading players from Syngenta, Bayer, and BASF to FMC, UPL, and ADAMA are reshaping share with sales like Syngenta’s $11.8 billion and FMC’s $4.2 billion against policy pressure such as EU bans of 20 active substances in 2023.

Farm Equipment Industry Statistics
New equipment gets harder to justify when U.S. new tractor prices still rose faster than affordability, with real prices up 2.2% from 2017 to 2022, while 2023 agricultural machinery faced a 0.9% U.S. PPI increase that tightens manufacturers’ input costs. From Germany’s €6.0 billion farm machinery export value in 2022 to precision and battery electric breakthroughs cutting fuel and labor needs, these figures explain exactly where demand is strengthening and where it is stalling.

Nut Industry Statistics
Global nut consumption climbed to 2.5 kg per person in 2022, yet the page puts surprising pressure on where that demand lands, from US almonds at 1.8 billion pounds with 70 percent exported to China’s 1.2 million MT of walnuts largely staying home. Market value is just as revealing, with the global nut industry at USD 68.6 billion in 2022 and snack nuts reaching USD 25 billion, helping you see which crops are built for export, which are driven by domestic tastes, and where value is being made.

Arborist Industry Statistics
Tree service demand is steady, but qualified crews are not. With 56% of U.S. employers saying they could not fill all job openings due to a lack of candidates, and a 2023 median wage of $27.14 per hour for landscaping and groundskeeping workers, this page pulls together the pay, labor, safety, and market pressure shaping arborist work from field shortages to emergency cleanup and urban forestry growth.
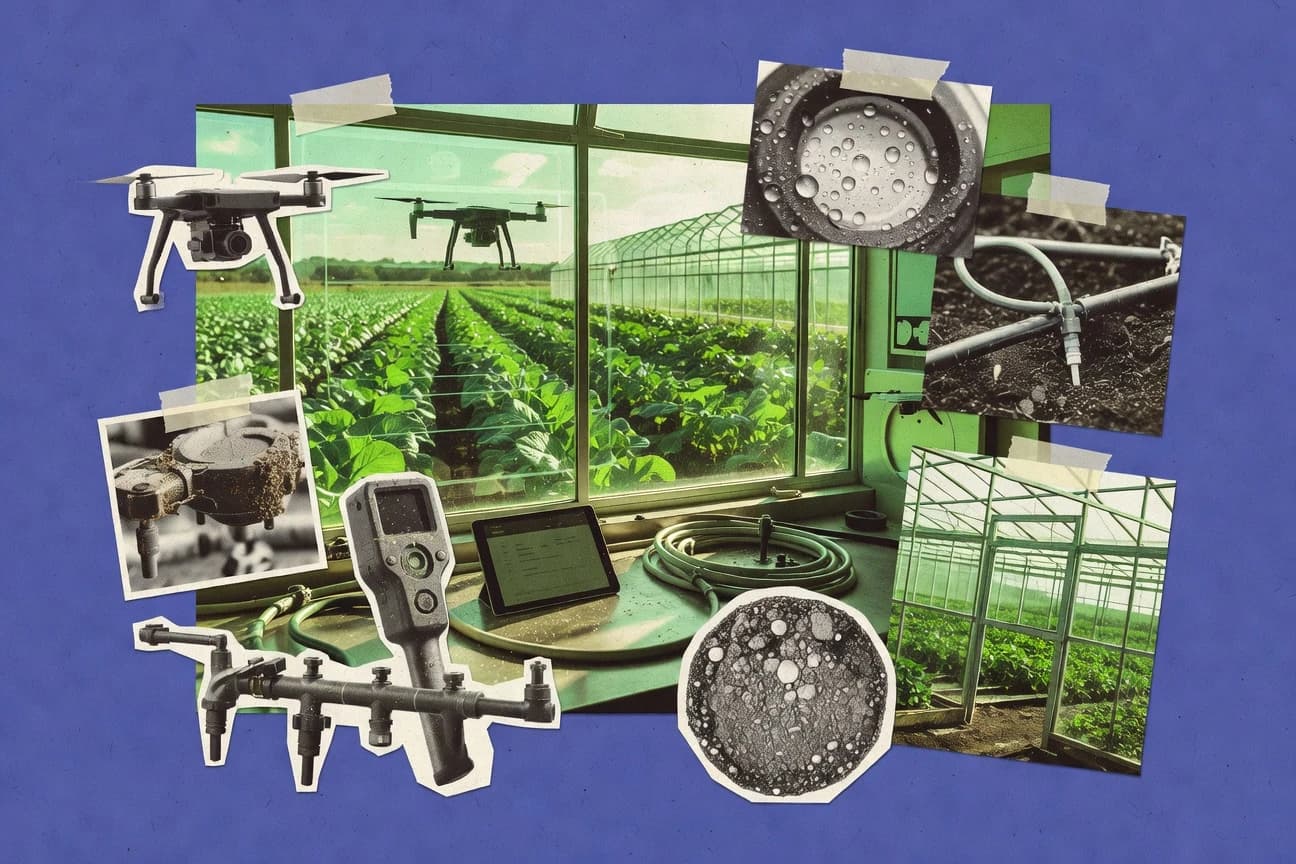
Agritech Industry Statistics
From $21.7 billion in digital agriculture software value to an estimated 1.1 million agricultural drones counted by 2022, this Agritech Industry stats page connects market momentum to measurable farm gains like 20 to 40% lower greenhouse electricity use and up to a 20% drop in irrigation water. It also tallies what technology can realistically change, from irrigation scheduling yield lifts of 0.2 to 0.6% to scan based weed and disease detection benchmarks that keep pushing the precision frontier.
Poultry Industry Statistics
The poultry sector runs on precision and pressure, from feed that can drive 65% to 70% of broiler costs to a global poultry feed market projected to hit $88.9 billion by 2030, with protein and temperature control shaping outcomes as much as disease risk. You will also see how farm output connects to processing and exports, including the US poultry processing market at $10.4 billion in 2023 and worldwide H5 and H7 outbreaks surpassing 200 events in 2023, alongside the food-safety reality of roughly 20% non-typhoidal Salmonella prevalence in poultry meat.

Sugarcane Industry Statistics
Harvested sugarcane land is sitting at about 101 million hectares in 2022, yet sugar and ethanol markets keep tightening and reshaping demand, with global sugar valued near US$ 88.0 billion in 2023 and bioethanol up to about US$ 82.0 billion the same year. Follow how policy-driven shifts like near universal controlled harvesting in Brazil and yield sensitivities such as sucrose content and irrigation stress translate into export volumes, fermentation output, and even price volatility on the weekly sugar curve.

Saudi Dates Industry Statistics
Saudi Arabia’s date industry is counted at around 2.0+ million metric tons of production in the latest FAOSTAT crop records, while UN Comtrade places the kingdom among the top exporters by value in 2022 with exports worth over US$1.4 billion. From a 500,000+ hectare palm footprint and irrigation driven by arid evapotranspiration to how moisture and water activity shape spoilage and shelf life, the page connects trade scale, agronomy constraints, and processing outcomes in one view.

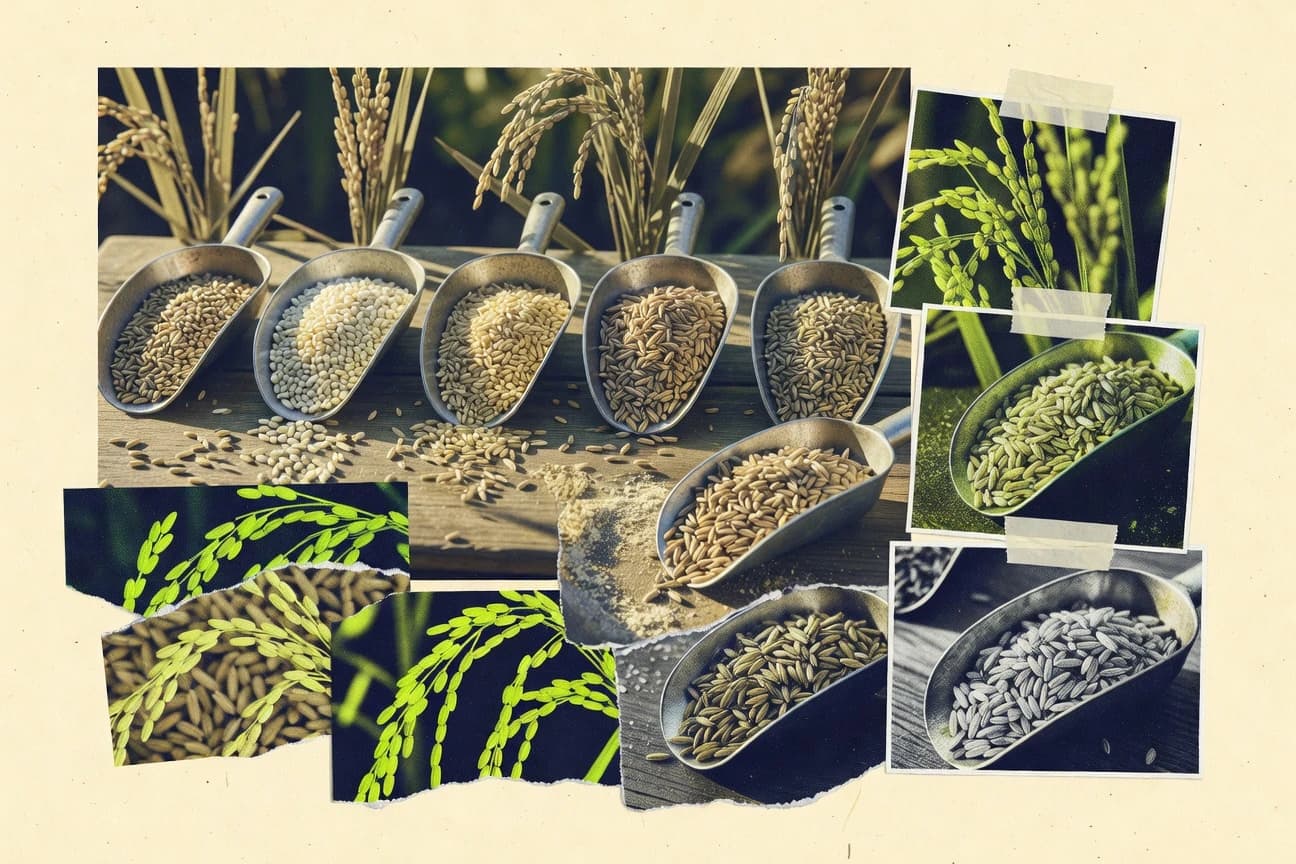
Rice Industry Statistics
Global rice yield sits at about 4.5 metric tons per hectare while methane and water pressures remain central, with rice cultivation responsible for roughly 10% of anthropogenic CH4 and improved water management cutting emissions by 30 to 50%. Track how demand and constraints meet, from a projected 154 million metric tons of stocks by 2030 to regulatory and mechanization realities that shape costs, safety, and food reliability for 3.5 billion rice eaters.
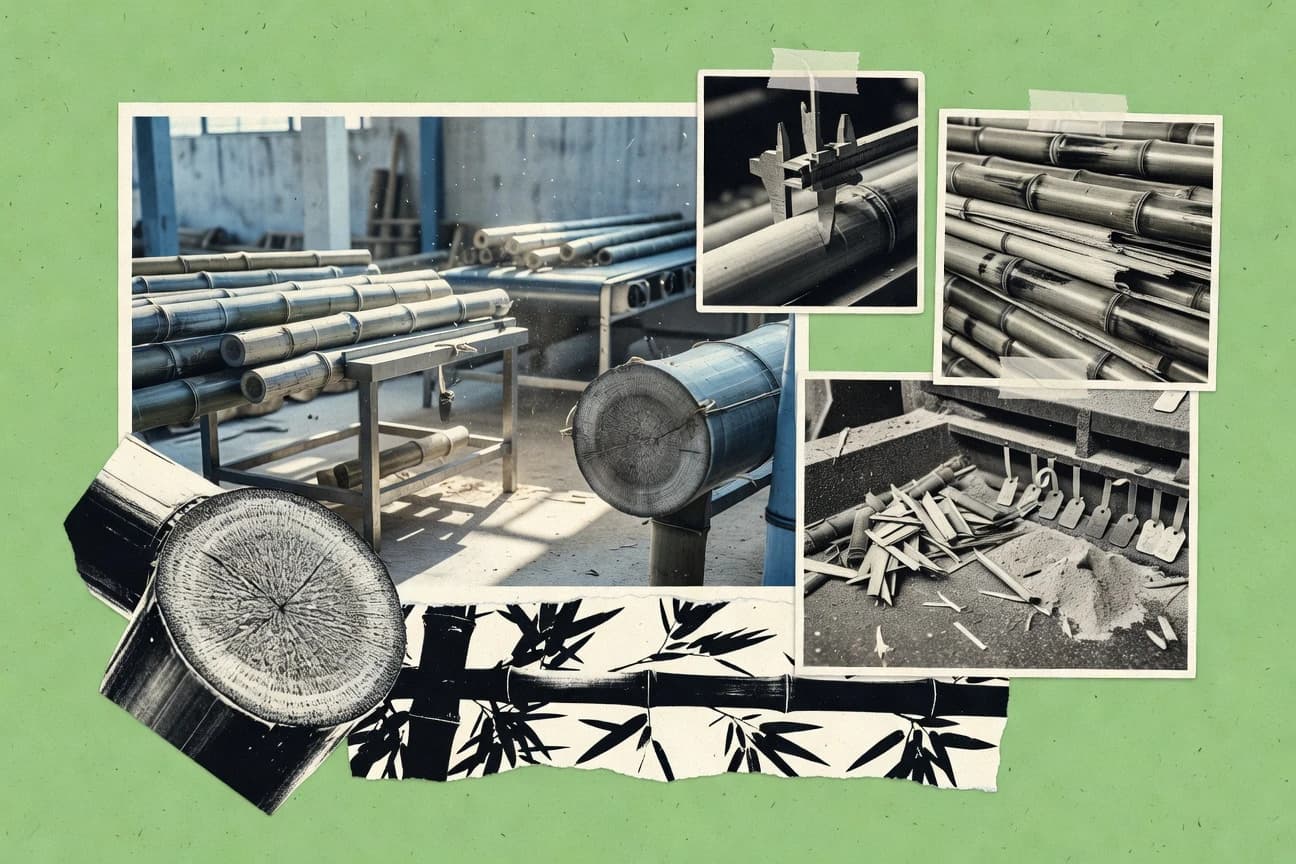
Bamboo Industry Statistics
Bamboo can regrow from its rhizomes and be harvested repeatedly for many years, and the industry numbers behind that staying power are moving fast, from a $5.2 billion global bamboo shoot market in 2022 to a forecast reaching $89.3 billion for bamboo products by 2027. You can also compare the material side and the climate side at once, from up to 91 cm of peak daily growth and fiber and board performance ranges to life cycle and carbon sequestration findings that often outperform conventional substitutes under the right boundaries.

Kelp Industry Statistics
The kelp industry is growing fast and already sits at the center of global value, with seaweed demand forecast at a 6.0% average annual growth rate through 2031 and hydrocolloids like alginate and carrageenan driving a big share of that upside. You will also see what matters beyond tonnage, including how kelp systems can cut nitrogen by double digit percentages in integrated trials and why processing energy and pricing grades can swing ingredient costs from one batch to the next.

Forestry Industry Statistics
With global wood products trade topping $250 billion in 2022 alongside forestry employment reaching 13.5 million people in 2020 and industrial roundwood production hitting 1.92 billion cubic meters in 2022, this page connects forests to real economic weight. It also puts 2025 readers in the drivers seat by pairing GDP and export scale across countries, from Vietnam’s 2022 forestry GDP share of 1.2% and $14 billion in wood products, to Sweden’s SEK 400 billion turnover, so you can spot which parts of the supply chain are powering growth and which are under pressure.
Rice Diversity Statistics
Rice’s newest diversity statistics bring admissions, outcomes, and campus composition into one place, from international representation that peaks at 28.1% among graduate students to undergraduate acceptance sitting at just 8.7% in Fall 2023. You will also see how persistence and completion hold steady across groups, including a 98.1% Hispanic first to second year retention rate and a 92.3% six year graduation rate for Black undergraduates.

Bee Statistics
Honey is big business and it is also tightly bound to bee stress and pest control, with New Zealand producing 1.6 million kilograms in 2023 and the Varroa destructor mite linked to 76% of colony health declines in European apiaries. Temperate crop pollination relies heavily on managed honey bees, yet heat stress risk rises as global temperatures climb by 1.5°C and only 4.8% of EU beekeepers adopted mite monitoring devices in 2021, making the gap between what is known and what is practiced feel urgent.
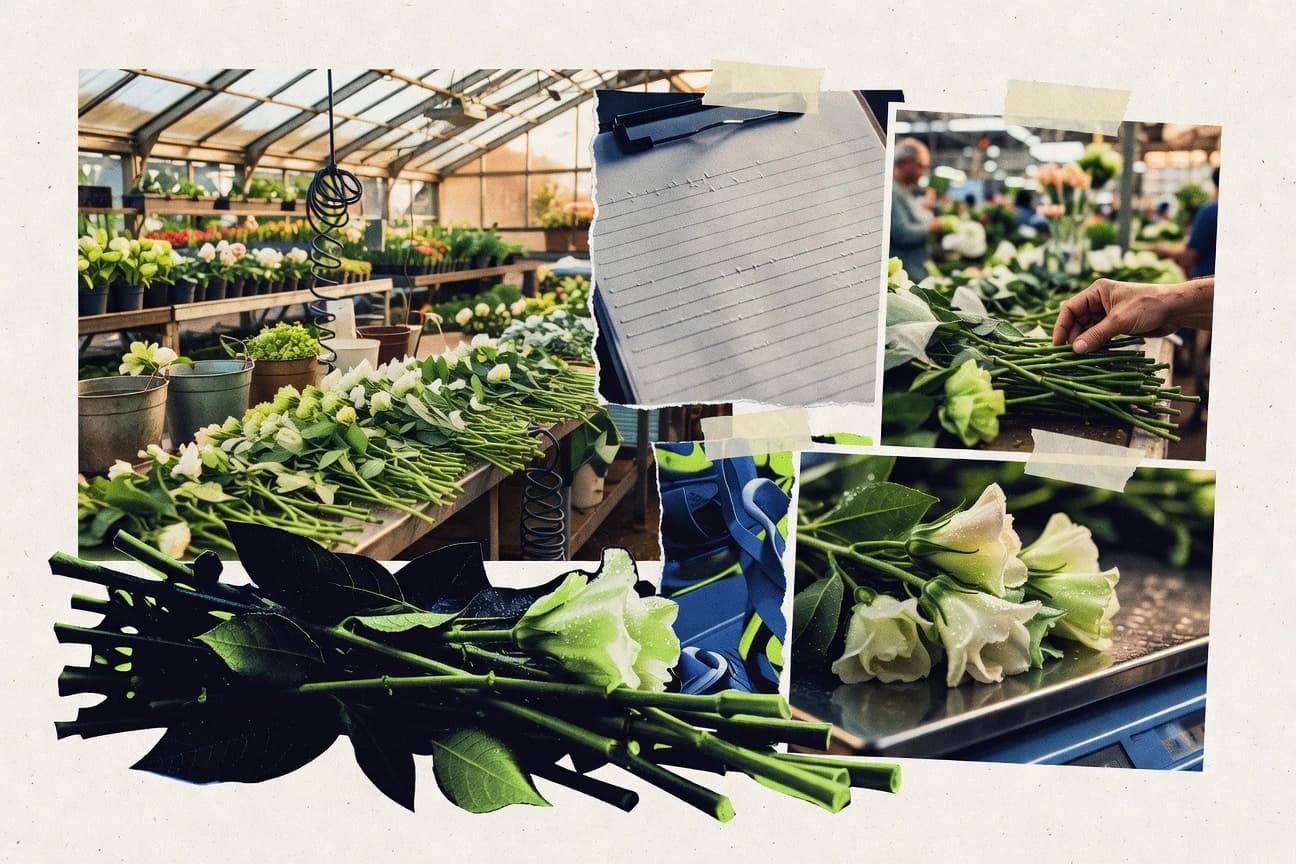
Floral Industry Statistics
With global indoor plants valued at $2.0 billion in 2023 and hydroponic floriculture projected to reach $2.4 billion in 2024, this page tracks what is really driving profitability versus volatility from auction price swings to electricity costs that consume 30% to 40% of greenhouse budgets. It also connects production choices like IPM and biosecurity, plus postharvest controls that cut losses and boost vase life, to buyer behavior and delivery expectations where 60% of B2B orders use digital platforms and only 18% of floral sales go same day or next day.