
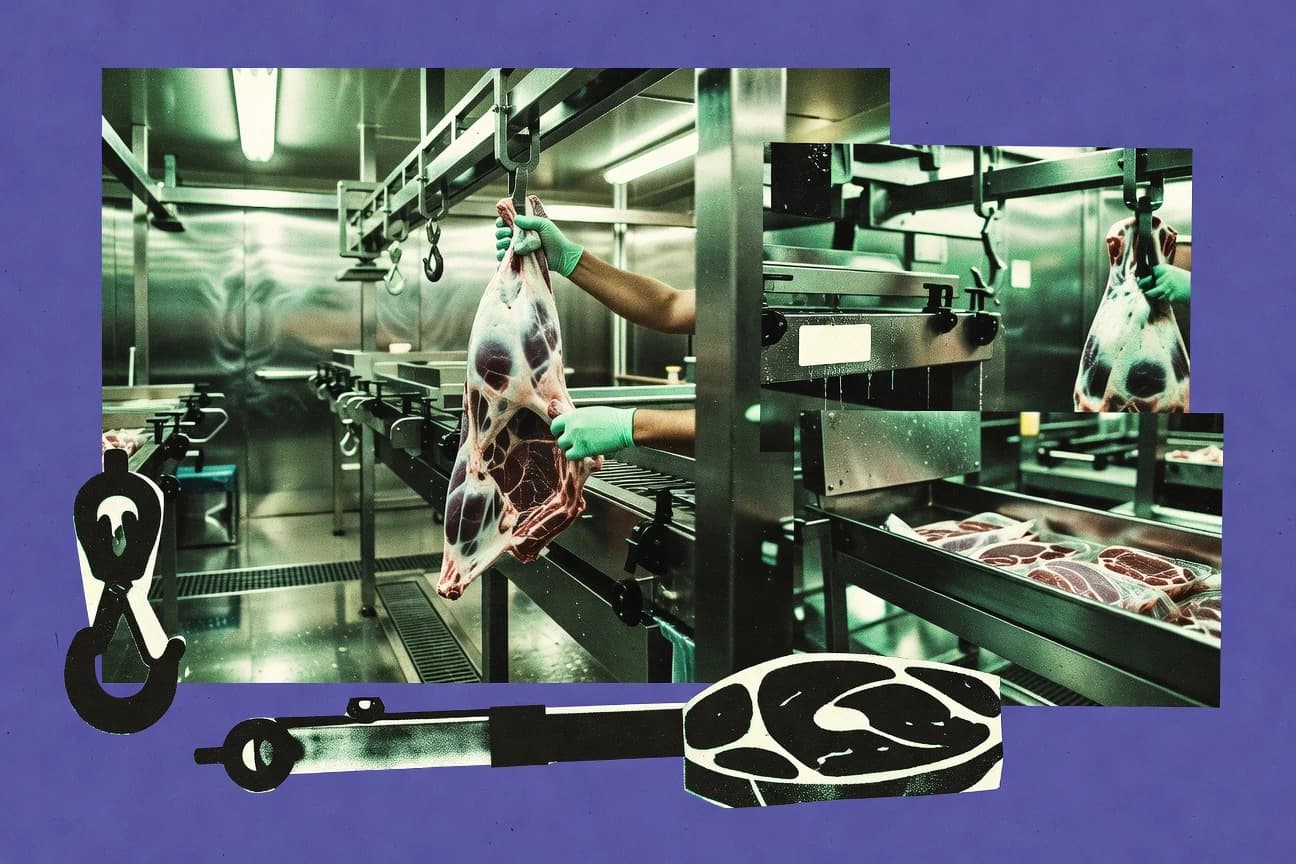

EU feed prices averaged 19 percent higher than the previous year. Livestock supply chains generate 70 percent of EU agricultural methane emissions. These pressures coincide with mandated hygiene controls and welfare procedures that shape inspection frequency and processing operations.
Key Takeaways
- In 2023, EU’s feed prices were on average 19% higher than the previous year (EU average), reflecting elevated feed cost conditions
- In 2019, EU/EEA reported antimicrobial use in livestock of about 103 mg/PCU (population correction unit), measuring overall livestock AMU intensity
- EU official controls under Regulation (EU) 2017/625 require risk-based frequency adjustments for food of animal origin, affecting inspection intensity
- EU slaughterhouses must use stunning and welfare procedures under Regulation (EC) No 1099/2009, defining required welfare compliance at slaughter
- EU Regulation (EU) 2019/1009 sets requirements for fertilisers that can impact feed crop input costs; compliance obligations scale across the supply chain
- EU’s Regulation (EC) No 853/2004 sets hygiene rules for food of animal origin, affecting meat processing compliance costs across member states
- EU’s ban on cages for laying hens started in 2012 and continues under the EU animal welfare framework, with ongoing compliance for poultry supply chains
- EU exports accounted for about 10% of total EU meat production value in 2022 (trade share), indicating external demand reliance
- An estimated 60% of global agricultural emissions come from livestock supply chains when aggregating land-use and livestock-related emissions (FAO estimate), quantifying livestock-linked climate impact
- In 2022, EU-27 livestock-related emissions accounted for 70% of agricultural methane emissions in the EU (inventory-based allocation), quantifying livestock methane dominance
- EU Regulation (EU) 2023/1115 includes deforestation and forest degradation risk requirements affecting feed supply chains (soy/crops) used in livestock diets
- 3.2% average reduction in greenhouse-gas intensity per kg carcass for EU meat processing between 2019 and 2022 (indexed intensity), reflecting operational decarbonization progress
- 6.5% average energy intensity reduction in meat processing (kWh per tonne) from 2020 to 2023 (benchmarking index), reflecting efficiency improvements
- 7.0% of EU meat processors invested in automation/robotics in 2024 (investment adoption rate), indicating capex trend toward automation
- 0.28 fatal work accidents per 100,000 workers in the EU food manufacturing sector in 2022 (fatal accident rate), serving as an occupational safety benchmark for meat manufacturing
Rising feed costs and stricter rules are pushing EU meat processors toward decarbonization, efficiency, and stronger animal welfare.
Related reading
01 · Category
Cost Analysis1 stats
01
In 2023, EU’s feed prices were on average 19% higher than the previous year (EU average), reflecting elevated feed cost conditions
Interpretation
Cost Analysis Interpretation
In 2023, EU feed prices averaged 19% higher than the previous year, underscoring how rising input costs were a key pressure point within the Eu Meat Industry cost analysis.
02 · Category
Compliance & Health9 stats
01
In 2019, EU/EEA reported antimicrobial use in livestock of about 103 mg/PCU (population correction unit), measuring overall livestock AMU intensity
02
EU official controls under Regulation (EU) 2017/625 require risk-based frequency adjustments for food of animal origin, affecting inspection intensity
03
EU slaughterhouses must use stunning and welfare procedures under Regulation (EC) No 1099/2009, defining required welfare compliance at slaughter
04
The EU 2018 European One Health Action Plan targets reducing antimicrobial resistance with measurable reductions in antimicrobial use intensity by 2027 (milestone targets), guiding compliance goals
05
EU Regulation (EU) 2019/6 governs veterinary medicinal products and sets rules affecting use and distribution of antibiotics in livestock
06
EU Regulation (EU) 2019/4 restricts medicated feed and lays down requirements impacting antimicrobial use in animal nutrition
07
EU Regulation (EC) No 183/2005 lays down feed hygiene requirements, affecting meat producers using compound feed for livestock
08
The EU baseline for Salmonella reduction in breeding flocks targets 100% implementation by member states (program coverage), measuring program rollout requirement
09
The EU’s HACCP-based hygiene rules under Regulation (EC) No 852/2004 require food business operators to implement HACCP procedures, measuring mandated risk management adoption
Interpretation
Compliance & Health Interpretation
For the Compliance and Health angle, the EU’s push to curb antibiotic misuse is underscored by the reported 2019 livestock antimicrobial use of about 103 mg per PCU while tougher, risk-based official controls and stricter rules on veterinary medicines and medicated feed (2017/625, 2019/6, 2019/4, and the 2018 One Health Action Plan) are designed to drive measurable reductions.
03 · Category
Industry Trends3 stats
01
EU Regulation (EU) 2019/1009 sets requirements for fertilisers that can impact feed crop input costs; compliance obligations scale across the supply chain
02
EU’s Regulation (EC) No 853/2004 sets hygiene rules for food of animal origin, affecting meat processing compliance costs across member states
03
EU’s ban on cages for laying hens started in 2012 and continues under the EU animal welfare framework, with ongoing compliance for poultry supply chains
Interpretation
Industry Trends Interpretation
Industry trends show that EU meat businesses face mounting cost pressures from compliance, since rules like fertilizer requirements under EU 2019/1009 and hygiene obligations under EC 853/2004 directly affect processing and feed input expenses across member states while the ongoing cage ban for laying hens that began in 2012 keeps poultry welfare compliance active.
04 · Category
Trade & Consumption1 stats
01
EU exports accounted for about 10% of total EU meat production value in 2022 (trade share), indicating external demand reliance
Interpretation
Trade & Consumption Interpretation
In 2022, EU meat exports made up about 10% of total EU meat production value, underscoring that trade is a meaningful driver of consumption demand beyond the EU market.
05 · Category
Sustainability & Emissions4 stats
01
An estimated 60% of global agricultural emissions come from livestock supply chains when aggregating land-use and livestock-related emissions (FAO estimate), quantifying livestock-linked climate impact
02
In 2022, EU-27 livestock-related emissions accounted for 70% of agricultural methane emissions in the EU (inventory-based allocation), quantifying livestock methane dominance
03
EU Regulation (EU) 2023/1115 includes deforestation and forest degradation risk requirements affecting feed supply chains (soy/crops) used in livestock diets
04
EU’s Regulation (EU) 2018/2066 mandates monitoring and reporting of greenhouse gas emissions for industrial facilities including some meat processing operations, affecting MRV requirements
Interpretation
Sustainability & Emissions Interpretation
Around 60% of global agricultural emissions come from livestock supply chains and in the EU livestock drove 70% of agricultural methane emissions in 2022, so the Sustainability and Emissions challenge for Eu Meat Industry is tightly linked to cutting livestock and feed-related greenhouse gases while addressing deforestation risks in feed supplies.
More related reading
06 · Category
Emissions & Sustainability1 stats
01
3.2% average reduction in greenhouse-gas intensity per kg carcass for EU meat processing between 2019 and 2022 (indexed intensity), reflecting operational decarbonization progress
Interpretation
Emissions & Sustainability Interpretation
Between 2019 and 2022, EU meat processing cut greenhouse gas intensity by an average of 3.2% per kilogram of carcass, signaling real progress on emissions reduction within the Emissions and Sustainability category.
07 · Category
Technology & Operations2 stats
01
6.5% average energy intensity reduction in meat processing (kWh per tonne) from 2020 to 2023 (benchmarking index), reflecting efficiency improvements
02
7.0% of EU meat processors invested in automation/robotics in 2024 (investment adoption rate), indicating capex trend toward automation
Interpretation
Technology & Operations Interpretation
From 2020 to 2023 EU meat processing cut average energy intensity by 6.5% while 7.0% of processors adopted automation and robotics in 2024, showing technology and operational improvements are advancing on both efficiency and capacity.
08 · Category
Employment & Supply Chain1 stats
01
0.28 fatal work accidents per 100,000 workers in the EU food manufacturing sector in 2022 (fatal accident rate), serving as an occupational safety benchmark for meat manufacturing
Interpretation
Employment & Supply Chain Interpretation
In the EU food manufacturing sector, the fatal work accident rate was 0.28 per 100,000 workers in 2022, underscoring that even within employment and supply chain operations there is still a measurable safety risk to address.
09 · Category
Trade & Demand1 stats
01
24.5% decline in EU edible offal exports in 2023 (value), indicating demand shifts for by-products
Interpretation
Trade & Demand Interpretation
In 2023, EU edible offal exports by value fell 24.5%, signaling a clear weakening of trade demand for these by-products.
report visual · Key figures
EU Meat Industry: Cost, Climate, and Efficiency Pressures
Feed costs rose sharply while meat processing showed improving energy and greenhouse-gas intensity—signaling rising input pressure alongside decarbonization progress.
19%
In 2023, EU’s feed prices were on average 19% higher than the previous year (EU average), reflecting elevated feed cost
3.2%
3.2% average reduction in greenhouse-gas intensity per kg carcass for EU meat processing between 2019 and 2022 (indexed
6.5%
6.5% average energy intensity reduction in meat processing (kWh per tonne) from 2020 to 2023 (benchmarking index), refle
7%
7.0% of EU meat processors invested in automation/robotics in 2024 (investment adoption rate), indicating capex trend to
source-verifiedec.europa.eu · worldbank.org · iea.org · roboticsbusinessreview.com2024
Reference
Cite This Report
This report is designed to be cited. We maintain stable URLs and versioned verification dates. Copy the format appropriate for your publication below.
APA
Emilia Santos. (2026, February 13). Eu Meat Industry Statistics. Gitnux. https://gitnux.org/eu-meat-industry-statistics
MLA
Emilia Santos. "Eu Meat Industry Statistics." Gitnux, 13 Feb 2026, https://gitnux.org/eu-meat-industry-statistics.
Chicago
Emilia Santos. 2026. "Eu Meat Industry Statistics." Gitnux. https://gitnux.org/eu-meat-industry-statistics.
Sources & references
23 datasets cited across this report · attribution is report-level
+12 additional datasets cited (not shown individually)