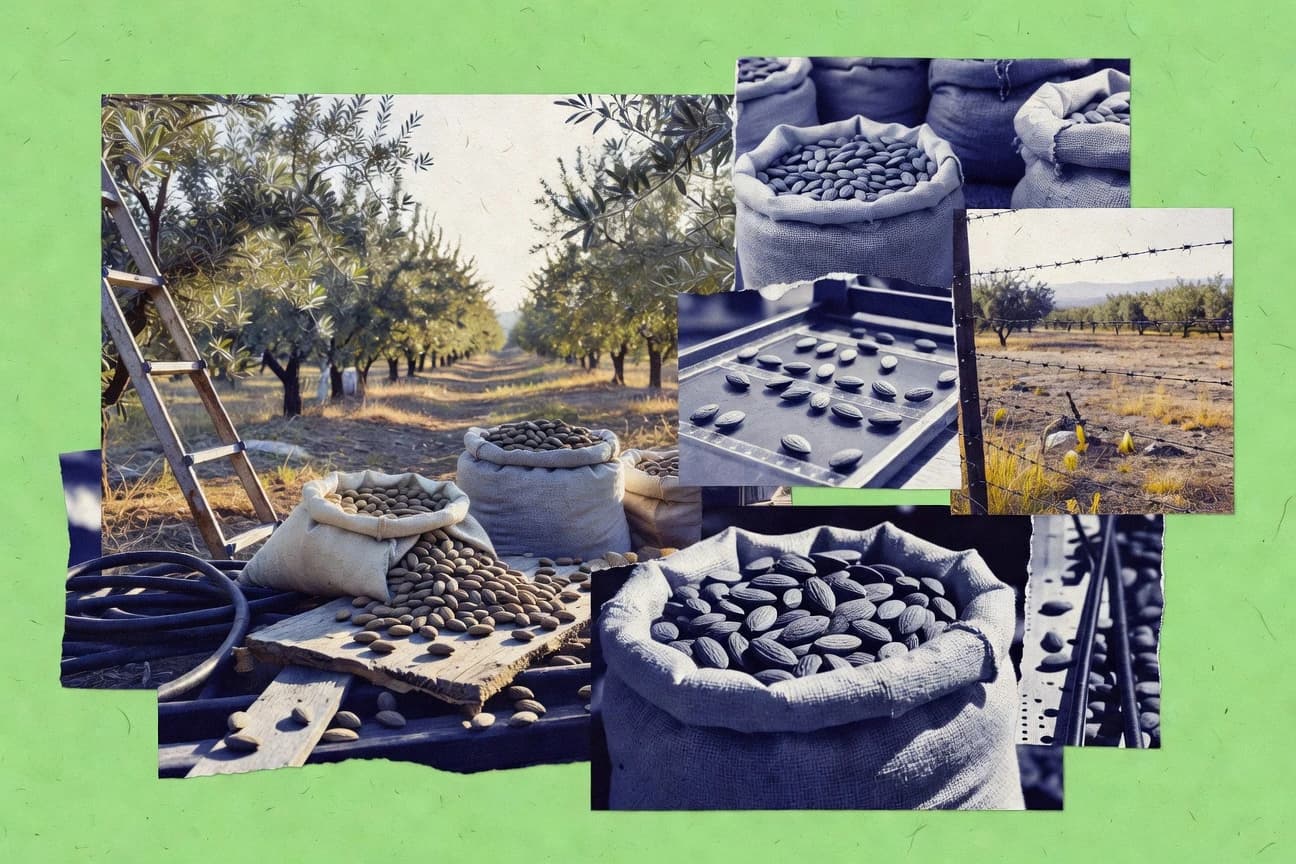

Global almond consumption reached about 5.0 million metric tons in 2022, while U.S. almond exports exceeded $5.0 billion in 2023. The closer look centers on orchard inputs, with irrigation often reported around 2 to 3 acre-feet per acre and emissions typically modeled near 1,000 to 1,500 kg CO2e per hectare. Regulatory requirements then shape the path from production to products, with EU allergen labeling under Regulation (EU) No 1169/2011 and FDA cGMP rules under 21 CFR Part 117 for human food facilities.
Key Takeaways
- Global almond consumption is estimated at about 5.0 million metric tons in 2022
- Total U.S. almond product exports exceeded $5.0 billion in 2023
- Almonds are one of the top 10 tree nuts in U.S. total nut consumption volume, at about 20% share by volume in 2022
- In-shell almond prices averaged around $3.20 per pound in 2021/22 (marketing year average)
- Almond growers received approximately $0.95 per pound in 2023/24 for processing-grade in-shell (price spread basis)
- California almond processing capacity is roughly 5 billion pounds per year (in-shell equivalent)
- Global irrigation water use per acre for almond orchards is commonly reported around 2–3 acre-feet per acre depending on conditions
- On-farm energy use for almond production is typically reported in the range of 200–400 kWh per acre per year depending on practices
- CO2-equivalent emissions for almond production are commonly modeled around 1,000–1,500 kg CO2e per hectare depending on yields and inputs
- The EU enforces mandatory allergen labeling for almonds due to FIC/Regulation (EU) No 1169/2011
- California’s almond industry operates under the state’s groundwater sustainability and irrigation regulations affecting water management plans
- The U.S. FDA requires nut products to follow current good manufacturing practices (cGMPs) under 21 CFR Part 117 for human food facilities
- Cold-pressed almond oil yield studies typically report about 40–55% oil recovery by weight of kernel under standard conditions
- Almond milk production typically uses about 8–10% almond solids by weight in finished beverages in commercial formulations
- Almond skin removal (blanching) yields kernel recovery often above 95% depending on blanching parameters
In 2022 global almond consumption hit 5.0 million metric tons, powering a booming worldwide export market.
Related reading
01 · Category
Trade & Consumption3 stats
01
Global almond consumption is estimated at about 5.0 million metric tons in 2022https://www.fao.org/faostat/en/
02
Total U.S. almond product exports exceeded $5.0 billion in 2023https://www.census.gov/foreign-trade/statistics/highlights/
03
Almonds are one of the top 10 tree nuts in U.S. total nut consumption volume, at about 20% share by volume in 2022https://www.statista.com/statistics/273574/tree-nut-sales-in-the-us-by-type/
Interpretation
Trade & Consumption Interpretation
In 2022, global almond consumption reached about 5.0 million metric tons and by 2023 U.S. exports topped $5.0 billion, showing strong demand that is reflected in the U.S. nut market where almonds held roughly a 20% share by volume in 2022 under the Trade and Consumption category.
02 · Category
Pricing & Economics3 stats
01
In-shell almond prices averaged around $3.20per pound in 2021/22 (marketing year average)https://www.ams.usda.gov/market-news?type=In%20Shell%20Almonds®ion=All
02
Almond growers received approximately $0.95per pound in 2023/24 for processing-grade in-shell (price spread basis)https://www.ams.usda.gov/market-news?type=Almonds®ion=All
03
California almond processing capacity is roughly 5 billion pounds per year (in-shell equivalent)https://www.cdfa.ca.gov/plant/pdcp/docs/almonds.pdf
Interpretation
Pricing & Economics Interpretation
For the Pricing and Economics angle, almond economics remain tight with 2021/22 marketing year in-shell prices averaging about $3.20 per pound while growers received only about $0.95 per pound in 2023/24 for processing-grade, even as California processing capacity reaches roughly 5 billion pounds per year, suggesting pricing power is largely captured downstream despite large scale.
03 · Category
Industry Trends4 stats
01
Global irrigation water use per acre for almond orchards is commonly reported around 2–3 acre-feet per acre depending on conditionshttps://ucanr.edu/sites/almonds/files/
02
On-farm energy use for almond production is typically reported in the range of 200–400 kWh per acre per year depending on practiceshttps://www.sciencedirect.com/science/article/pii/S0960148119304153
03
CO2-equivalent emissions for almond production are commonly modeled around 1,000–1,500 kg CO2e per hectare depending on yields and inputshttps://www.sciencedirect.com/science/article/pii/S0959652620304956
04
A life-cycle assessment study found almond processing contributes a minority share of total impacts versus orchard inputs (often <50% depending on system boundary)https://www.sciencedirect.com/science/article/pii/S0959652620310342
Interpretation
Industry Trends Interpretation
Industry trends show almond production’s biggest sustainability leverage is still at the orchard level because water use is typically about 2 to 3 acre-feet per acre and on-farm energy runs 200 to 400 kWh per acre per year, while processing usually accounts for less than half of life-cycle impacts.
04 · Category
Regulatory & Compliance7 stats
01
The EU enforces mandatory allergen labeling for almonds due to FIC/Regulation (EU) No 1169/2011https://eur-lex.europa.eu/eli/reg/2011/1169/oj
02
California’s almond industry operates under the state’s groundwater sustainability and irrigation regulations affecting water management planshttps://water.ca.gov/Programs/Groundwater-Management/SGMA
03
The U.S. FDA requires nut products to follow current good manufacturing practices (cGMPs) under 21 CFR Part 117 for human food facilitieshttps://www.ecfr.gov/current/title-21/chapter-I/subchapter-B/part-117
04
The EU sets maximum levels for aflatoxin in nuts including almonds under Regulation (EC) No 1881/2006https://eur-lex.europa.eu/eli/reg/2006/1881/oj
05
The EU sets maximum levels for pesticide residues in food including almonds under Regulation (EC) No 396/2005https://eur-lex.europa.eu/eli/reg/2005/396/oj
06
California Proposition 65 lists chemicals including acrylamide; food products may require warning labeling depending on exposure assessmenthttps://oehha.ca.gov/proposition-65
07
U.S. hazard analysis and preventive controls under FSMA for food facilities are codified at 21 CFR Part 117https://www.ecfr.gov/current/title-21/chapter-I/subchapter-B/part-117/subpart-C
Interpretation
Regulatory & Compliance Interpretation
For the Almond Industry’s regulatory and compliance landscape, the EU’s strict, ingredient-by-ingredient controls stand out, from mandatory allergen labeling under Regulation (EU) No 1169/2011 to maximum limits on aflatoxin (1881/2006) and pesticide residues (396/2005), alongside California and U.S. requirements that add further operational pressure for producers handling labeling, water management, and cGMPs.
05 · Category
Processing & Yield3 stats
01
Cold-pressed almond oil yield studies typically report about 40–55% oil recovery by weight of kernel under standard conditionshttps://www.sciencedirect.com/science/article/pii/S0308814618310614
02
Almond milk production typically uses about 8–10% almond solids by weight in finished beverages in commercial formulationshttps://www.sciencedirect.com/science/article/pii/S1756464616300149
03
Almond skin removal (blanching) yields kernel recovery often above 95% depending on blanching parametershttps://www.sciencedirect.com/science/article/pii/S0924224411001809
Interpretation
Processing & Yield Interpretation
For the Processing & Yield category, almond processing outcomes are consistently high and practical, with cold pressed oil recovery typically reaching 40 to 55 percent of kernel by weight while blanching delivers over 95 percent kernel recovery, and commercial almond milk formulations using roughly 8 to 10 percent almond solids in the finished beverage.
More related reading
06 · Category
Nutrition & Health6 stats
01
A randomized trial (PREDIMED) found Mediterranean diet supplemented with nuts including almonds reduced cardiovascular events vs control in long-term follow-up (2013 publication)https://www.nejm.org/doi/full/10.1056/NEJMoa1201831
02
A meta-analysis of randomized trials reported nuts (including almonds) improved LDL cholesterol by about 0.2 mmol/L on averagehttps://www.ncbi.nlm.nih.gov/pmc/articles/PMC3505149/
03
A 2015 meta-analysis found almond consumption increased satiety-related outcomes and helped improve appetite control in some studieshttps://www.ncbi.nlm.nih.gov/pmc/articles/PMC4555236/
04
A 2019 systematic review reported that tree nut intake was associated with improved glycemic control markers in people with or at risk of type 2 diabeteshttps://www.ncbi.nlm.nih.gov/pmc/articles/PMC6341452/
05
The American Heart Association notes that eating nuts (including almonds) as part of a heart-healthy diet may improve cholesterol levelshttps://www.heart.org/en/healthy-living/healthy-eating/eat-smart/fats/healthy-fats
06
A 2022 cohort study in JAMA Network Open linked frequent nut intake (including almonds) with lower cardiovascular mortality riskhttps://jamanetwork.com/journals/jamanetworkopen/fullarticle/2796459
Interpretation
Nutrition & Health Interpretation
Across randomized trials and observational research, regular almond and other nut intake is linked to meaningful nutrition and health benefits such as about a 0.2 mmol/L LDL cholesterol improvement on average and lower cardiovascular mortality risk, reinforcing their role in heart healthy diets.
07 · Category
Trade & Prices4 stats
01
$6.1 billion in U.S. almond exports was reported for 2022, all product forms combined, in the same OEC compilation of UN Comtrade trade data.https://oec.world/en/profile/bilateral-product/almonds
02
2.9% year-over-year growth in global almond exports (volume basis) was reported by the International Trade Centre (ITC) for the latest year shown in its trade statistics series.https://trademap.org/Country_SelProductCountry_TS.aspx?nvpm=1%7c%7c%7c%7c%7c%7c%7c%7c&intcode=0&cmd=ts&prod=080212
03
€6.2/kg average EU import unit value for almonds was shown in ITC trade statistics for the latest year in the series (HS 080212).https://trademap.org/Country_SelProduct_TS.aspx?nvpm=1%7c%7c%7c%7c%7c%7c%7c%7c&intcode=0&cmd=ts&prod=080212
04
15.9% of global almond imports were sourced from the United States in the most recent year shown in UN Comtrade/ITC trade statistics (HS 080212).https://trademap.org/Country_SelProductCountry_TS.aspx?nvpm=1%7c%7c%7c%7c%7c%7c%7c%7c&intcode=840&cmd=ts&prod=080212
Interpretation
Trade & Prices Interpretation
For the trade and prices angle, 2022 saw $6.1 billion in U.S. almond exports alongside a 2.9% year-over-year rise in global export volume, while EU import prices averaged €6.2 per kg and the United States supplied 15.9% of global imports, signaling steady growth with a meaningful but not dominant U.S. share in the market.
08 · Category
Market & Demand1 stats
01
19.4% of the global almond market was attributed to Europe’s almond demand in the latest year shown in the market segmentation presented by Mordor Intelligence’s market breakdown visuals.https://www.mordorintelligence.com/industry-reports/almond-market
Interpretation
Market & Demand Interpretation
Europe accounts for 19.4% of global almond demand in the latest market segmentation, underscoring that European consumption is a sizable driver shaping overall market demand dynamics.
09 · Category
Regulation & Processing6 stats
01
1,534 U.S. establishments were identified as active in NAICS 311421 (Nut & Seed Processing) in 2022, providing the processing base for products like almonds (in-shell and kernels).https://data.census.gov/table?q=311421&y=2022
02
21 CFR Part 117 (Current Good Manufacturing Practice and Hazard Analysis for Food) requires preventive controls for human food facilities; the regulation is codified as 21 CFR §117.130 through §117.175 (including recall plans).https://www.ecfr.gov/current/title-21/chapter-I/subchapter-A/part-117/subpart-F/section-117.139
03
FSMA preventive controls regulations for human food are implemented under 21 CFR Part 117, including allergen considerations; the regulation section for allergen control includes §§117.80–117.105 (as posted in the electronic CFR).https://www.ecfr.gov/current/title-21/chapter-I/subchapter-A/part-117/subpart-C/section-117.80
04
U.S. FDA’s cGMP for food facilities are enforced under 21 CFR §117.35 for sanitation controls; the specific sanitation control requirement appears as a quantitative compliance standard referenced in the CFR text.https://www.ecfr.gov/current/title-21/chapter-I/subchapter-A/part-117/subpart-B/section-117.35
05
The EU’s official food additive and processing aid framework requires compliance for labeling and safe use; specifically, the EU’s General Food Law Regulation (EC) No 178/2002 establishes traceability obligations (Article 18) relevant to almond ingredient chains.https://eur-lex.europa.eu/eli/reg/2002/178/oj
06
The EU’s Novel Foods Regulation (EU) 2015/2283 establishes authorization requirements for new almond-derived products like almond protein isolates sold as novel foods; the regulation’s core authorization trigger is quantified at application and risk assessment steps.https://eur-lex.europa.eu/eli/reg/2015/2283/oj
Interpretation
Regulation & Processing Interpretation
In the Regulation and Processing category, 1,534 active U.S. nut and seed processing establishments in 2022 operate under stringent preventive controls and sanitation requirements such as 21 CFR Part 117, while EU rules add further compliance layers through food additive labeling and the Novel Foods authorization framework for new almond-derived products.
10 · Category
Risk & Safety2 stats
01
0.01% of nut shipments were found to exceed critical limits for Salmonella in a compiled food safety dataset summarized by the European Commission’s Rapid Alert System for Food and Feed (RASFF) analytics for products in this category (latest period in the dataset).https://webgate.ec.europa.eu/rasff-window/screen/search
02
1,500 ppm is the maximum recommended action level threshold for aflatoxin in many HACCP-based nut programs (including almond sorting/segregation triggers) used by industry guidance documents referenced in FSIS/FDA-aligned programs.https://www.federalregister.gov/documents/2006/07/19/06-5851/aflatoxin-determination-and-response-levels-in-food
Interpretation
Risk & Safety Interpretation
From a risk and safety perspective, the Almond Industry shows strong control since only 0.01% of nut shipments exceeded critical Salmonella limits in a large EU food safety dataset, while aflatoxin programs commonly use a clear 1,500 ppm maximum action threshold for HACCP-based monitoring.
report visual · Key figures
Where almonds’ demand and trade are concentrated
Recent trade and market breakdowns show major almond demand and sourcing patterns by region, led by Europe and the U.S.
19.4%
19.4% of the global almond market was attributed to Europe’s almond demand in the latest year shown in the market segmen
15.9%
15.9% of global almond imports were sourced from the United States in the most recent year shown in UN Comtrade/ITC trad
2.9%
2.9% year-over-year growth in global almond exports (volume basis) was reported by the International Trade Centre (ITC)
€6.2
€6.2/kg average EU import unit value for almonds was shown in ITC trade statistics for the latest year in the series (HS
$6.1 billion
$6.1 billion in U.S. almond exports was reported for 2022, all product forms combined, in the same OEC compilation of UN
source-verifiedmordorintelligence.com · trademap.org · oec.world2022
Reference
Cite This Report
This report is designed to be cited. We maintain stable URLs and versioned verification dates. Copy the format appropriate for your publication below.
APA
Catherine Wu. (2026, February 13). Almond Industry Statistics. Gitnux. https://gitnux.org/almond-industry-statistics
MLA
Catherine Wu. "Almond Industry Statistics." Gitnux, 13 Feb 2026, https://gitnux.org/almond-industry-statistics.
Chicago
Catherine Wu. 2026. "Almond Industry Statistics." Gitnux. https://gitnux.org/almond-industry-statistics.
Sources & references
39 datasets cited across this report
+18 additional datasets cited (not shown individually)