Market data
Transportation Vehicles
Explore verified transportation vehicles statistics and market research reports with sourced data and trend analysis.
Latest update:
 Rajesh Patel

Uk Car Industry Statistics
UK automotive added £82bn to GDP in 2022—then exports hit 728,628 cars in 2023 (94% of production). Explore the figures behind the sector.
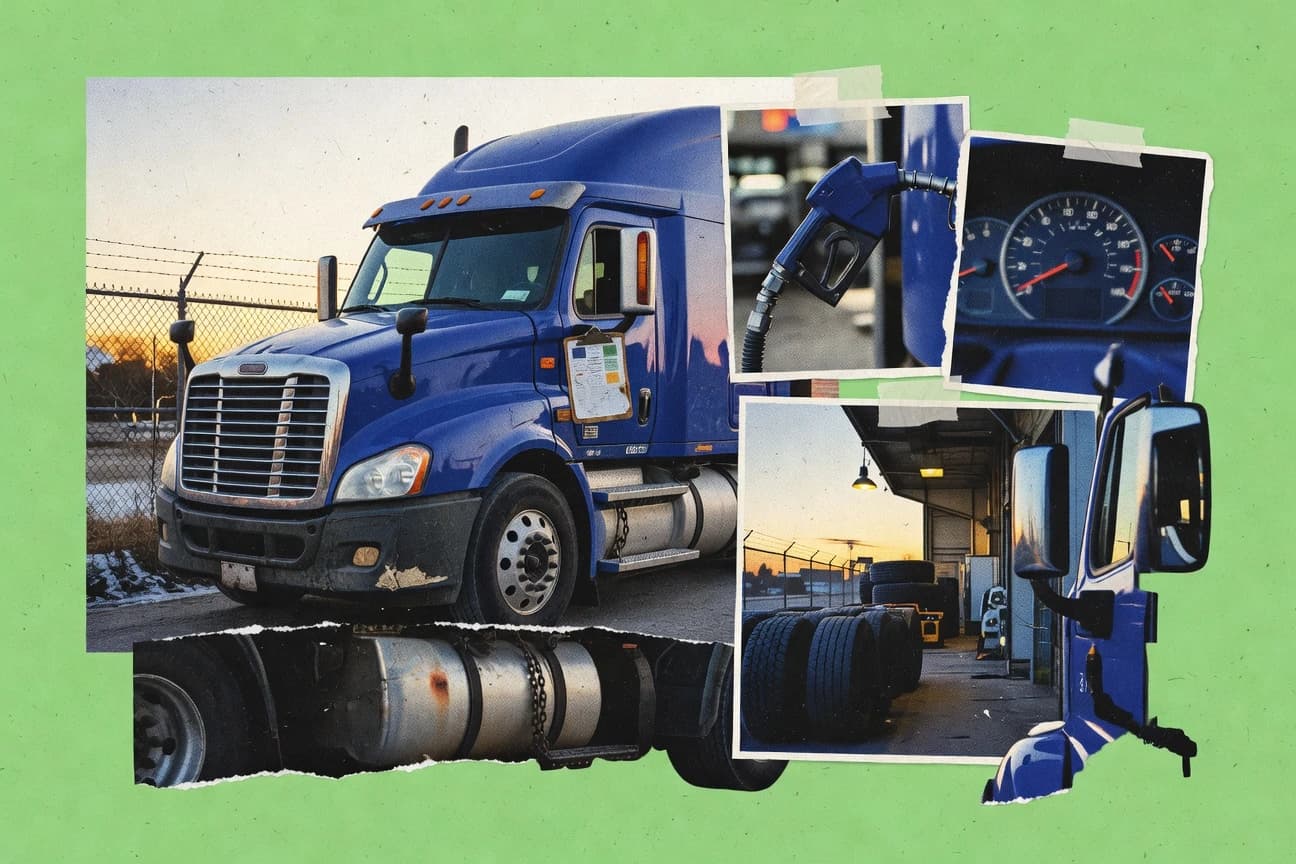
Diesel Truck Industry Statistics
Over 90% of new on-road diesel trucks in the U.S. have diesel particulate filters (DPFs)—how that shapes compliance, costs, and air quality.

Russia Auto Industry Statistics
Imports surged to 1.2M vehicles in 2023—90% from China—reshaping Russia’s car supply. Explore employment, production, and market share shifts.
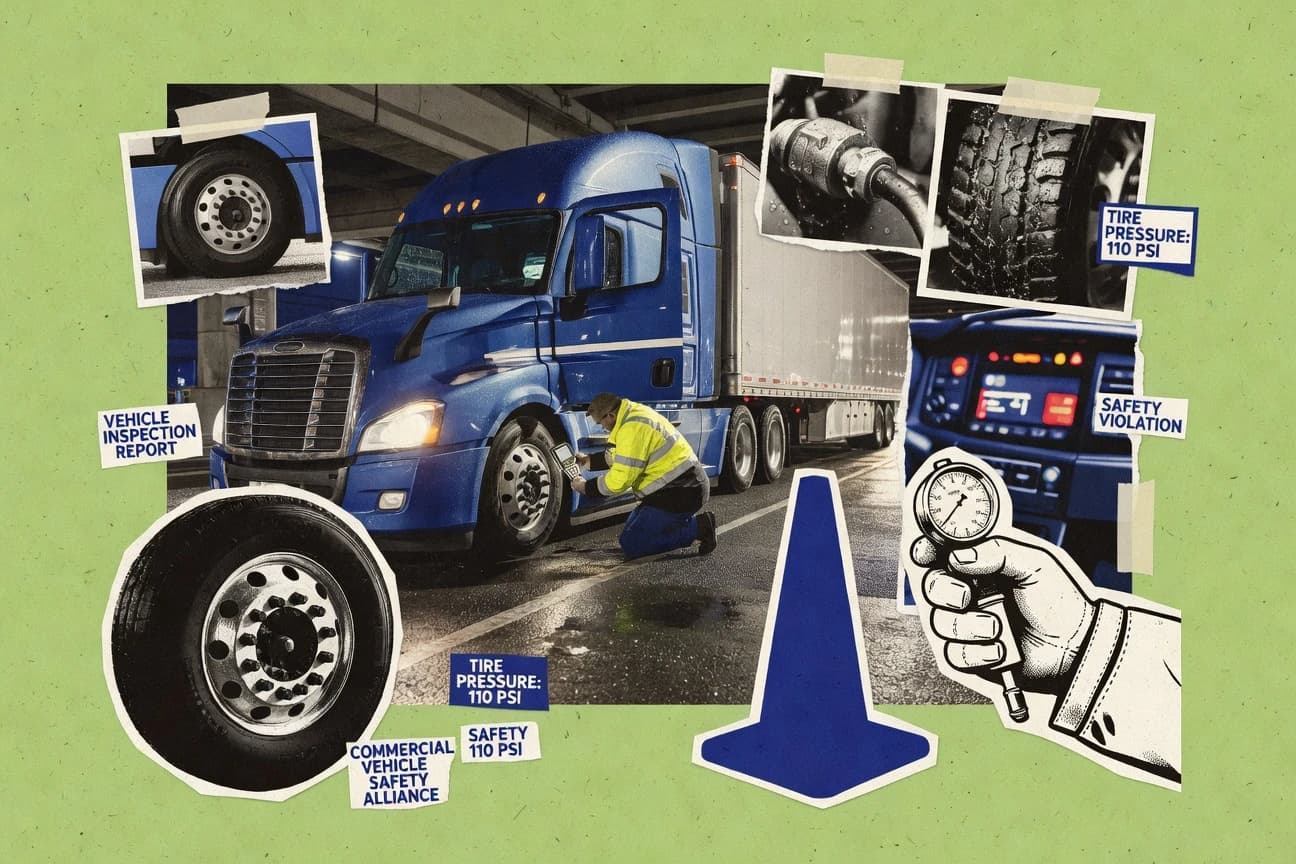
Commercial Vehicle Safety Industry Statistics
Fatigue is cited in 13% of large-truck crashes—then learn which interventions help stop the next one, from driver tech to maintenance.
Mexico Automotive Industry Statistics
Mexico exported 3.2M vehicles in 2023—83% headed to the US. Explore how nearshoring is reshaping auto trade and investment.

South Africa Auto Industry Statistics
BEVs were just 5,000 on South Africa’s roads in 2023—what that rarity means for demand and the aftermarket auto industry.
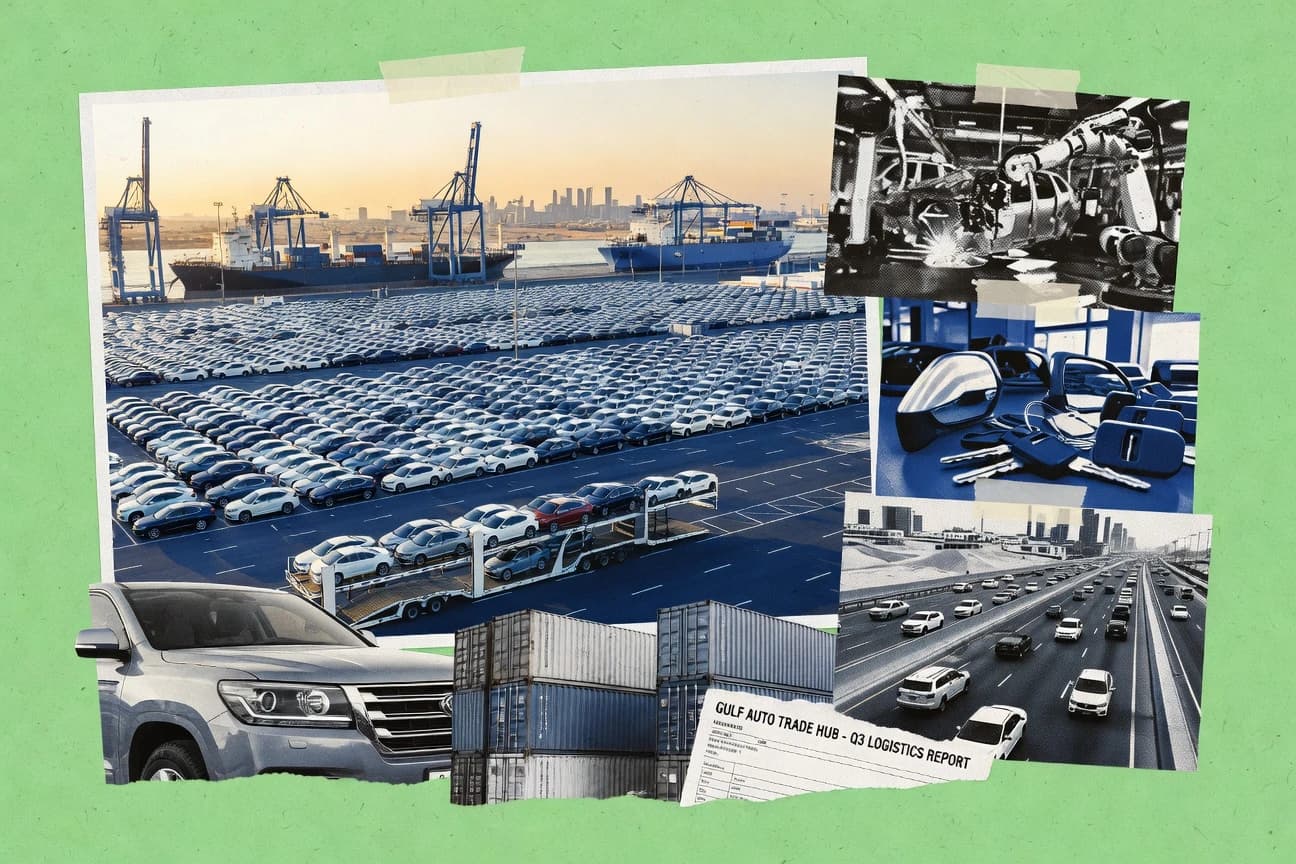
Middle East Auto Industry Statistics
Saudi Arabia’s auto sector created 50,000 new jobs in 2023 via localization—find out what’s driving growth in hiring and output.
Truck Statistics
U.S. combination trucks reached 3.59 million in 2022—see how registration scale ties into costs, fuel use, and operational performance.

Indonesia Motorcycle Industry Statistics
Indonesia sold 5.18M motorcycles in 2023—up from 4.74M in 2022. Discover what drove the rebound, from brands to regulations.
South Korea Ev Industry Statistics
South Korea’s public fast-charger network grew to 48,000 by end-2023—see what that means for EV growth and access in the Korean market.

International Boat Industry Statistics
In 2023, 82 piracy and armed robbery incidents were reported worldwide—learn how safety risks are shaping the international boat industry.
Heavy-Duty Truck Industry Statistics
Hydrogen fuel-cell heavy-duty trucks were just 0.1% of global sales in 2023—early deployment is real. See where EVs and other alternatives stand.
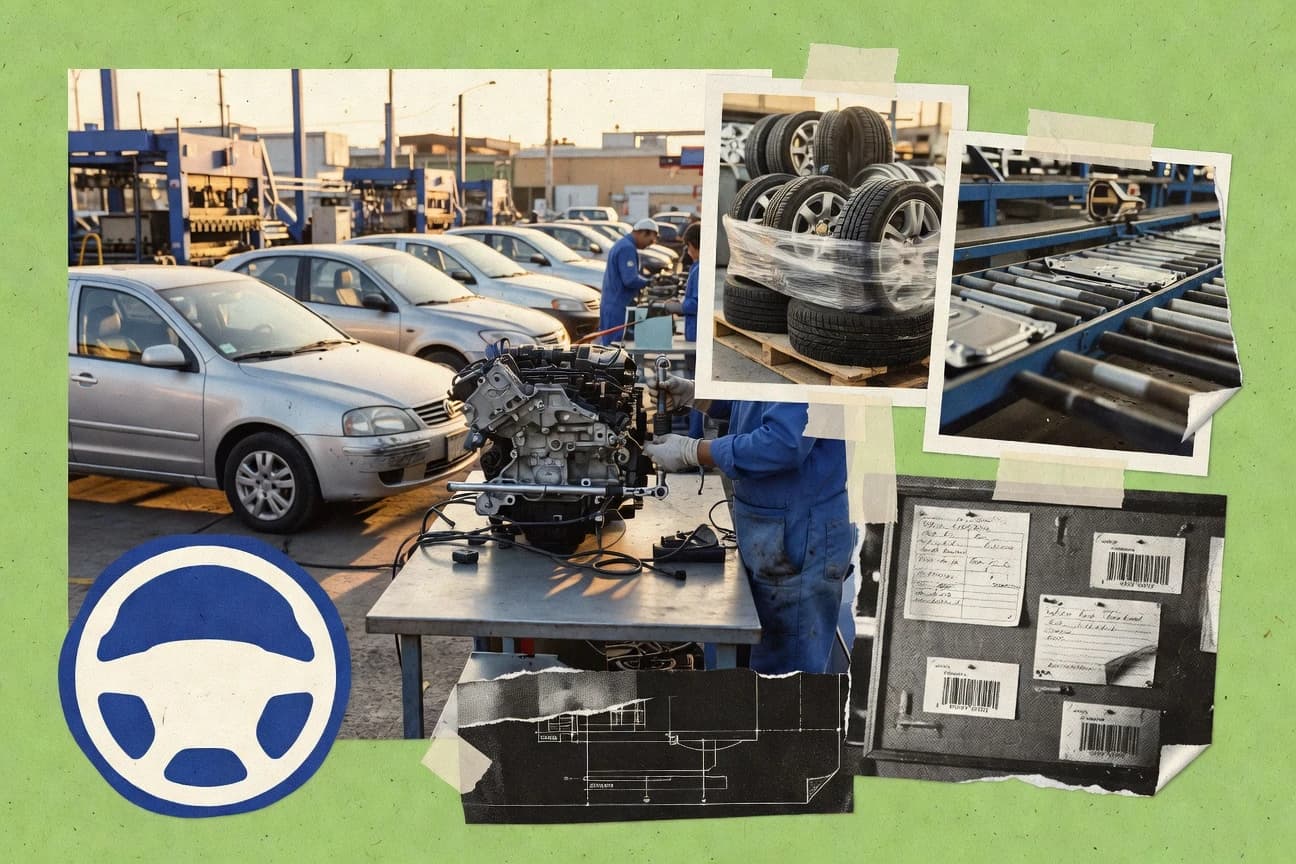
Serbia Automotive Industry Statistics
With US$10.2B in automotive parts and components imported in 2023 and an input-cost tariff average of 3.9%, see what drives Serbia’s automotive supply-chain costs.

Motorcycle Owner Statistics
81% of US motorcycle owners are male—find how demographics and riding habits influence spending, maintenance, and crash risk.

Autonomous Vehicle Statistics
Waymo drove 20 million autonomous miles in 2023 with 88% fewer crashes than human drivers—see the safety record behind the numbers.

Electric Scooter Industry Statistics
Women are 42% of e-scooter users in 2023 (up from 30% in 2020)—discover the data on adoption, market growth, and safety.

Snowmobile Industry Statistics
62% of U.S. snowmobilers are married with $100k+ household income—explore how family-driven spending fuels demand.

Japan Truck Industry Statistics
Japan exported 123,456 trucks in 2023 (+7.8% YoY). Discover the trade and market data shaping the country’s truck industry—by segment, brand, and destination.

Rv Sales Statistics
In 2023, US total RV wholesale shipments hit 312,104 units—a 24% drop from 2022’s record. See the Rv Sales breakdown by category.

Russia Automotive Industry Statistics
1.2 million workers drive Russia’s automotive industry in 2023—localization added 150,000 jobs. Explore employment, wages, and trade data.