GITNUX MARKETDATA
Browse Our Category
Transportation Vehicles
Latest update:


Shipbuilding Maritime Naval Industry Statistics
Shipbuilding and maritime naval trends are tightening in 2026, with delivery and contract signals that look notably different from the prior cycle. See which segments are pulling ahead and which are slipping, so you can separate near term momentum from long term capacity reality.

Motorbike Statistics
Global production is still roaring, with 222 million motorcycles built in 2023 and an estimated 1.0 billion plus two wheelers on the road, yet the money and policy focus is shifting fast with electric two wheelers climbing 12% year on year in China and safety systems like ABS spreading as standards tighten. From helmet compliance that still varies sharply by country to real world charging and efficiency figures, this page pinpoints the contrasts that shape what riders buy, how bikes are built, and who ends up safer.
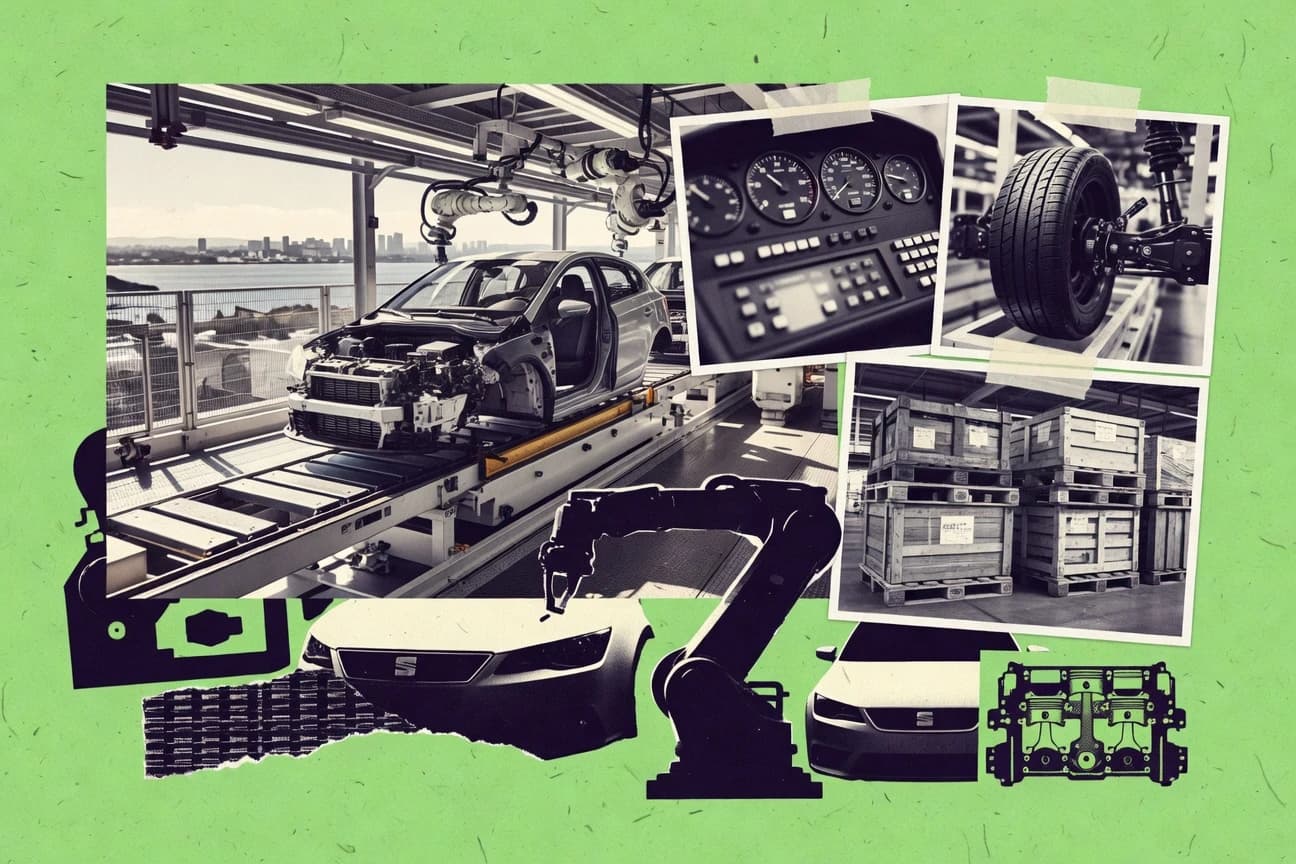
Spain Automotive Industry Statistics
Spain’s auto industry is showing a sharp split between production momentum and sales reality, with 2026 vehicle production still set to rise while registrations remain under pressure. Get the latest figures and see exactly how electrification, supply constraints, and consumer demand are reshaping the country’s road to growth.
Top 10 Automotive Industry Statistics
From EV adoption and battery cost targets to cybersecurity and safety, this Top 10 Automotive Industry stats roundup ties the most telling 2030 and 2025 projections to what is actually happening now, including the global automotive cybersecurity market expected to reach $76.5 billion by 2030 and 72% faster incident resolution with fully deployed SOAR. It also puts surprising tradeoffs front and center like 39% of organizations facing ransomware in 2023 and 94% of U.S. shoppers relying on online research, so you can see where performance gains and real risk are likely to collide next.

Uk Motor Industry Statistics
With 2026 and 2025 figures shaping the latest picture of the UK motor industry, this page spotlights the moments where volumes and market behaviour don’t move in sync. Expect clear, data backed contrasts across production, demand, and electrification that make the direction of travel harder to ignore.

Sweden Automotive Industry Statistics
Sweden’s automotive industry statistics capture how fast the balance is shifting, with 2025 figures revealing where production, demand, and investment are pulling in opposite directions. If you want to understand why recent growth in key segments feels uneven rather than straightforward, this is the clearest place to see it.

Boat Industry Statistics
What the latest boat industry numbers reveal is a sharper break between demand and capacity, with 2025 showing the clearest signal yet. See how orders, delivery timelines, and pricing pressure are shifting together so you can separate short term noise from what is likely to stick.
Saudi Automotive Industry Statistics
Saudi automotive demand isn’t just growing it is shifting, with the latest production and vehicle registrations pointing to a market that is moving faster than the headline figures suggest. Read the page to see how 2025 trends in manufacturing output and sales are redrawing what “on the road” looks like across the Kingdom.

Miami Marine Industry Statistics
Miami Marine Industry statistics in 2026 reveal just how fast activity is shifting, with key markers that move from steady demand to real operational pressure. If you rely on marine work in South Florida, these numbers will help you separate what is growing from what is already straining capacity.

Marine Boating Industry Statistics
With 2025 and 2026 figures now in view, this page lays out how marine boating demand, dealership and service momentum, and buyer behavior are shifting in ways many owners still miss at the dock. You will spot the sharp contrast between expectations and what the latest numbers actually show, so you can plan decisions with fewer guesses.

Commercial Vehicle Industry Statistics
Commercial Vehicle Industry statistics reveal where the fleet pipeline is tightening and where it is breaking free, with 2025 figures that make the shift impossible to ignore. Get the hard numbers on demand, supply pressures, and operational costs side by side to see which changes are already reshaping planning decisions.

Luxury Yacht Industry Statistics
Luxury Yacht Industry statistics bring you the clearest view yet of what’s fueling demand, from a 2025 jump in new-build orders to shifting buyer preferences that are upending traditional expectations. If you want to understand where the market is headed next, these current figures highlight the real tension between rising spend and changing specifications across the fleet.

Motorcycle Statistics
The global motorcycle helmet market is set to grow at a 9.1% CAGR from 2024 to 2030 while major safety signals keep pushing the debate toward head protection that still varies widely by rider behavior. Compare the USD 13.6 billion motorcycle accessories market and the USD 9.4 billion electric motorcycle revenue in 2023 with crash outcomes where helmeted riders face markedly lower death risk and different injury severity, plus the tradeoffs behind costs, standards, and emerging connected safety tech.

Shipbuilding Maritime Industry Statistics
Shipbuilding and maritime leaders are tracking a sharp 2025 shift in output and order momentum, and the page makes the contrast impossible to miss across key segments. See how the latest delivery, tonnage, and contract trends are reshaping where investment is heading next, and which signals are strongest right now.

Pontoon Industry Statistics
See how Pontoon Industry’s workforce and talent performance shifted, with 2026 figures putting new pressure on time to talent and delivery outcomes. The contrast between what teams reported last year and what the latest benchmarks demand makes the practical impact hard to ignore.
Today Automotive Industry Statistics
Auto industry momentum looks sharper than most people expect, with 2026 traffic and production expectations pointing to a meaningful shift in how demand is shaping the supply chain. See which key indicators are moving fastest and what that implies for prices, investment, and the next wave of model launches.

Ebike Statistics
North America has already passed $4.9 billion in e-bike market revenue in 2023, while EU e-bikes made up 17% of new registrations in 2023, and the practical payoff is just as striking with 76% of users reporting they swap in an e-bike for a car at least occasionally. The page also tracks the engineering and economics that make those choices stick, from 25 km/h cutoffs under EU rules to battery price drops of 89% since 2010 and the cost of ownership that can run 50 to 80% lower for short urban trips.

Recreational Vehicle Industry Statistics
RV demand keeps rising while household ownership stays tight, with 3.6% of U.S. households owning an RV and the global market projected to grow at 6.0% CAGR from 2024 to 2030. This page connects the throughput and spending signals to what actually drives buying and planning, from 19% of RV purchases via online dealers to the fact that 49% of owners reported at least one maintenance issue last year.

Poland Automotive Industry Statistics
Poland Automotive Industry statistics lay out how production and employment are shifting in 2025, where output is either regaining momentum or getting squeezed by the next bottleneck. You will also see what is happening to investment and vehicle demand across the supply chain, so the headline growth and the daily pressure points become impossible to ignore.

Enclosed Trailer Industry Statistics
See how enclosed trailer demand and pricing pressures shifted into 2025, with the most revealing signals coming from where fleets are buying and how long units are sitting before they move. If you think the market is steady, these Enclosed Trailer Industry stats will likely change your assumptions fast.