GITNUX MARKETDATA
Browse Our Category
Transportation Logistics
Latest update:


Tolling Industry Statistics
Tolling is no longer a niche revenue stream but the fastest way to measure how infrastructure funding, technology, and traffic management are converging, with USD 200 billion in global investment from 2020 to 2025 and ETC now reaching 85% of toll lanes by 2023. Follow the scale jump from 5,000 U.S. tolled lane miles to China’s 160,000 km expressways and the shift to all electronic operations, where daily flows can swing from 500,000 vehicles at Delhi’s busiest toll plaza to a 2% U.S. evasion rate after ETC rollout.

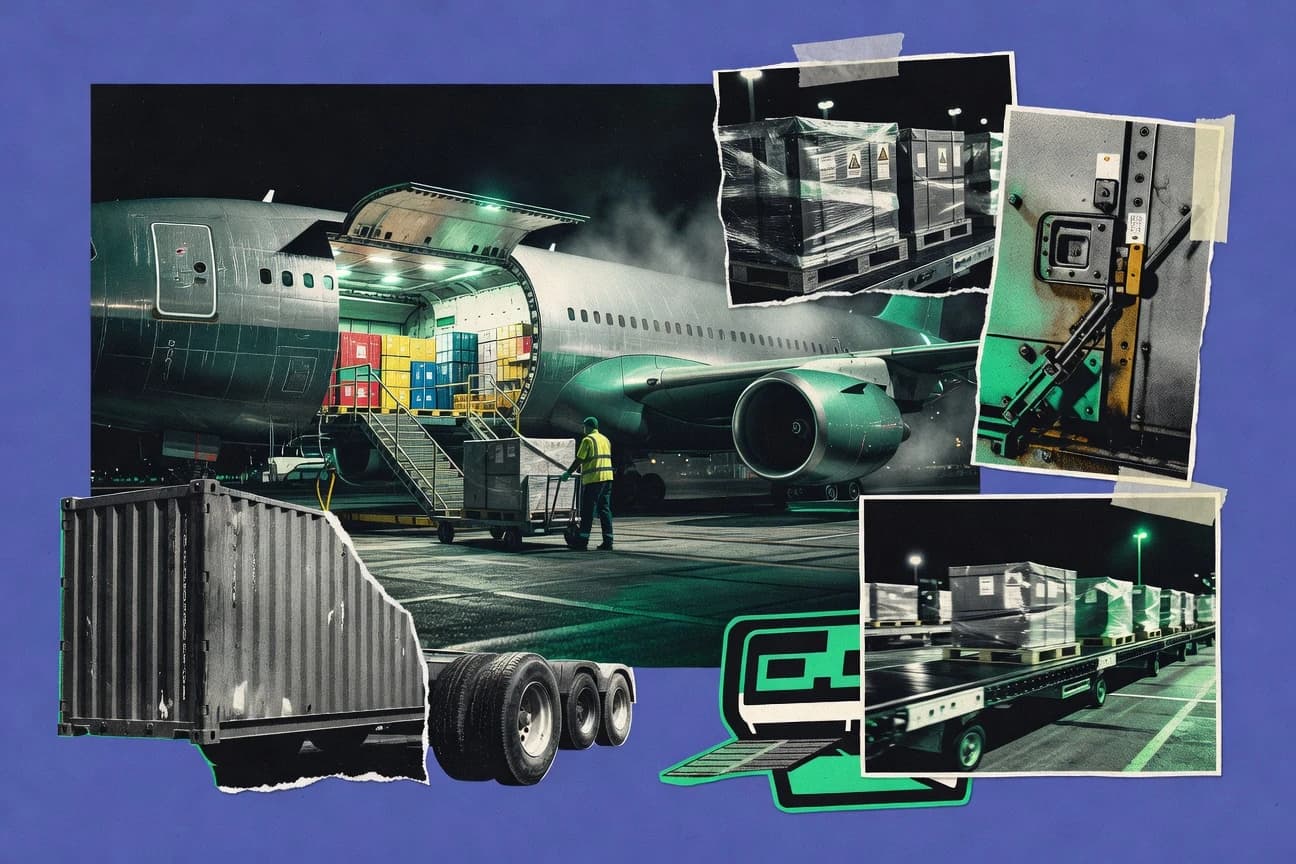
Cargo Industry Statistics
Air freight is still proving it can move faster than the industry’s mood, with global air cargo projected to climb from USD 139.64 billion in 2023 to USD 192.85 billion by 2030, and automation forecasts pointing to USD 1.5 trillion in annual savings by 2030. This page stitches together carrier realities and transport infrastructure shifts, from UPS, FedEx and DHL volumes to port throughput, canal transits, and the emissions push toward net zero.
World Air Cargo Statistics
Global air cargo capacity climbed 5.2% in 2023 to 225 billion ATKs while load factor rose to 54.3%, even as freighter utilization averaged 62% and belly capacity slipped to 48% of total ATKs by Q4. Track how demand, capacity shifts, and regional contrasts from Asia Pacific to Europe are reshaping capacity planning, yield pressure, and where the next growth is likely to land.

Japan Taxi Industry Statistics
Japan’s taxi story has shifted fast. With daily nationwide app bookings hitting 2.5 million in 2023 Q4 and cashless payments reaching 65% of transactions, this page maps how apps, peak hour surges, and a rising share of airport and late night trips are reshaping demand while Tokyo’s cleanliness and politeness scores stay at 92% and 88%.

Brazil Truck Industry Statistics
Brazil’s truck economy keeps pulling weight while moving toward what comes next, with R&D investment hitting R$4.2B in 2023 and electric plans accelerating toward R$10B by 2027. You will find fresh demand and production signals for what is set to sell and ship next, including 2025 sales expected to reach 220,000 units per Anfavea and the fleet projection to 2.8 million units by 2030 alongside targets to cut 20% of emissions by 2030.

Shipping Logistics Industry Statistics
Freight markets are paying a premium for speed and risk, with Red Sea war risk premiums surging 300% while port handling averages $250 per TEU at major hubs and inland haulage runs $450 per TEU. Track how the 2023 pulse of the industry swings from $38 billion in shipping insurance and $15 billion in demurrage and detention to a global logistics market worth $8.12 trillion and emissions now shaped by IMO carbon-intensity targets.

Trucking Industry Statistics
With revenue at $940.8 billion in 2022 and fuel costs still climbing to $172 billion, this page tracks why trucking keeps driving the economy while getting squeezed on costs and capacity. It also connects workforce churn and safety progress to the latest signals, including 2025 growth projections to $1.2 trillion by 2028 and 98% ELD compliance in 2023, so you can see where momentum is real and where risk is hiding.

Courier Delivery Industry Statistics
Delivery speed is winning attention, yet cost and sustainability are driving churn, from China’s 90% expectation of next day delivery to 65% of global shoppers abandoning carts over high fees and 35% of UK customers switching couriers for greener options. Real operational scale and momentum back it up, with the global CEP market rising from USD 413.9 billion in 2023 toward USD 616.2 billion by 2030 and 67% of customers using smartphone apps for real time tracking.

Auto Transport Industry Statistics
Auto transport in the U.S. generated $28.5 billion in GDP in 2023 while paying $2.9 billion in wages, yet drivers still face a 78% turnover rate and safety pressure is visible through a 1.2 per million miles crash rate. Scroll for the industry’s full snapshot from fuel spend of $4.1 billion and 15% reinvestment in capital to how apps drove 52% growth in door to door bookings and tech cut fuel use by 11% for top haulers.

Ride Sharing Industry Statistics
Ride Sharing Industry’s 2026-ready snapshot puts the workforce and safety reality side by side, from Uber’s 72% male driver share aged 25 to 50 to a 99.9% incident-free trips rate worldwide. You will also see where earnings churn hits hardest, with 29% of U.S. drivers quitting within their first year, alongside market scale reaching 2.8 billion users globally in 2023 and 15 million job roles supported.

Warehouse Industry Statistics
U.S. warehousing added 150,000 jobs in 2023, yet turnover averaged 40% annually and women still make up only 35% of the workforce, even as hiring difficulties keep rising among warehouse managers. For 2025 readers, the page tracks how automation, WMS adoption, and tighter safety and productivity metrics are reshaping shifts, wages, and global labor needs that could total a 2 million worker shortfall by 2025.

Box Truck Industry Statistics
Box trucks backed $150 billion in U.S. GDP in 2023 and moved 15% of America’s freight value, while global box truck logistics revenue reached $280 billion and U.S. fleets still spent $45 billion on fuel. Workforce pressure is the real hinge at 450,000 U.S. drivers plus 65% of operators reporting shortages, so this page connects economics, taxes, safety, and the operational bottlenecks that shape next step demand.

Fleet Management Industry Statistics
Telematics is already pushing fleets toward measurable control, cutting fuel use 10 to 15 percent and cutting unplanned downtime from 8 percent to 3 percent, with an average 3:1 ROI in the first 12 months. Meanwhile, the market is scaling fast, with global fleet management projected to reach 52.45 billion by 2030, so this page lays out the tradeoffs between cost savings, routing discipline, and safety gains before you invest in the wrong lever.

Coach Bus Industry Statistics
Coach and bus operators are managing a workforce of 5 million while fleets top 2.5 million worldwide, yet modern coaches now cut maintenance and operational stress with predictive IoT and rising electrification, including electric coach sales growing to 15% of new purchases in 2023. Track how demand rebounds to 85% of pre-COVID capacity in 2023 and how safety, emissions, and utilization translate into real capacity decisions across regions from Europe’s 120 billion annual km to Australia’s 6,200 tourism vehicles.

Maritime Industry Statistics
With demand for seafarers projected to grow by 13% from 2022 to 2027 and shipboard turnover running at 10 to 15% every year, the maritime workforce is under real pressure, even as women remain only about 2% of the total and Filipino seafarers lead at 400,000. Pair that human strain with hard operational signals like the IMO push for a 40% carbon intensity cut by 2030 and 1.076 billion tonnes of CO2 emissions in 2018, and you get a page that explains why crews and decarbonization plans are now moving on the same timetable.

Germany Logistics Industry Statistics
Germany Logistics Industry numbers for 2025-ready planning and 2023 results side by side, from a projected shortage of 100,000 skilled logistics workers by 2025 to overtime averaging 150 hours per employee. See how Germany still powers Europe with 13,200 km of highway and 7.4 million TEUs through Hamburg while digital talent and automation lag behind in key management roles, sharpening the tension between growth and workforce constraints.

E-Commerce Logistics Industry Statistics
E-commerce logistics costs are getting squeezed from both ends with last mile taking 53% of spend in 2023 and peak surcharges pushing delivery fees up 30% while fuel and labor keep rising. At the same time, performance is tightening fast as on time delivery reaches 92% in Q4 2023 and GPS tracking cuts global last mile failure to 1.8%, setting up a clear tension between higher expenses and measurable service gains.

Container Shipping Industry Statistics
EU ETS now applies to half of container ship CO2 from 2024, but fleet readiness is uneven with 15% of ships rated D or E and EEXI retrofits looming for 70% of vessels over 400 GT. At the same time, capacity keeps climbing with 25.52 million TEU in service by January 2024 and 5.72 million TEU in the Q4 2023 orderbook, while greener orders and efficiency gains, from green methanol of 2.5 million TEU to 25% better energy efficiency since 2012, force a sharp question for 2025 and beyond.

Fleet Industry Statistics
From telematics-driven fuel cuts and predictive maintenance that slashes downtime to route optimization and tire savings that move budgets fast, this page tracks the practical levers that cut fleet TCO. Expect sharp, current signals like 22 percent lower TCO for SMEs with leasing and 55 percent outsourcing penetration in Europe alongside the industrywide shift toward telematics, EV charging savings, and smarter procurement.

Transportation Network Company Industry Statistics
With Uber active consumers reaching 150 million in Q1 2024 alongside 4.1 million active U.S. TNC drivers, this page shows how supply and demand are tightening while earnings and retention still wobble. You will also see what drivers really look like and what safety and regulation demand at scale, from 70% quarterly retention at Uber to 750,000 global panic button presses in 2023.