Market data
Social Issues Societal Trends
Explore verified social issues societal trends statistics and market research reports with sourced data and trend analysis.
Latest update:
 Margot Villeneuve

Global Hunger Statistics
Fresh IPC outlooks and 2024 projections place 258 million people in severe acute hunger, while earlier global figures already show hunger is not evenly shared, with Asia holding 45% of the world’s wasted children under 5. The page connects these acute pressures to food loss, conflict and funding gaps, so you can see why hunger keeps rising even as cereal trade and aid flows shift.
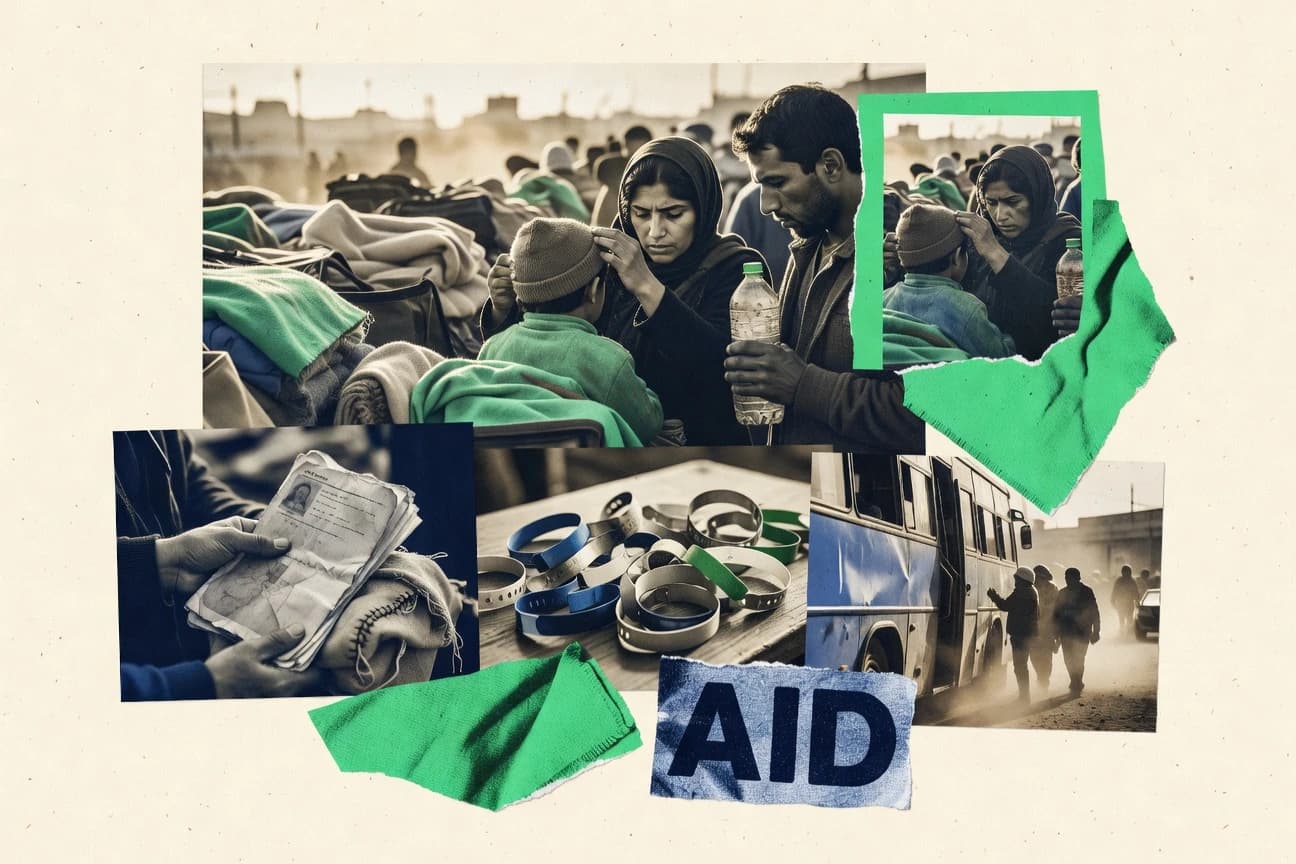
Global Refugee Statistics
See how forced displacement is reshaping life worldwide, from the 2026 record-high pressure on asylum systems to shifting origins of people seeking safety. This page brings the latest Global Refugee statistics into one clear view so you can spot the changes that policy decisions often miss.

Reason For Abortion Statistics
Get the real figures behind the most common reasons for abortion, including the shift seen in the latest 2026 data. The page connects those numbers to what people report deciding in practice, where access and medical circumstances often outweigh politics.

Prostitution Age Statistics
Prostitution Age brings you the clearest picture yet of how prostitution demand and purchasing behavior are shifting in 2026, with standout age split contrasts that challenge what many assume. If you have been relying on older headlines, these 2026 figures will recalibrate your understanding fast.

Youth Homeless Statistics
What’s most urgent for youth homelessness right now is the sharp contrast between growing need and the help that does not reach everyone. Start with the latest 2025 figures and the page breaks down the key statistics behind what drives young people onto the streets and where the biggest gaps show up.

Lgbt Discrimination Statistics
Even with growing legal protections, many LGBTQ people still face day to day risk, with 52% of LGBTQ adults saying they often or sometimes avoid public places because of safety concerns and 1.8 times the odds of depression among people who experienced discrimination. At school, the pattern is just as stark with 57% of LGBTQ youth reporting teachers never or rarely intervened and 1.3 times higher odds of discrimination for LGBTQ people than for non-LGBTQ people.
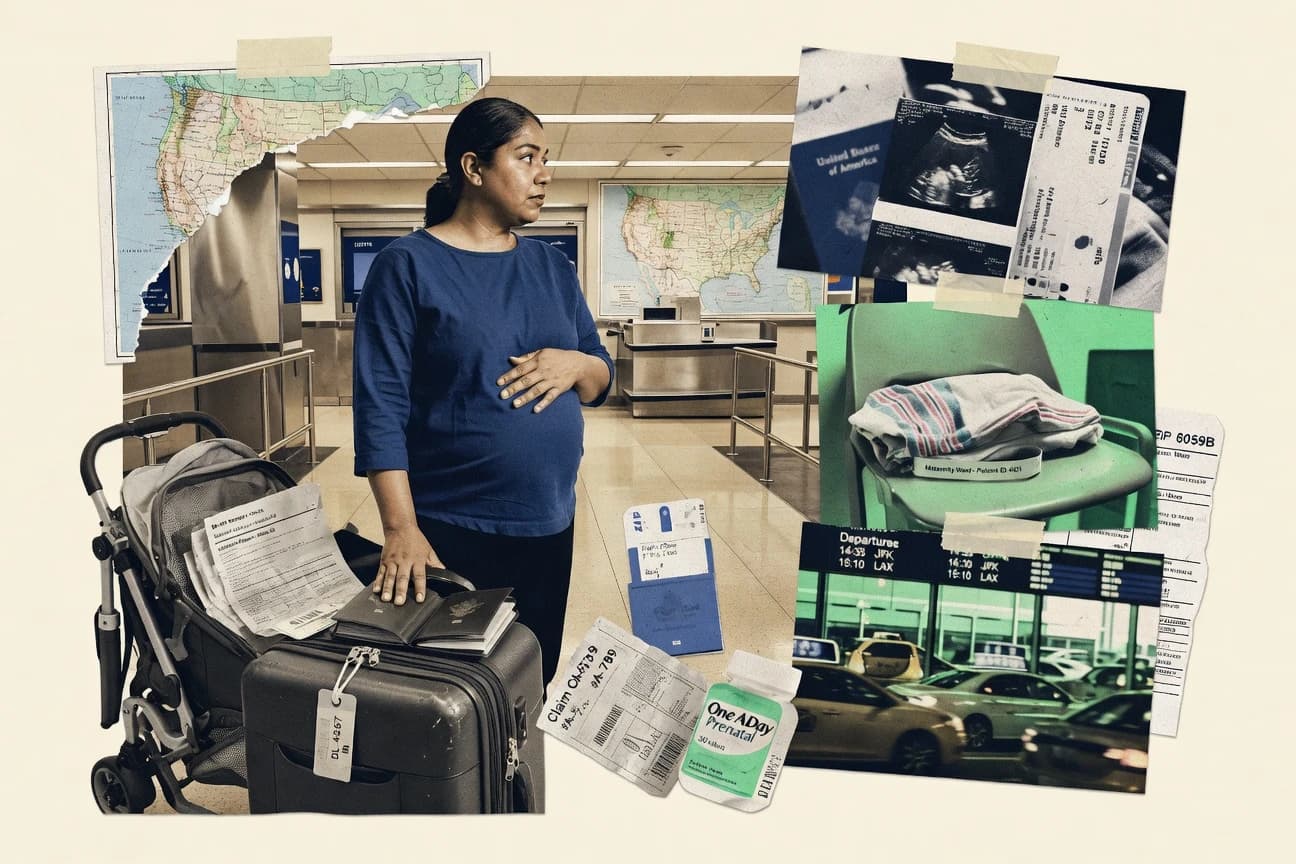
Birth Tourism Usa Statistics
There is no U.S. government count that tracks how many visitors come specifically for birth tourism, so this page pieces together the closest signals from CDC, DHS, State, and USCIS. It contrasts the scale of all births and visa and border activity with payer breakdowns and health outcomes, including 32.0% cesarean delivery and 5.4 infant deaths per 1,000 live births, to show how easily “birth tourism” can be inferred only indirectly.
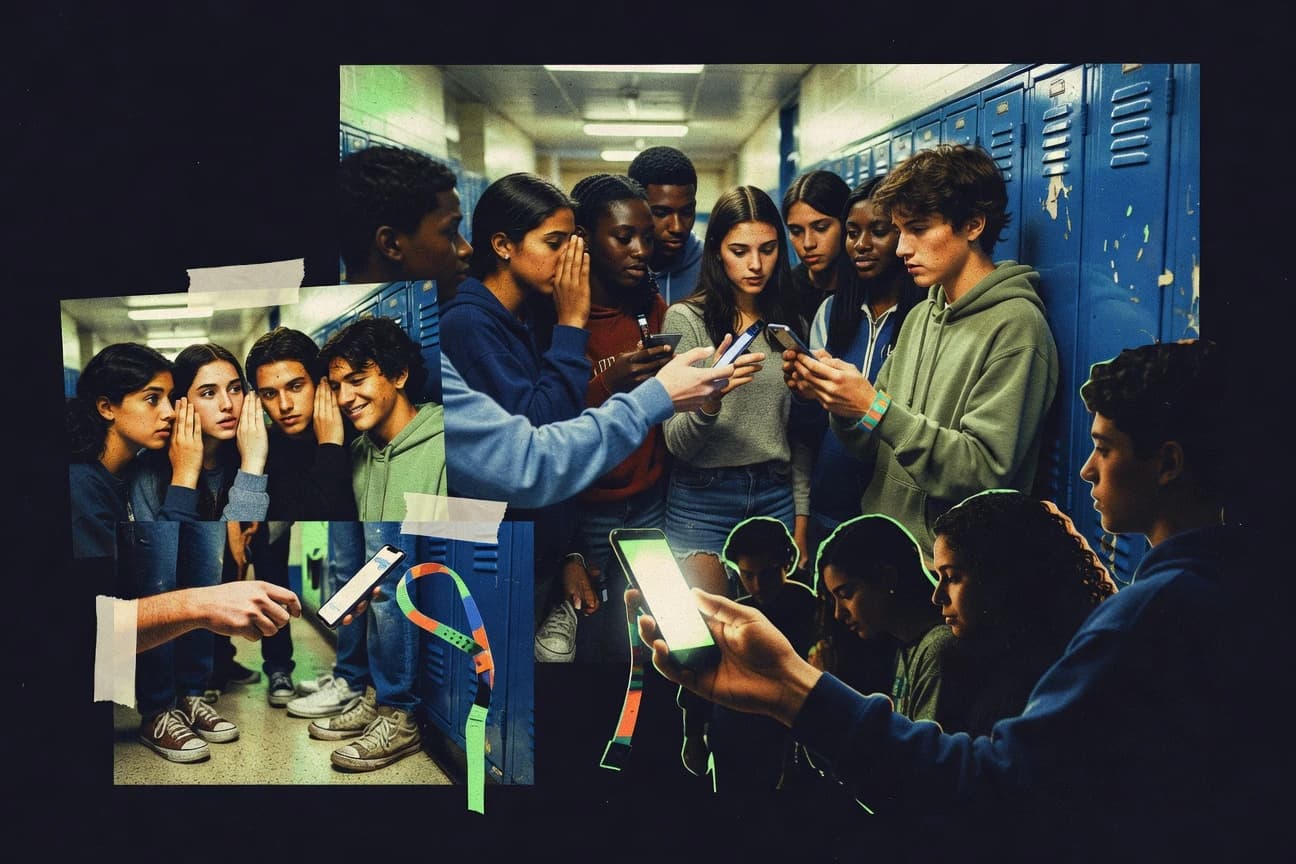
Peer Pressure Statistics
Peer Pressure stats show how fast influence can land, with 2026 data indicating that people who feel pressure are significantly more likely to change their choices. The contrast is stark, because the pressure is often social before it is obvious, which makes the patterns here harder to ignore than the headlines.

Autism Abuse Statistics
Autism is diagnosed in about 1 in 100 children worldwide, yet autism and victimization risks can be far higher, with studies finding bullying rates around 64% among youth with autism and victimization reported by 63% of autistic adults. This page connects those realities to how often maltreatment investigations and substantiated abuse happen in the wider U.S. system so you can see where “suspected” abuse becomes an action gap and why identification and reporting matter.

Homelessness In The Uk Statistics
The latest UK homelessness figures show a stubborn scale of need alongside new evidence that the pressures on households are shifting in ways many people do not expect. If you want to understand where homelessness is growing, where it is easing, and what those changes mean for policy and local support right now, this statistics page is the quickest place to get the real picture.

Homeless Children Statistics
In the 2023 point in time count, about 389,906 children were experiencing homelessness, and 27% of people experiencing homelessness were under 18, alongside stark school and health fallout that reaches far beyond shelter stays. You will see how housing instability drives chronic absenteeism, missed preventive care, and health and mental health strain, while the spending and service tradeoffs behind “housing first” solutions still leave many families without stability.
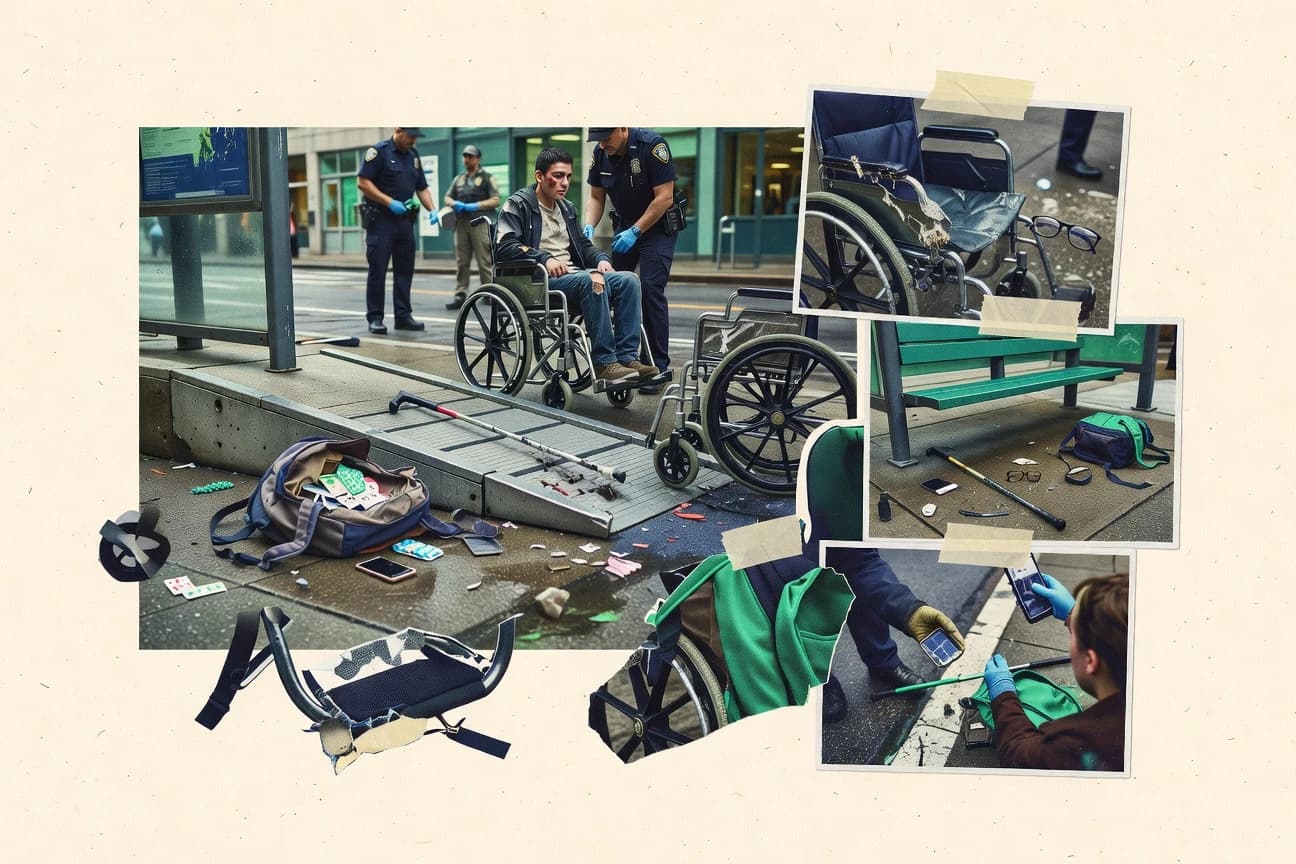
Disability Hate Crime Statistics
With 2025 figures revealing a clear pattern in Disability Hate Crime, the page turns raw reports into a sharp look at who is targeted, where incidents concentrate, and how the counts shift year to year. Don’t just notice the rise or fall, see the specific breakdowns that explain why these attacks keep happening and what they are looking like now.
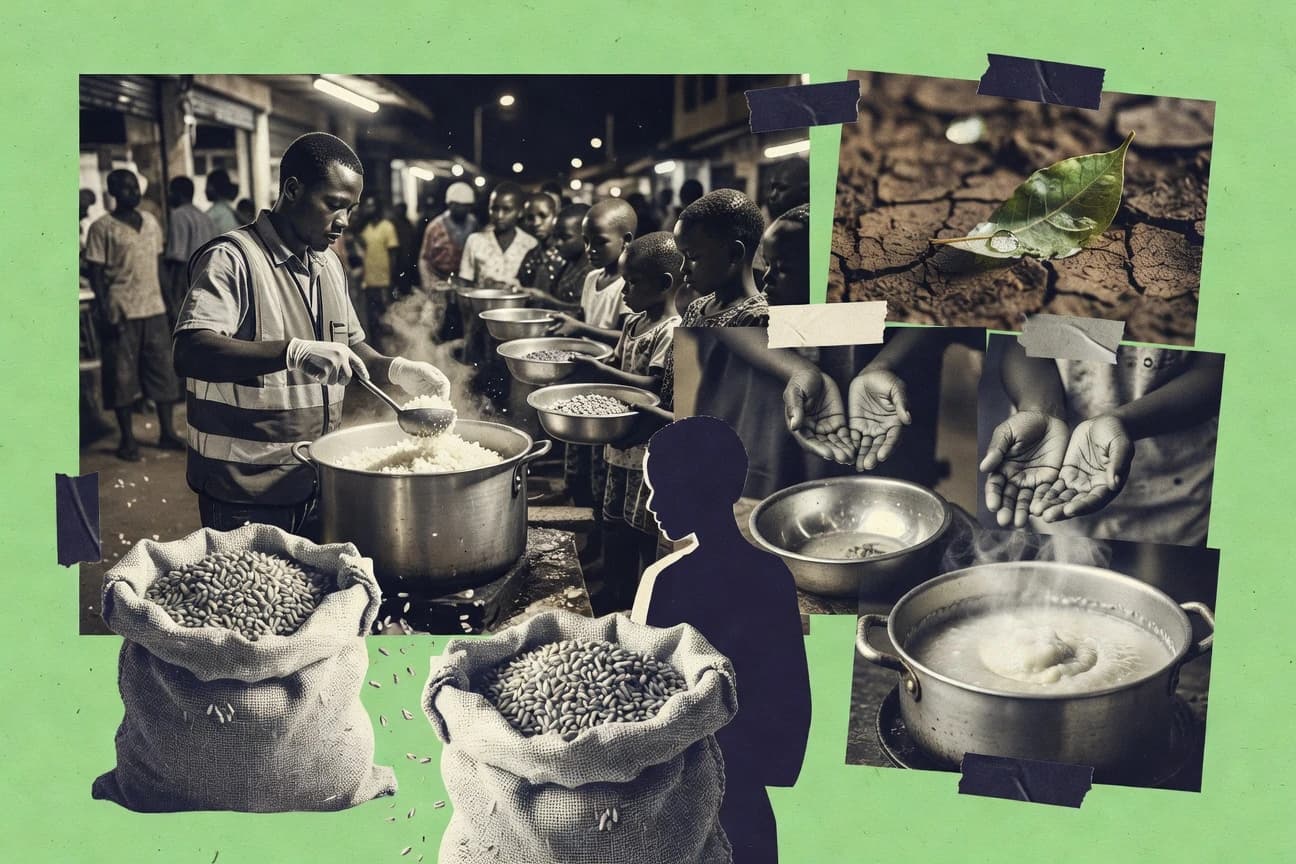
World Hunger Statistics
Food insecurity is not just widespread but worsening, with 40% of the world’s population living in countries where hunger dimensions worsened by 2023. From 193 million people estimated to be in severe food insecurity to underfunded humanitarian food responses with a 26% shortfall, the page connects the biggest hunger drivers from conflict and climate to funding gaps and mitigation results.

Bystander Statistics
Across cultures, the bystander effect swings hard from context to context, with collectivism linked to a 25% higher bystander effect in Asian compared with Western samples and a 15% stronger effect in high power distance cultures. If you ever wondered why help collapses when people pile in, the classic lab contrast is stark, with 75% of lone participants reporting smoke versus only 10% in a group of three.

Teenage Alcohol Statistics
Right now, 29% of high school students reported current alcohol use in the past 30 days, and the consequences spill far beyond partying. From risky sex and drunk driving to grade drops and higher dropout rates, Teenage Alcohol maps how alcohol misuse reshapes teen safety, health, and school outcomes all at once.

Victim Blaming Statistics
Across 161 countries, WHO reports victim blaming embedded in cultural norms for sexual violence in 80% of them, and survivors often meet blame from family, police, media, and even workplaces. Why it matters is stark, in Latin America victim blaming correlates with 45% lower reporting rates, turning fear of judgment into fewer cases being heard.

Conspiracy Theories Statistics
In the 2021 snapshots, conspiracy beliefs ran far wider than most people expect, from 61% of French adults endorsing at least one COVID conspiracy and 44% of U.S. Republicans backing the lab origin story to 25% of low education Americans thinking COVID was a hoax. Then the page connects the dots to consequences, including conspiracy endorsement linked to 24% lower compliance and anti vaccine beliefs tied to roughly $300B in global economic losses.

Instagram Teen Accounts Statistics
With 59% of U.S. teens ages 13 to 17 reporting Instagram use and an average of 1.5 hours a day, this page pinpoints what teens actually do on the app and why it matters, from 54% discovering it for school content to the darker side where 40% report cyberbullying and 35% see harmful content. You will also find sharp contrasts like 51% using Reels daily, only 43% keeping accounts private, and 76% of Gen Z having an active profile, so you can judge the platform beyond the scroll.

Beauty Standards Statistics
With 15.6 million cosmetic procedures in the U.S. in 2020 and social media edits pushing self esteem down for many, Beauty Standards tracks how appearance pressure turns into real world demand. Expect sharp contrasts like 1 in 4 patients seeking tweakments instead of major surgery, plus skin lightening, representation gaps, and the business scale of beauty markets shaping what millions feel they must change.

Consumerism In America Statistics
U.S. advertising hit $288 billion in 2023, with digital ads taking $240 billion, yet 42% of internet users still use ad blockers and many shoppers keep buying on impulse. Debt and consumption move in step too, with total household debt at $17.5 trillion and consumer spending at $18.85 trillion, showing how persuasion, purchasing habits, and financial strain reinforce each other.