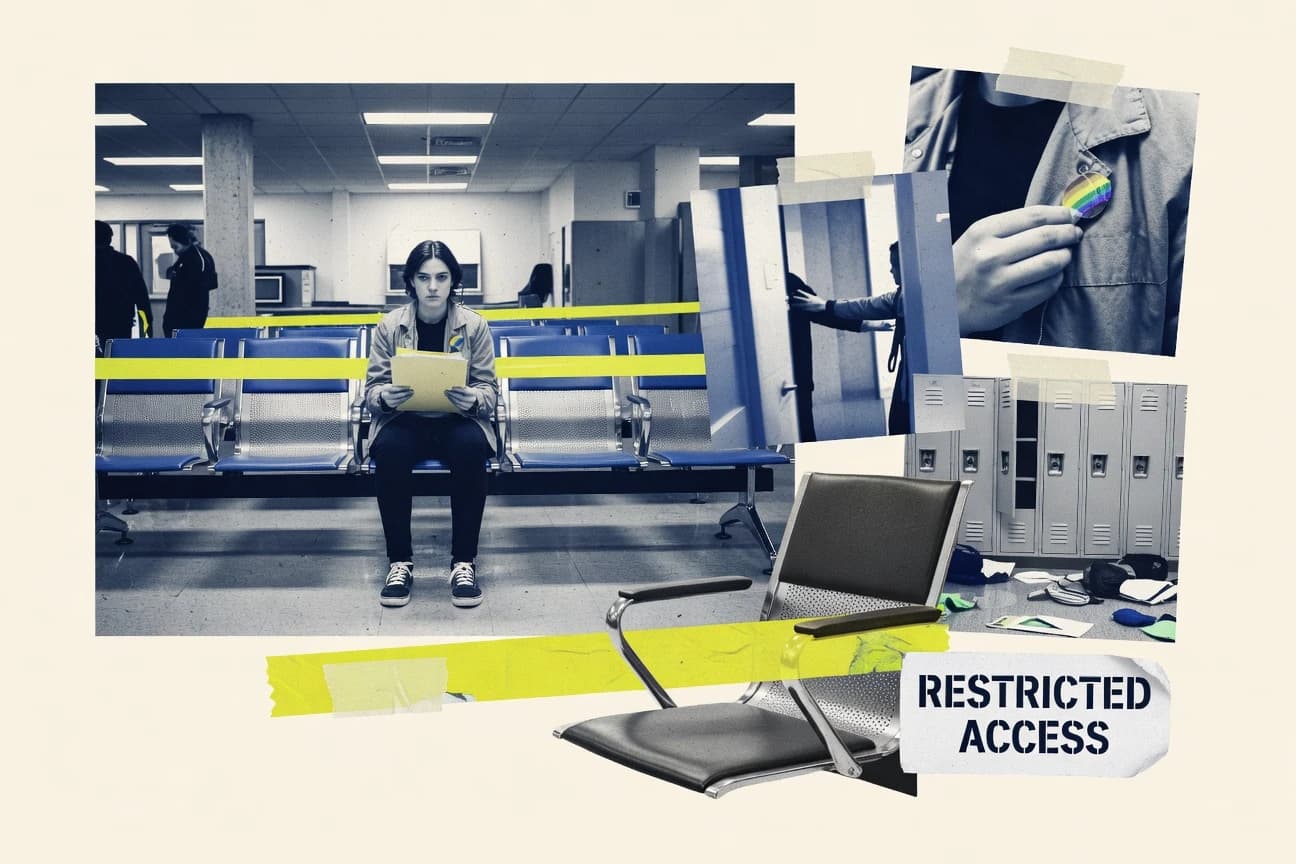
GitNux Logo
  • Editorial Process
Contact Us
Gitnux Logo
Contact Us
  • Home
  • Editorial Process
  • Contact Us
Gitnux Logo
  • Home
  • Blog
  • All Statistics
  • Services
  • Company
  • Privacy Policy
  • Contact
  • Partner
  • Careers
  • As Seen In

Our Services

Custom Market Research

Tailored research solutions designed around your specific business questions and strategic objectives.

Learn more →

Buy Industry Reports

Access comprehensive pre-made industry reports with instant download. Professional market intelligence at your fingertips.

Browse reports →

Software Advisory

Stop wasting months evaluating software vendors. Our analysts leverage 1,000+ AI-verified Best Lists to recommend the right tool for your business in 2–4 weeks.

Learn more →

Popular Categories

Ai In IndustryTechnology Digital MediaSafety AccidentsEntertainment EventsMedical Conditions DisordersMental Health PsychologyMarketing AdvertisingEducation LearningFinance Financial ServicesManufacturing EngineeringSocial Issues Societal TrendsPublic Safety CrimeHealthcare MedicineFood NutritionConsumer RetailHealth MedicineConstruction InfrastructureSports RecreationHr In IndustryDiversity Equity And Inclusion In IndustryGlobal Regional IndustriesBusiness FinanceCustomer Experience In IndustrySustainability In Industry

Find us on

Clutch · Sortlist · DesignRush · G2

GoodFirms · Crunchbase · Tracxn

How we make money

Gitnux.org is an independent market research platform. Primarily, we generate revenue on Gitnux through research projects we conduct for clients & external banner advertising. If we receive a commission for products or services, this is indicated with *.

© 2026 Gitnux. Independent market research platform.

Logos provided by Logo.dev

  1. Home
  2. Social Issues Societal Trends
  3. Lgbt Discrimination Statistics
Lgbt Discrimination Statistics

GITNUXREPORT 2026

Lgbt Discrimination Statistics

LGBTQ+ individuals face widespread discrimination across workplaces, healthcare, and daily life.

47 statistics19 sources4 sections6 min readUpdated yesterday

Key Statistics

Statistic 1

53% of LGBTQ adults say they would feel uncomfortable if their employer displayed LGBTQ-inclusive signs or symbols in the workplace

Statistic 2

37% of LGBTQ youth in the U.S. reported being discriminated against at school

Statistic 3

28% of LGBTQ youth reported that they were verbally harassed at school because of their sexual orientation or gender identity

Statistic 4

20% of LGBTQ youth reported physical harassment at school because of their sexual orientation or gender identity

Statistic 5

76% of LGBTQ students reported hearing homophobic remarks at school

Statistic 6

58% of LGBTQ students reported hearing transphobic remarks at school

Statistic 7

48% of LGBTQ students reported feeling unsafe at school at least some of the time because of their sexual orientation or gender identity

Statistic 8

12% of LGBTQ students reported missing at least one day of school in the past month due to safety concerns related to their sexual orientation or gender identity

Statistic 9

6% of LGBTQ students reported having their education disrupted by discrimination or harassment

Statistic 10

23% of LGBTQ students reported that teachers did not intervene when homophobic remarks were made

Statistic 11

52% of transgender students reported being verbally harassed at school because of their gender expression

Statistic 12

18% of transgender students reported being physically harassed at school because of their gender expression

Statistic 13

46% of transgender students reported feeling unsafe at school because of their gender expression

Statistic 14

1.3x higher odds of discrimination among LGBTQ people compared with non-LGBTQ people in the U.S. (systematic review on discrimination)

Statistic 15

1.8 times the odds of depression among people who experienced discrimination compared with those who did not (meta-analysis)

Statistic 16

2.1 times the odds of anxiety among people who experienced discrimination compared with those who did not (meta-analysis)

Statistic 17

1.5 times higher odds of suicidal ideation among those who experienced discrimination (systematic review)

Statistic 18

39% of LGBTQ adults reported that discrimination has negatively affected their mental health (U.S.)

Statistic 19

52% of LGBTQ students reported that they were bullied at school (U.S. 2022 GLSEN survey)

Statistic 20

26% of LGBTQ students reported missing classes due to safety concerns related to anti-LGBTQ harassment (U.S.)

Statistic 21

15% of LGBTQ students reported having been physically assaulted at school (U.S.)

Statistic 22

1.6 times higher risk of psychological distress among transgender people who experienced discrimination (meta-analysis)

Statistic 23

15% of LGBTQ youth reported missing school due to harassment (GLSEN 2022 survey)

Statistic 24

68% of LGBTQ youth reported that homophobic remarks happened at least a few times a month (GLSEN 2022)

Statistic 25

54% of LGBTQ youth reported that they heard transphobic remarks at least a few times a month (GLSEN 2022)

Statistic 26

57% of LGBTQ youth reported that teachers never or rarely intervened to stop harassment (GLSEN 2022)

Statistic 27

15% of LGBTQ youth reported that they were physically attacked because of their LGBTQ identity (GLSEN 2022)

Statistic 28

30% of LGBTQ youth reported that their school was hostile to them (GLSEN 2022)

Statistic 29

25% of LGBTQ youth reported that they had been disciplined for gender nonconformity (GLSEN 2022)

Statistic 30

18% of LGBTQ youth reported feeling depressed due to harassment at school (survey metric)

Statistic 31

13% of LGBTQ youth reported using substances to cope with harassment (survey metric)

Statistic 32

9% of LGBTQ youth reported that harassment led them to consider quitting school (survey metric)

Statistic 33

2023: Equality Act reintroduced in U.S. Congress to expand federal protections for LGBTQ people against discrimination

Statistic 34

2023: 1,500+ regional hate crime reports involving sexual orientation bias (FBI UCR Hate Crime Data)

Statistic 35

2016: UK Crown Prosecution Service recorded 5,000+ hate crime cases including sexual orientation bias (CPS)

Statistic 36

2018: The European Court of Justice ruled that dismissal due to sexual orientation violates EU anti-discrimination law

Statistic 37

2017: European Court of Justice ruled that dismissal due to gender reassignment violates EU anti-discrimination law

Statistic 38

72% of LGBTQ youth said they felt more comfortable at school when LGBTQ-inclusive policies or resources were present (GLSEN 2022)

Statistic 39

38% of LGBTQ students reported having access to LGBTQ-related content in curriculum (GLSEN 2022)

Statistic 40

31% of LGBTQ students reported having access to an anti-bullying policy that included sexual orientation and gender identity (GLSEN 2022)

Statistic 41

16% of LGBTQ students reported that their school had a Gay-Straight Alliance/GSAs (GLSEN 2022)

Statistic 42

54% of companies have at least one employee resource group (industry trend metric; used to contextualize LGBT inclusion programs)

Statistic 43

34% of Fortune 500 companies included explicit LGBTQ protections in their employment benefits or policies (survey of company policies)

Statistic 44

1,200+ organizations submitted data to the Corporate Equality Index (CEI) (HRC CEI participation)

Statistic 45

2024: 1 in 4 (25%) of employers reported offering domestic partner benefits (survey)

Statistic 46

2023: 36% of employers offered gender identity-inclusive healthcare coverage (survey metric)

Statistic 47

2023: 52% of LGBTQ adults in the U.S. say they often or sometimes avoid public places due to safety concerns (survey metric)

1/47
Sources
Trusted by 500+ publications
Harvard Business ReviewThe GuardianFortuneMicrosoftWorld Economic ForumFast Company
Harvard Business ReviewThe GuardianFortune+497
Elif Demirci

Written by Elif Demirci·Edited by Nikolas Papadopoulos·Fact-checked by Rebecca Hargrove

Published Feb 13, 2026·Last verified Apr 16, 2026·Next review: Oct 2026
Fact-checked via 4-step process— how we build this report
01Primary Source Collection

Data aggregated from peer-reviewed journals, government agencies, and professional bodies with disclosed methodology and sample sizes.

02Editorial Curation

Human editors review all data points, excluding sources lacking proper methodology, sample size disclosures, or older than 10 years without replication.

03AI-Powered Verification

Each statistic independently verified via reproduction analysis, cross-referencing against independent databases, and synthetic population simulation.

04Human Cross-Check

Final human editorial review of all AI-verified statistics. Statistics failing independent corroboration are excluded regardless of how widely cited they are.

Read our full methodology →

Statistics that fail independent corroboration are excluded.

When 53% of LGBTQ adults say they would feel uncomfortable if their employer displayed LGBTQ inclusive signs or symbols, the data quickly reveals how discrimination shows up not only in schools but across everyday workplaces and public life.

Key Takeaways

  • 153% of LGBTQ adults say they would feel uncomfortable if their employer displayed LGBTQ-inclusive signs or symbols in the workplace
  • 237% of LGBTQ youth in the U.S. reported being discriminated against at school
  • 328% of LGBTQ youth reported that they were verbally harassed at school because of their sexual orientation or gender identity
  • 41.8 times the odds of depression among people who experienced discrimination compared with those who did not (meta-analysis)
  • 52.1 times the odds of anxiety among people who experienced discrimination compared with those who did not (meta-analysis)
  • 61.5 times higher odds of suicidal ideation among those who experienced discrimination (systematic review)
  • 72023: Equality Act reintroduced in U.S. Congress to expand federal protections for LGBTQ people against discrimination
  • 82023: 1,500+ regional hate crime reports involving sexual orientation bias (FBI UCR Hate Crime Data)
  • 92016: UK Crown Prosecution Service recorded 5,000+ hate crime cases including sexual orientation bias (CPS)
  • 1072% of LGBTQ youth said they felt more comfortable at school when LGBTQ-inclusive policies or resources were present (GLSEN 2022)
  • 1138% of LGBTQ students reported having access to LGBTQ-related content in curriculum (GLSEN 2022)
  • 1231% of LGBTQ students reported having access to an anti-bullying policy that included sexual orientation and gender identity (GLSEN 2022)

Nearly three in four LGBTQ students hear homophobic or transphobic remarks, yet teachers often do not intervene.

Experiences & Prevalence

153% of LGBTQ adults say they would feel uncomfortable if their employer displayed LGBTQ-inclusive signs or symbols in the workplace[1]
Verified
237% of LGBTQ youth in the U.S. reported being discriminated against at school[2]
Verified
328% of LGBTQ youth reported that they were verbally harassed at school because of their sexual orientation or gender identity[3]
Verified
420% of LGBTQ youth reported physical harassment at school because of their sexual orientation or gender identity[3]
Directional
576% of LGBTQ students reported hearing homophobic remarks at school[3]
Single source
658% of LGBTQ students reported hearing transphobic remarks at school[3]
Verified
748% of LGBTQ students reported feeling unsafe at school at least some of the time because of their sexual orientation or gender identity[3]
Verified
812% of LGBTQ students reported missing at least one day of school in the past month due to safety concerns related to their sexual orientation or gender identity[3]
Verified
96% of LGBTQ students reported having their education disrupted by discrimination or harassment[3]
Directional
1023% of LGBTQ students reported that teachers did not intervene when homophobic remarks were made[3]
Single source
1152% of transgender students reported being verbally harassed at school because of their gender expression[4]
Verified
1218% of transgender students reported being physically harassed at school because of their gender expression[4]
Verified
1346% of transgender students reported feeling unsafe at school because of their gender expression[4]
Verified
141.3x higher odds of discrimination among LGBTQ people compared with non-LGBTQ people in the U.S. (systematic review on discrimination)[5]
Directional

Experiences & Prevalence Interpretation

Across school and workplace experiences, LGBTQ youth face widespread harassment and insecurity, with 76% hearing homophobic remarks, 58% hearing transphobic remarks, 48% feeling unsafe at least some of the time, and 12% missing school in the past month due to safety concerns.

Impact & Health Outcomes

11.8 times the odds of depression among people who experienced discrimination compared with those who did not (meta-analysis)[6]
Verified
22.1 times the odds of anxiety among people who experienced discrimination compared with those who did not (meta-analysis)[6]
Verified
31.5 times higher odds of suicidal ideation among those who experienced discrimination (systematic review)[7]
Verified
439% of LGBTQ adults reported that discrimination has negatively affected their mental health (U.S.)[8]
Directional
552% of LGBTQ students reported that they were bullied at school (U.S. 2022 GLSEN survey)[3]
Single source
626% of LGBTQ students reported missing classes due to safety concerns related to anti-LGBTQ harassment (U.S.)[3]
Verified
715% of LGBTQ students reported having been physically assaulted at school (U.S.)[3]
Verified
81.6 times higher risk of psychological distress among transgender people who experienced discrimination (meta-analysis)[9]
Verified
915% of LGBTQ youth reported missing school due to harassment (GLSEN 2022 survey)[3]
Directional
1068% of LGBTQ youth reported that homophobic remarks happened at least a few times a month (GLSEN 2022)[3]
Single source
1154% of LGBTQ youth reported that they heard transphobic remarks at least a few times a month (GLSEN 2022)[3]
Verified
1257% of LGBTQ youth reported that teachers never or rarely intervened to stop harassment (GLSEN 2022)[3]
Verified
1315% of LGBTQ youth reported that they were physically attacked because of their LGBTQ identity (GLSEN 2022)[3]
Verified
1430% of LGBTQ youth reported that their school was hostile to them (GLSEN 2022)[3]
Directional
1525% of LGBTQ youth reported that they had been disciplined for gender nonconformity (GLSEN 2022)[3]
Single source
1618% of LGBTQ youth reported feeling depressed due to harassment at school (survey metric)[4]
Verified
1713% of LGBTQ youth reported using substances to cope with harassment (survey metric)[4]
Verified
189% of LGBTQ youth reported that harassment led them to consider quitting school (survey metric)[4]
Verified

Impact & Health Outcomes Interpretation

Across these studies and surveys, discrimination is consistently linked to worse mental health, with odds of depression rising 1.8 times and anxiety 2.1 times, while at the same time U.S. LGBTQ students report 52% being bullied and 26% missing classes due to safety concerns.

Legal Framework & Enforcement

12023: Equality Act reintroduced in U.S. Congress to expand federal protections for LGBTQ people against discrimination[10]
Verified
22023: 1,500+ regional hate crime reports involving sexual orientation bias (FBI UCR Hate Crime Data)[11]
Verified
32016: UK Crown Prosecution Service recorded 5,000+ hate crime cases including sexual orientation bias (CPS)[12]
Verified
42018: The European Court of Justice ruled that dismissal due to sexual orientation violates EU anti-discrimination law[13]
Directional
52017: European Court of Justice ruled that dismissal due to gender reassignment violates EU anti-discrimination law[14]
Single source

Legal Framework & Enforcement Interpretation

Across 2016 to 2023, enforcement and legal recognition against LGBTQ discrimination appear to be accelerating, highlighted by 1,500+ U.S. regional hate crime reports in 2023 alongside major court rulings in 2017 and 2018 and over 5,000 UK hate crime cases recorded in 2016.

Industry Trends

172% of LGBTQ youth said they felt more comfortable at school when LGBTQ-inclusive policies or resources were present (GLSEN 2022)[3]
Verified
238% of LGBTQ students reported having access to LGBTQ-related content in curriculum (GLSEN 2022)[3]
Verified
331% of LGBTQ students reported having access to an anti-bullying policy that included sexual orientation and gender identity (GLSEN 2022)[3]
Verified
416% of LGBTQ students reported that their school had a Gay-Straight Alliance/GSAs (GLSEN 2022)[3]
Directional
554% of companies have at least one employee resource group (industry trend metric; used to contextualize LGBT inclusion programs)[15]
Single source
634% of Fortune 500 companies included explicit LGBTQ protections in their employment benefits or policies (survey of company policies)[16]
Verified
71,200+ organizations submitted data to the Corporate Equality Index (CEI) (HRC CEI participation)[16]
Verified
82024: 1 in 4 (25%) of employers reported offering domestic partner benefits (survey)[17]
Verified
92023: 36% of employers offered gender identity-inclusive healthcare coverage (survey metric)[18]
Directional
102023: 52% of LGBTQ adults in the U.S. say they often or sometimes avoid public places due to safety concerns (survey metric)[19]
Single source

Industry Trends Interpretation

Across schools and workplaces, the gap is clear: while 72% of LGBTQ youth feel more comfortable when LGBTQ-inclusive policies or resources exist, only 16% report having a Gay-Straight Alliance and just 31% have an anti-bullying policy covering sexual orientation and gender identity, showing that support is far less available than its impact suggests.

References

apa.orgapa.org
  • 1apa.org/news/press/releases/2017/09/lgbt-discrimination
  • 8apa.org/pubs/reports/discrimination-mental-health
  • 19apa.org/monitor/2023/03/lgbtq-discrimination
acf.hhs.govacf.hhs.gov
  • 2acf.hhs.gov/cb/resource/trafficking-and-lgbtq-youth-2017
glsen.orgglsen.org
  • 3glsen.org/sites/default/files/2022-GLSEN%20National%20School%20Climate%20Survey%20Full%20Report.pdf
  • 4glsen.org/research/2023-national-school-climate-survey
jamanetwork.comjamanetwork.com
  • 5jamanetwork.com/journals/jama/article-abstract/2770370
ncbi.nlm.nih.govncbi.nlm.nih.gov
  • 6ncbi.nlm.nih.gov/pmc/articles/PMC6987932/
  • 9ncbi.nlm.nih.gov/pmc/articles/PMC6065889/
pubmed.ncbi.nlm.nih.govpubmed.ncbi.nlm.nih.gov
  • 7pubmed.ncbi.nlm.nih.gov/29551636/
congress.govcongress.gov
  • 10congress.gov/bill/118th-congress/house-bill/5
ucr.fbi.govucr.fbi.gov
  • 11ucr.fbi.gov/hate-crime
cps.gov.ukcps.gov.uk
  • 12cps.gov.uk/hate-crime
curia.europa.eucuria.europa.eu
  • 13curia.europa.eu/juris/document/document.jsf?docid=183931
  • 14curia.europa.eu/juris/document/document.jsf?docid=186094
gallup.comgallup.com
  • 15gallup.com/workplace/236441/employee-resource-groups-help-workplace-inclusion.aspx
hrc.orghrc.org
  • 16hrc.org/campaigns/corporate-equality-index
shrm.orgshrm.org
  • 17shrm.org/resourcesandtools/hr-topics/benefits/pages/domestic-partner-benefits.aspx
aon.comaon.com
  • 18aon.com/getmedia/9f7f6c74-4c8c-4b7f-bbbd-8b7c4b6efb5e/gender-inclusion-2023.pdf

On this page

  1. 01Key Takeaways
  2. 02Experiences & Prevalence
  3. 03Impact & Health Outcomes
  4. 04Legal Framework & Enforcement
  5. 05Industry Trends
Elif Demirci

Elif Demirci

Author

Nikolas Papadopoulos
Editor
Rebecca Hargrove
Fact Checker

Our Commitment to Accuracy

  • Rigorous fact-checking process
  • Data from reputable sources
  • Regular updates to ensure relevance
Learn more

Explore More In This Category

  • Syrian Refugees Statistics
  • Pro Life Statistics
  • Teen Drinking Statistics
  • Mmiw Statistics
  • Native American Poverty Statistics
  • School Shootings Race Statistics