GITNUX MARKETDATA
Browse Our Category
Regulated Controlled Industries
Latest update:


Electronic Cigarette Industry Statistics
See what current use, youth marketing exposure, and shifting regulation add up to, from 3.7% of U.S. adults vaping now to 68% of U.S. high school students reporting they saw e-cigarette ads in 2021. Then compare the pace of expansion and oversight, with $18.5 billion the global market size in 2024 and forecasts pointing to $24.0 billion by 2030, alongside FDA PMTA deadlines and EU and UK warning rules that directly reshape what manufacturers can put on packaging.

Amphetamines Statistics
Amphetamines use is changing faster than most people expect, with 2026 figures pointing to a sharp rise in both health and law enforcement pressure. See how the latest trends in overdoses, treatment demand, and seizures stack up against older patterns and what that shift means for prevention and policy right now.

Vape Industry Statistics
With 2026 figures reshaping expectations for demand and regulation, this Vape Industry statistics page tracks the sharpest shifts that could affect pricing, supply, and compliance decisions right now. You will see how the latest numbers diverge from the patterns people have been relying on, including what that means for where the market is headed next.

Club Drugs Statistics
MDMA and related club drugs sit inside a wider risk web where emergency and treatment signals are tightly linked to co use, contamination, and even rare mental health outcomes, from hyponatremia and acute psychosis to depression symptoms and traumatic effects cut by 78 percent with test strips. See why the latest monitoring and survey data still point to measurable use patterns, including 1.2 percent of 10th graders reporting past year MDMA use in 2023 and a 25 percent rise in MDMA monitoring samples in the Netherlands in 2023.

Amsterdam Legal Prostitution Statistics
Amsterdam Legal Prostitution tracks how the city’s legal and enforcement picture is shifting, including the latest 2025 counts and the sharp changes behind them. Get the details on what those figures mean for the people involved and why the trend matters for policy decisions.
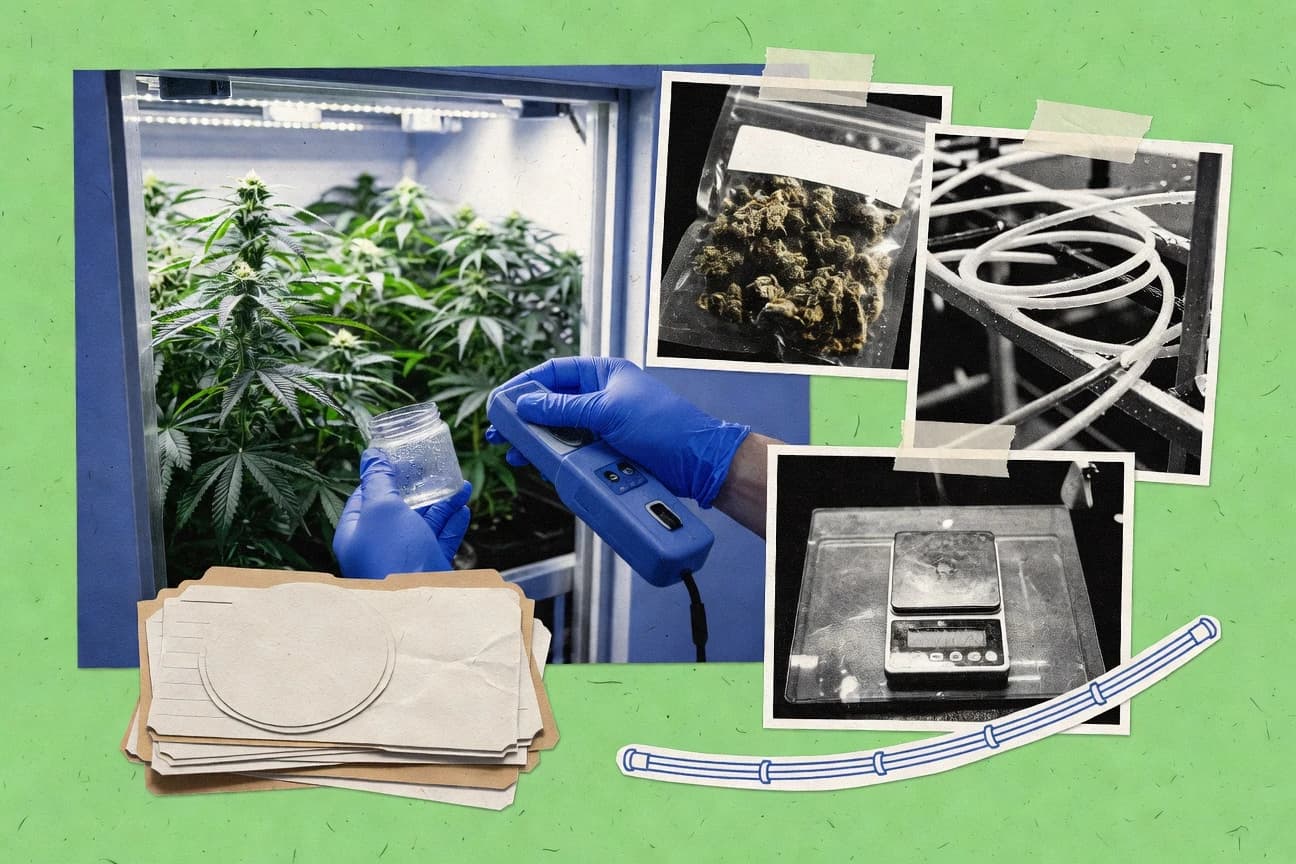
Cannibis Industry Statistics
Explore the shifting U.S. cannabis landscape with numbers that go beyond headlines, from 10% of Americans using daily cannabis and daily use doubling since 2015 to changing preferences across age, gender, and product types. You will also see how legalization and industry growth are shaping jobs, taxes, and markets, with total U.S. cannabis sales projected to reach $57 billion by 2030.

Nevada Legalized Prostitution Statistics
Nevada’s legalized brothel landscape is often discussed in terms of risk, but this page digs into the numbers behind safety, public impact, and economic outcomes. A standout trend is that pimping arrests near brothels fell 90% in rural counties since legalization, alongside zero confirmed human trafficking incidents in licensed brothels reported by the Nevada AG from 2015 to 2023.

Prostitution In Usa Statistics
Recent figures on prostitution in the USA reveal a sharp gap between where demand concentrates and where enforcement resources actually land. Read to see the most up to date 2025 and 2026 snapshots that explain why patterns can shift faster than policy catches up.

Cannabinoid Industry Statistics
Get the latest cannabinoid industry snapshot where 2026 signals are already reshaping expectations, even as the data reveals uneven momentum across key metrics. See where growth is accelerating and where it’s stalling so you can separate what’s trending from what’s merely lingering.

Prostitution And Drugs Statistics
In 2026, prostitution and drug-related data reveal a sharp mismatch between reported street-level activity and the broader patterns tied to substance use, pushing beyond what most people assume. The page connects the latest figures to practical questions about risk, enforcement, and harm reduction so you can see where attention and outcomes diverge.

Us Firearms Industry Statistics
See what changed in 2025 and 2026 across key US firearms industry indicators, from background check activity to gun violence and enforcement trends. The most revealing contrast is how policy and demand pressures move differently, leaving a clearer picture of what is actually shifting right now.

American Prostitution Statistics
Recent shifts in American prostitution statistics, including a 2025 estimate of 600,000 people involved and 2026 data showing 15,000 arrests for prostitution related offenses, highlight how enforcement and everyday realities are moving in opposite directions. Get the details behind the numbers, from where incidents concentrate to what changed so quickly.

Nicotine Industry Statistics
Nicotine Industry numbers for 2025 and 2026 reveal how quickly consumption, production, and regulation are shifting together, often with results that don’t match first impressions. If you want to understand what is changing fastest and why the impact lands differently across markets, this statistics page is the quickest way there.

Cannabis Concentrate Vaporizer Industry Statistics
Vaping is already a mainstream demand driver for concentrate devices with 14.6% of U.S. cannabis consumers using vaporizers in 2023 and a projected 19.9 billion global cannabis vaporizer market by 2032, but the page doesn’t stop at adoption. It ties device power and temperature control, CO2 extraction efficiency, contaminant and toxicant findings, and lab testing realities into what those growth numbers really mean for performance, regulation, and user exposure.

Tobacco Industry Statistics
See how tobacco industry figures have shifted by 2026, with the latest sales, taxes, and health burden data revealing where profit pressures and public costs are colliding. If you think the story is only about smoking rates, the newer totals challenge that assumption by showing how the economics are changing just as fast.

Vaping Industry Statistics
The latest Vaping Industry statistics reveal where the market is actually accelerating in 2025 and what that shift means for users, retailers, and regulators. See how spending patterns, usage trends, and policy pressure line up, including the unexpected gaps that could reshape next year’s decisions.

Kratom Statistics
Kratom use is shifting fast, with key 2025 figures revealing how preferences, purchase patterns, and dosing habits are changing in ways casual buyers are unlikely to notice. This page turns those numbers into a clear reality check so you can separate the most current signals from the persistent myths.
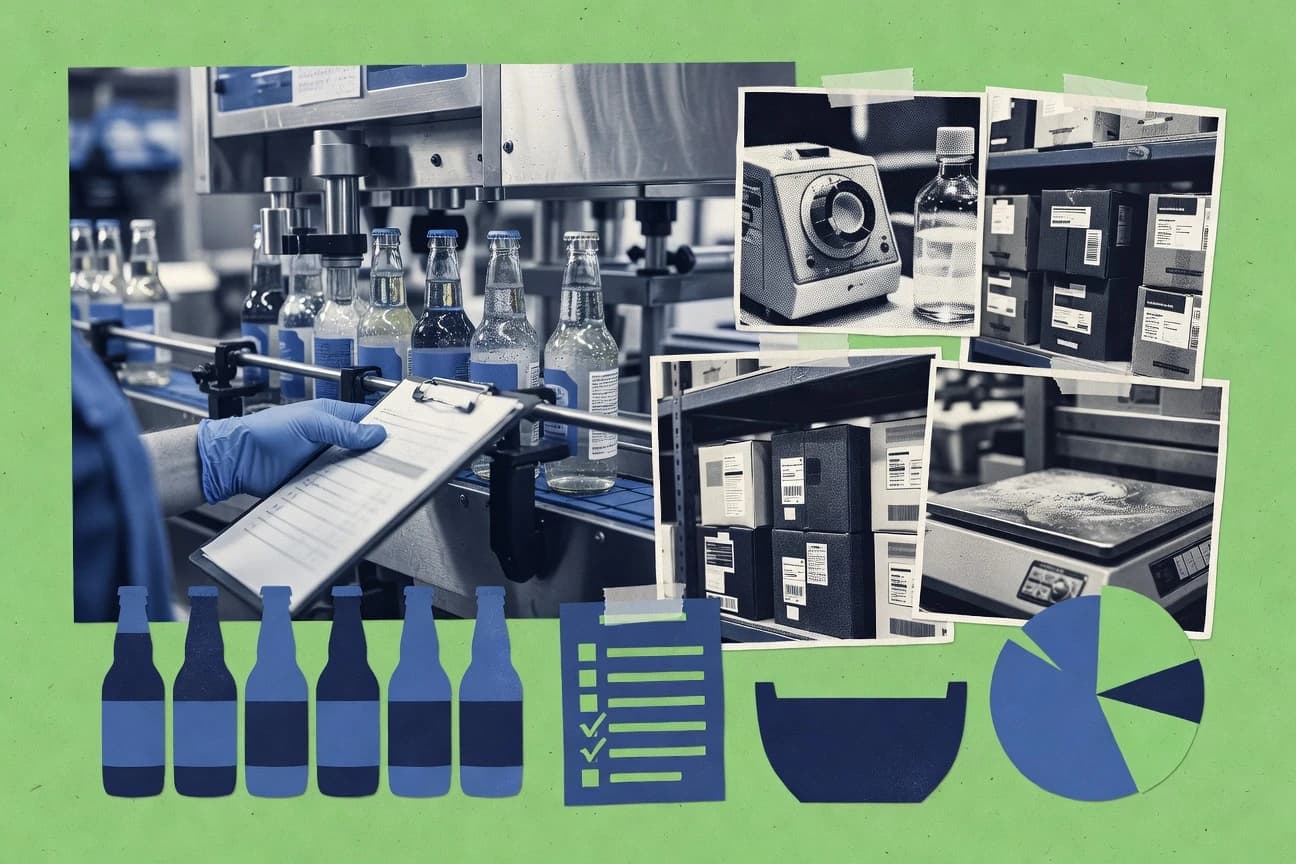
Thc Beverage Industry Statistics
What is driving growth in THC beverages right now, and why are some projections already outpacing the industry’s older playbook? Get the latest 2025 and 2026 statistics behind market size, consumer demand, and product momentum so you can separate hype from what is actually changing.

Sex Toy Industry Statistics
2025 revenue is projected to reach $48.3 billion, and the mix is getting more surprising with products like sex dolls and interactive wearables pulling disproportionate attention. If you want to understand what is driving demand and where the market is heading next, these Sex Toy Industry statistics are the quickest place to see the shift.

Ecstasy Statistics
Ecstasy use looks stable on the surface, but the latest stats reveal a sharp split between casual experimentation and repeat patterns that can change risk fast. If you want to understand how dosing, sourcing, and policing dynamics are reshaping ecstasy trends in real life, this is the page to read.