GITNUX MARKETDATA
Browse Our Category
Home And Kitchen Appliances
Latest update:


Dishwasher Industry Statistics
US households that own a dishwasher climbed to 68% in 2023, but what people buy is shifting fast as smart and water saving features pull attention away from basic cycles. From 42% of millennials favoring app connected models to 55% of Europeans choosing energy efficient units and 35% of urban dwellers turning to compact designs, these 2023 figures explain why quiet tech, eco materials, and connected controls are becoming the new baseline for dishwasher buyers.

Appliances Industry Statistics
With 35% of Europe buying appliances online, up sharply from pre-pandemic levels, and U.S. Eco-labels shaping 41% of major appliance decisions amid inflation delays, this page connects purchase behavior to smarter, cleaner, and more connected products. It also tracks fast tech adoption like 22% of U.S. homes using robotic vacuums in 2023, alongside sustainability and price pressure seen in markets from 45% EU energy efficient preferences to 62% of Indian small appliance buyers prioritizing cost.

Power Tool Industry Statistics
Modern power tools are locking in smart efficiency, with IoT enabled models up 25% to 12 million units in 2023 and brushless motors hitting 72% adoption in new cordless launches. At the same time, sustainability and control are moving from claims to features, from recyclable battery initiatives covering 40% of major brands in 2023 to AI torque control cutting over tightening by 40% in new impact wrenches.

Water Filtration Industry Statistics
2023 demand signals are sharp, with industrial food and beverage filtration up 12% to meet hygiene standards and data centers cutting 30% of equipment failures tied to water quality. This page pairs those business pressures with the regulatory and tech shift behind them, from RO holding a 45% residential share to AI and advanced membranes pushing faster, cleaner performance all the way to real time PFAS detection in 2024 prototypes.

Housewares Industry Statistics
With U.S. housewares e-commerce still climbing, and global eco upgrades accelerating since 2020, this page pinpoints what is shifting consumer behavior fast in cookware, appliances, and everyday home essentials. Expect surprises like 72% of 25 to 34 shoppers buying online, 37% prioritizing smart home integration, and sustainability that now spans from bamboo and recycled plastics to zero waste packaging and recyclable cookware lines.
Vacuum Cleaner Industry Statistics
Robotic vacuums now account for 28.5% of total vacuum revenue worldwide while 85.3 million units were sold globally in 2022, a useful benchmark for how fast handheld, cordless, and smart features are reshaping the market. You will also see where power and convenience diverge, from Dyson’s 12.5% revenue share to pet owners driving 55% of robot purchases and buyers increasingly demanding battery life, HEPA filtration, and quiet operation.
Microwave Industry Statistics
See how 2023’s top makers shaped the microwave market, from Samsung’s 19.2% global share and Galanz’s 22% OEM output to LG’s USD 1.1B inverter-driven revenue and Whirlpool’s 12.4% North America position. Then compare that brand power with what’s actually changing homes and buying behavior, where urban ownership, app control preferences, and smart feature penetration are pushing countertop and built in models into the spotlight.

Refrigerator Industry Statistics
Global refrigerator revenue is projected to hit USD 104.25 billion by 2030 at a 4.7% CAGR, while smart fridges climbed from 5.2 million units in 2023 and now carry the sustainability shift that is cutting energy use, refrigerant impact, and food waste at the same time. From China’s 82.4 million unit production to Europe’s energy efficient push and rising built in demand, this page puts the biggest market drivers and the behind the scenes technology changes side by side so you can see what is accelerating and what is slipping.
Cutlery Industry Statistics
Eco-friendly choices are no longer a niche signal with 55% of consumers favoring eco-friendly cutlery materials in 2023 and EU metal recycling reaching 92% in 2023, while global online cutlery purchases jumped 42% in 2023 and smart sensor cutlery still holds just 5% of the market share. Use this page to spot what is driving demand now, from a 25% drop in plastic use across 40 country bans to the production scale behind it, including China’s 4.8 billion cutlery pieces in 2023.
Coffee Machine Industry Statistics
Coffee Machine Industry tracks where demand is surging and who is winning it, from Nespresso’s 28% global brand awareness and Keurig Dr Pepper’s 36% US single serve share to De’Longhi’s 22% lead in European bean to cup. You will also see how buyers are changing habits and expectations, with 65% of US millennials owning machines and 78% of Gen Z prioritizing app connected features, alongside a market projected to reach USD 22.3 billion by 2030.

Knife Industry Statistics
Knife Industry’s latest figures put the global market on a steady climb, with e commerce pushing knife sales to $3.2 billion in 2023 and the sector forecast to reach $14.2 billion by 2032. You will also see how China alone produced 1.8 billion knives in 2022 and how ceramic and smart blade trends are reshaping what people actually buy, from kitchen dominance to pocket and tactical demand.

Cooler Industry Statistics
Cooler choices are getting more performance minded and more eco focused at the same time, with 72% of new coolers featuring double wall vacuum insulation technology alongside 61% of consumers actively seeking eco friendly materials. See why reviews sway 68% of buying decisions, why Yeti leads with a 41% repurchase rate, and how global momentum has pushed the portable cooler market toward USD 7.2 billion by 2030.
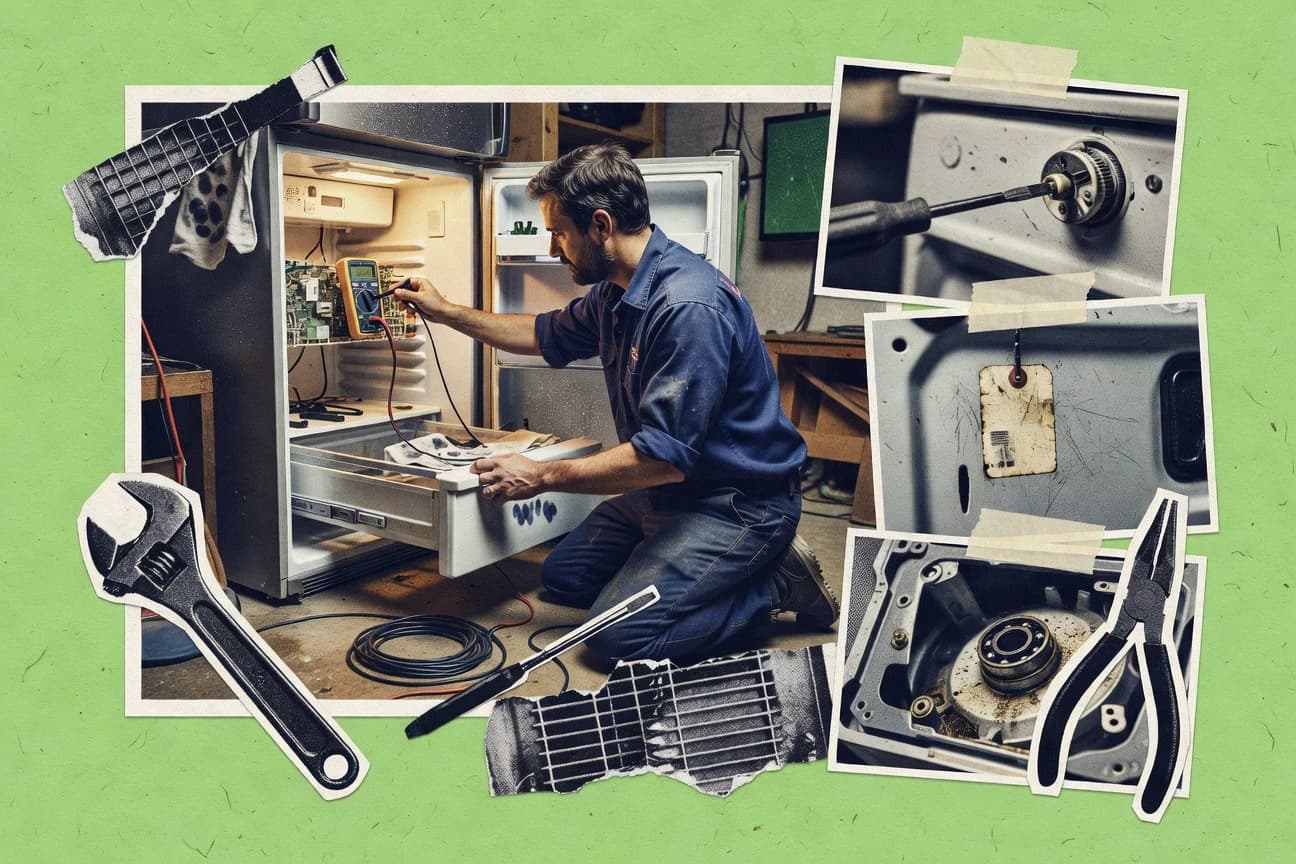
Appliance Repair Industry Statistics
U.S. households spent an average of $450 a year on appliance repairs in 2023, yet 75% still choose fixing over replacing, with 48% booking services through mobile apps and 87% reporting satisfaction. The page also reveals the tension between what drives speed and demand and what holds repairs back, from 35% emergency call volume and 67% booking within 24 hours to 55% delaying due to cost and 71% being swayed by online reviews.
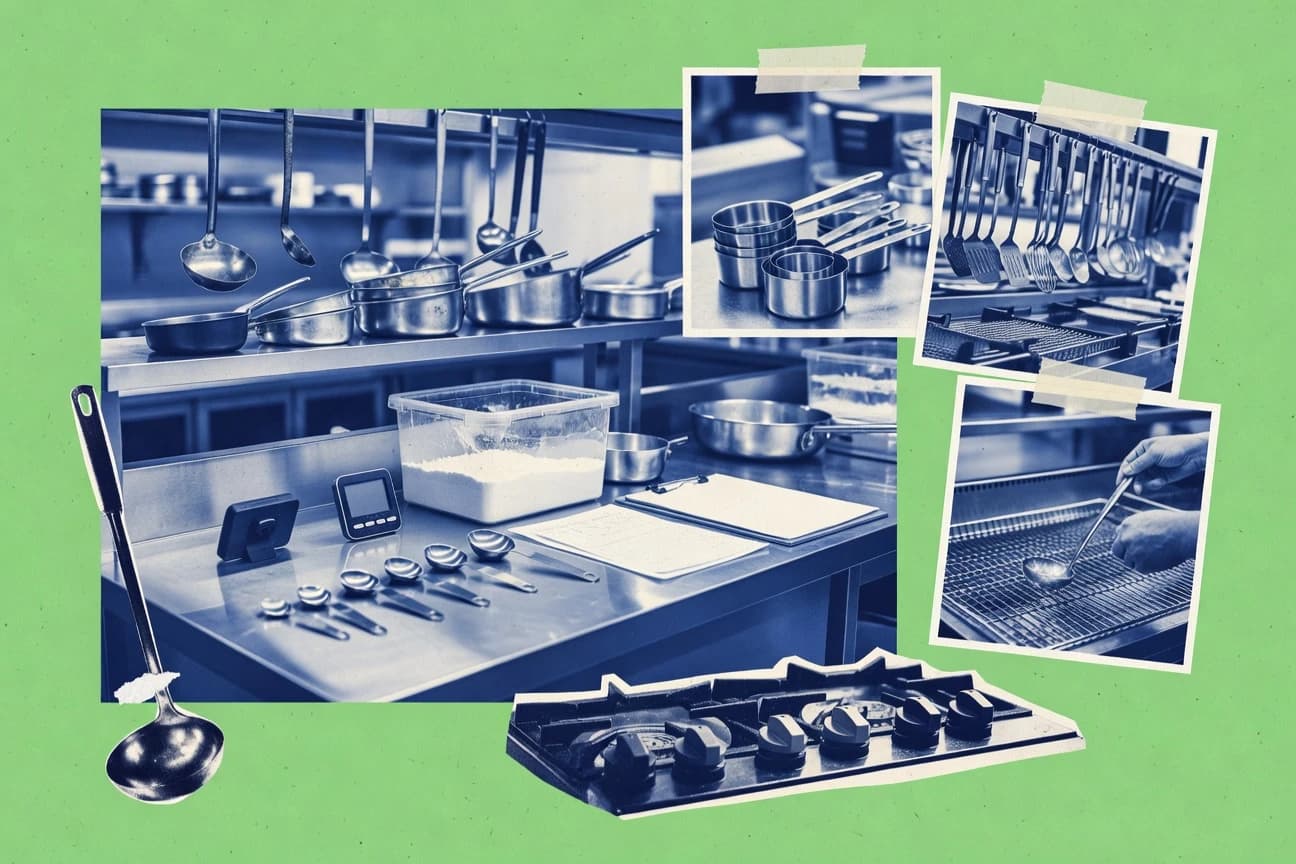
Kitchen Industry Statistics
Kitchen decisions are getting smarter, greener, and more expensive all at once, with 68% of US homeowners prioritizing kitchen upgrades during renovations and the average remodel landing at $25,000 to $50,000. From 61% of Gen Z wanting smart tech and 55% pushing for energy efficient appliances to buyers considering kitchen quality crucial, plus the ROI pull that can reach 81% for a US minor remodel, these numbers reveal exactly what is driving upgrades in 2025 and beyond.

Outdoor Power Equipment Industry Statistics
See why the Outdoor Power Equipment Industry is swinging hard toward battery and regulation, with EU Stage V impacting 40% of gas OPE imports and battery OPE cutting CO2 emissions by 70% versus gas equivalents per hour. From 55% of annual OPE sales landing in spring to $450 average residential spend and 40% of buyers swayed by online reviews, this page pinpoints what is driving demand, by customer type and tool category.

Mower Industry Statistics
Battery mowers are winning hearts fast with 73% satisfaction versus 81% for gas, while 45% of U.S. households already lean cordless electric and 39% of buyers point to noise reduction as the deciding factor. At the same time, the market is moving from grab and go to smarter routines and services, with robotic adoption up to 28% among urban millennials, and the global lawn mower market projected to reach USD 52.81 billion by 2032 after growing from USD 35.42 billion in 2023.

Cookware Industry Statistics
From PFAS-free non-stick demand soaring 25% since 2020 to premium cookware choices driven by health, sustainability, and convenience, this page connects the numbers behind what people actually cook with. You will also see how styles vary by region, including 62% of U.S. consumers choosing non-stick for daily ease and cleaning, and 67% of Chinese shoppers favoring multi-functional cookware to save space.
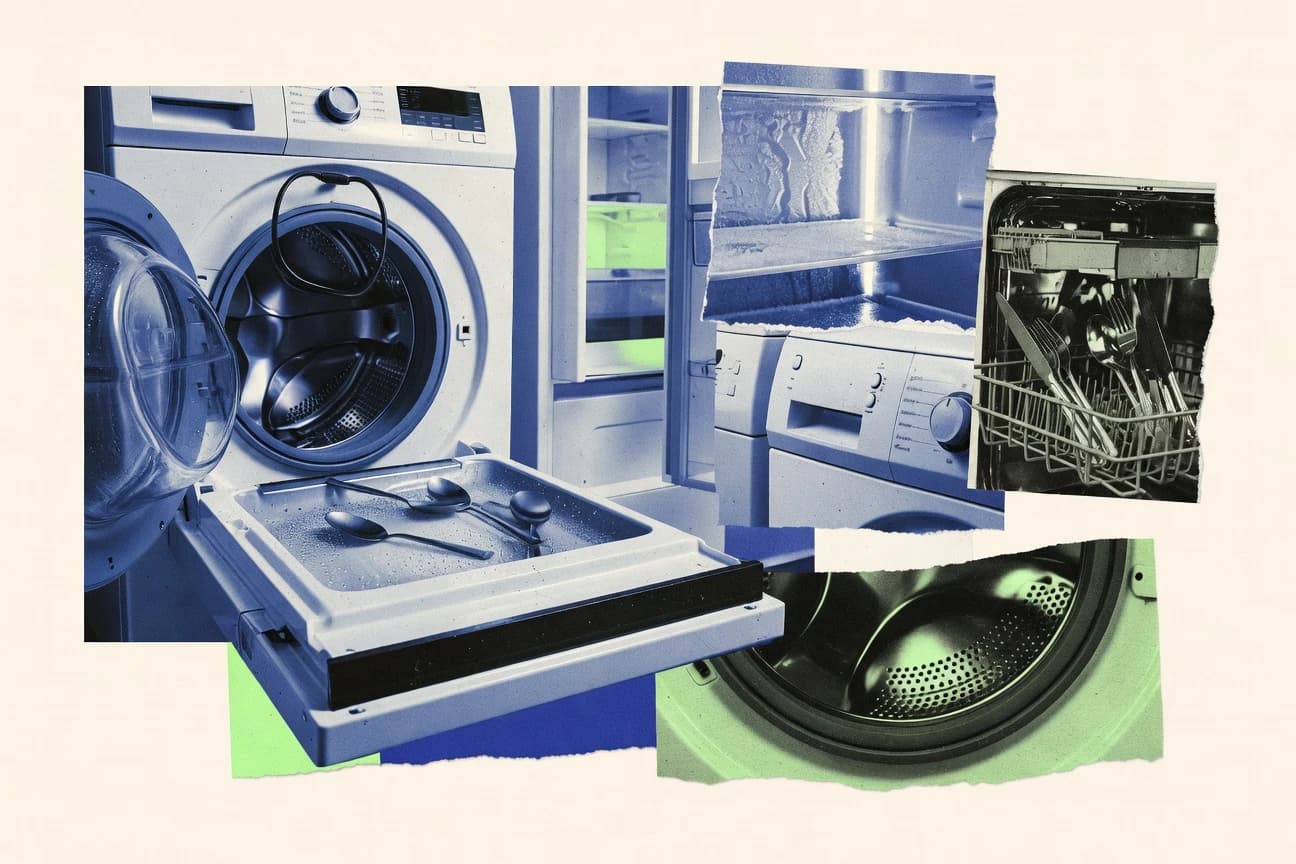
White Goods Industry Statistics
See how global white goods demand is reshaping the market, from the sector valued at USD 428.5 billion in 2022 and forecast to reach USD 627.3 billion by 2030 to Europe’s EUR 45.2 billion in 2023. The page also tracks what is driving growth including smart, energy efficient, and connected products, alongside real shipment and sales volumes across key categories like refrigerators, washing machines, and air conditioners.

Water Cooler Industry Statistics
From touchless hygiene to smarter, greener filtration, this page turns global water cooler preferences into clear buying and policy insights, with standout proof like 62% of the world’s point of use market already choosing POU coolers in 2023. Expect practical guidance you can actually use, whether you manage an office, run a clinic, or just want the safest, most convenient hydration setup at home.
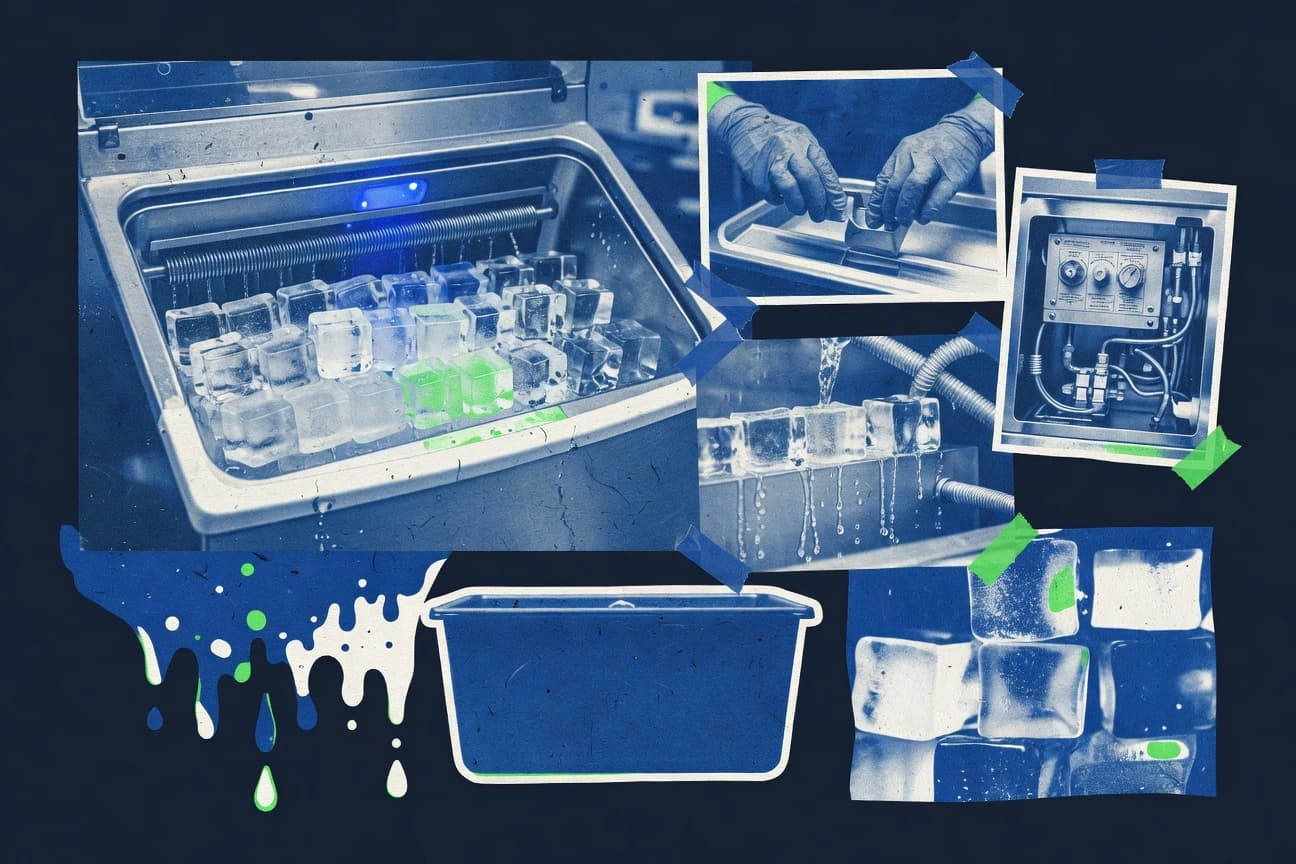
Ice Maker Industry Statistics
Discover how commercial and residential ice makers are evolving, with global commercial installations reaching 2.8 million units in 2023 and cube ice still holding 58% share through 2028. If you work across foodservice, hospitality, or equipment planning, this snapshot of demand, regional leadership, and energy trends like 8 kWh per 100 lbs will help you benchmark what is changing and what to watch next.