GITNUX MARKETDATA
Browse Our Category
Home And Kitchen Appliances
Latest update:


Lawn And Garden Industry Statistics
Smart, greener gardening has surged, with U.S. gardeners reporting mental health benefits in 71% of cases, while electric tools and native plants shift how households spend 4.2 hours a week maintaining their lawns. This page connects the personal and the practical, from smart gardening app adoption among 55+ consumers at 37% to 2023 global market momentum of USD 122.6 billion and a 4.8% CAGR through 2030.
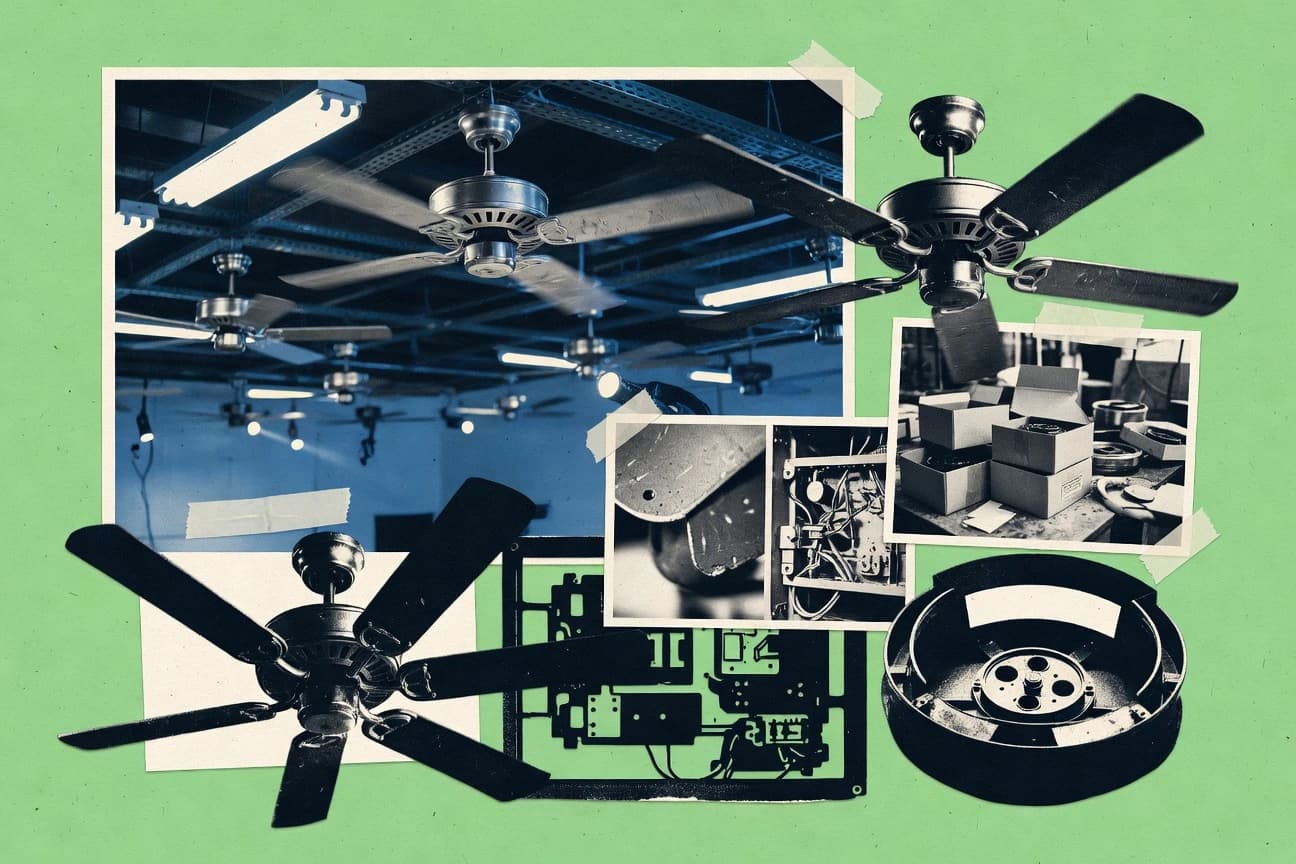
Ceiling Fan Industry Statistics
Smart ceiling fans are moving fast with 12% adoption among new urban buyers in India in 2023 and BLDC technology now driving 25% of new sales, even as remote control sits in 95% of global shipments. Read for the contrast between demand and delivery like a global market scale up to USD 15.8 billion by 2028, and tight supply chain pressure such as a 45 day production lead time and 20% chip shortages that shape what households can buy.
Home Appliance Industry Statistics
With 53% of consumers aged 25 to 34 buying small appliances online in 2023 and 35% global penetration for Wi Fi connected appliances by 2023, demand is shifting fast from basic functionality to connected convenience. At the same time, energy and sustainability pressures are reshaping buying choices, from 68% of US consumers preferring energy efficient models to 76% of Brazilian shoppers factoring sustainability into what they take home.
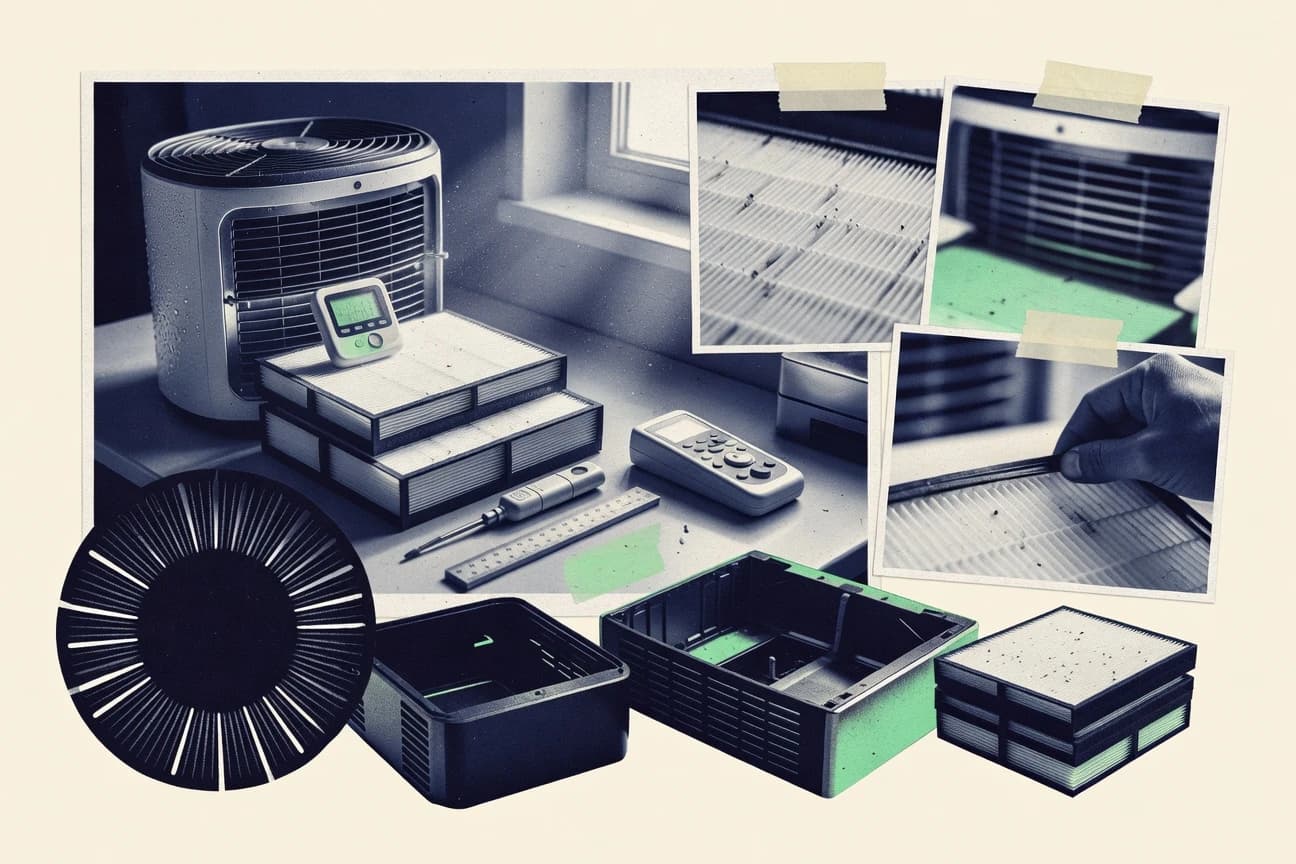
Air Purifier Industry Statistics
Smart home buyers are chasing HEPA plus medical grade reassurance, with 2023 survey data showing 72% of consumers prefer HEPA-filtered purifiers for allergies, while makers like Philips, Dyson, and Honeywell split the market in sharply different ways by region and price tier. See how technology adoption and buying behavior are colliding, from IoT and app control reaching 62% of online sales to wildfire smoke driving 48% of US purchase reasons, plus the fastest growing segments shaping where the market is headed by 2032.
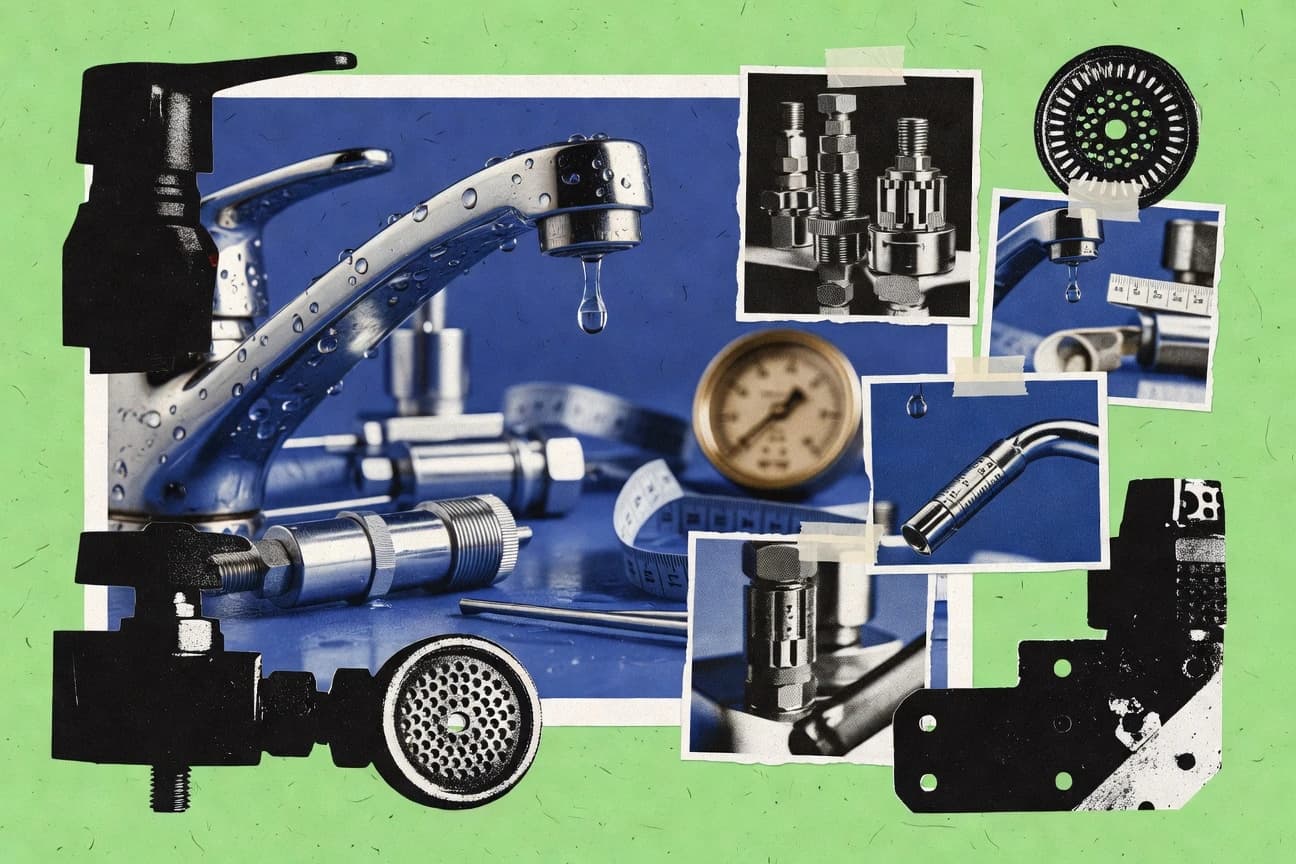
Faucet Industry Statistics
Next to water-saving mandates and smart upgrades, buyers are voting with their wrists and wallets. From online shopping driving 42% of US faucet sales to 71% prioritizing water-saving features plus the global faucet market forecast hitting $45 billion by 2027, this page explains what is reshaping faucet choices, from matte black to touchless hygiene, and why replacement cycles still run 8 to 10 years.
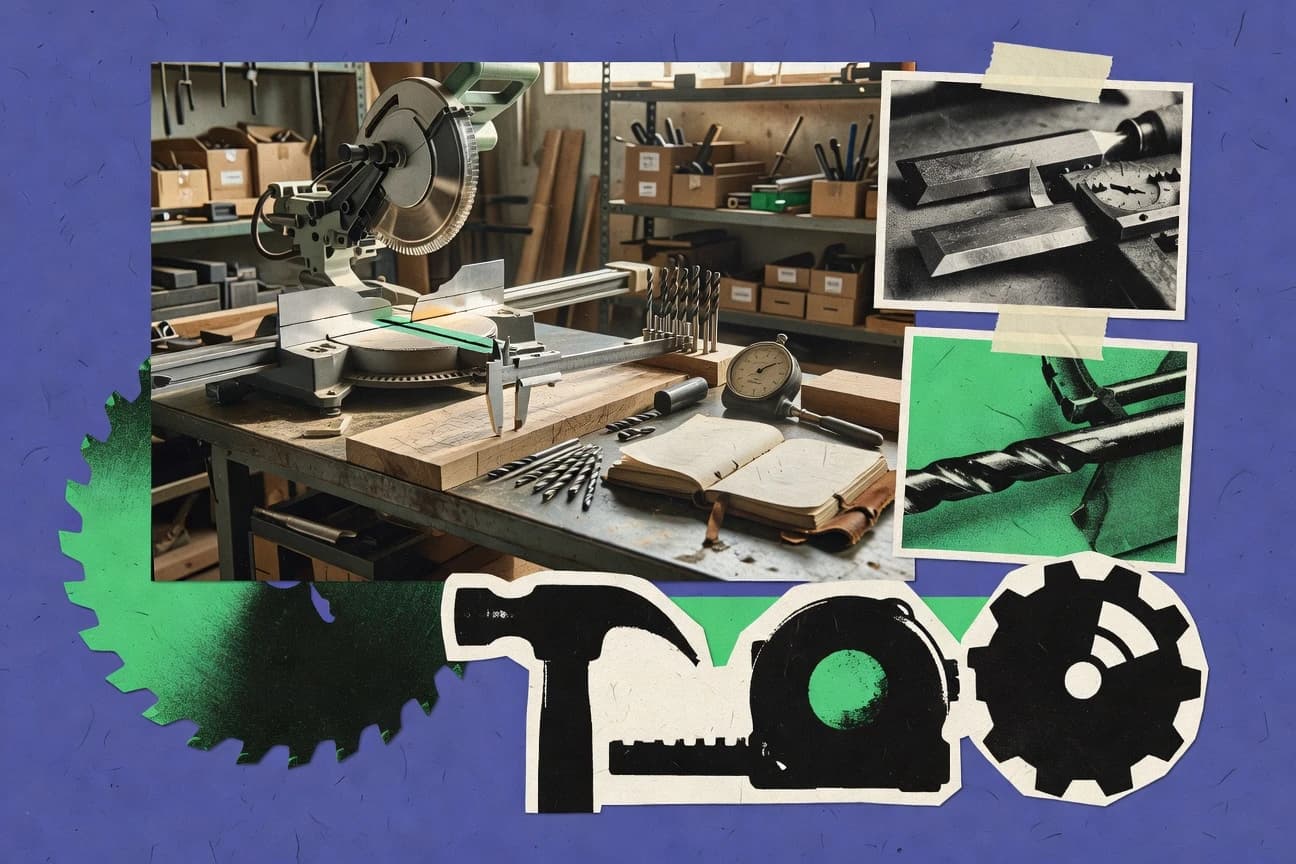
Woodworking Tools Industry Statistics
Woodworking tools are forecast to rise from USD 12.5 billion in 2022 to USD 18.7 billion by 2030 with a 5.2% CAGR, but the sharper story is how 2023 tech and channels are reshaping demand, with online sales up 25% and dust extraction integrated into 55% of new power tool releases. From North America’s 35% market share to Asia Pacific’s 6.8% fastest growth and a shift toward cordless and lithium ion, this page pinpoints what is driving buying decisions across DIY and professional shops.
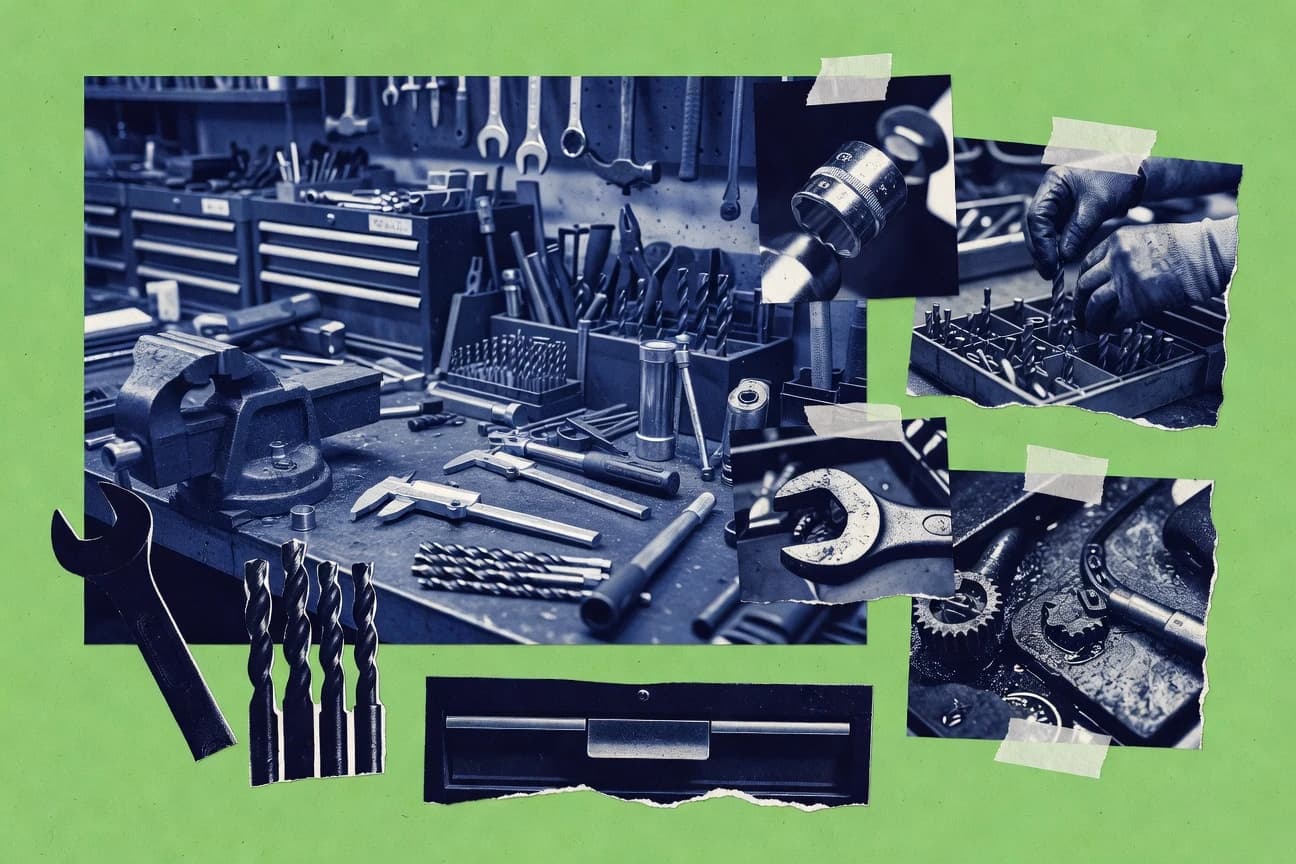
Tool Industry Statistics
From worker counts and average wages to automation and market growth, this Tool Industry stats page tracks how the sector’s labor muscle and tech momentum are reshaping everything at once. With 2023 U.S. tool manufacturing employment at 68,500 and a global tool market forecast climbing from USD 45.2 billion in 2022 to USD 62.8 billion by 2030, you will see why productivity gains and digital tools are now competing directly with global-scale hiring.
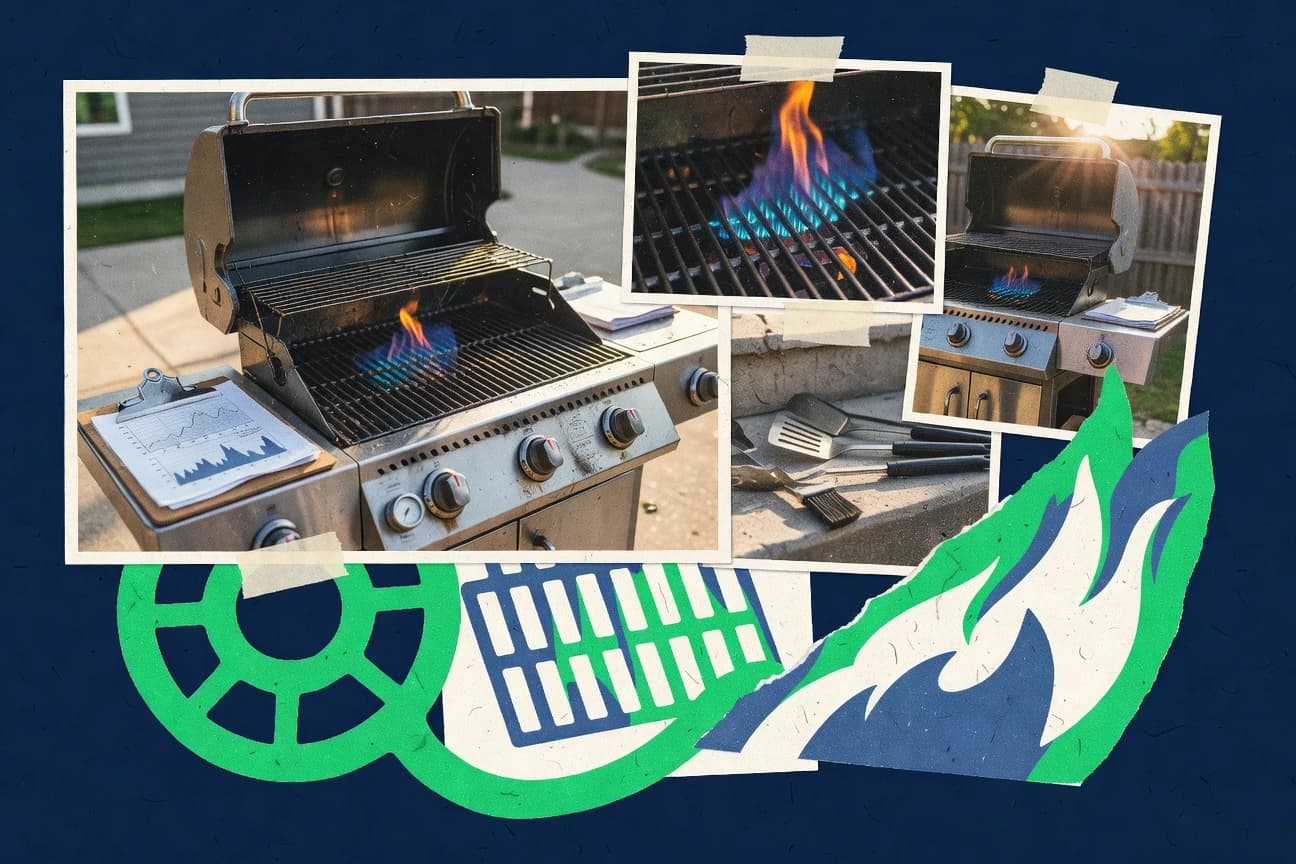
Outdoor Grill Industry Statistics
Gas grills are the default for convenience with 52% of US consumers choosing them, yet Gen Z is pushing the category toward eco-friendly builds where 72% prioritize sustainable materials, and smart connected features are now a major factor for 67% of college-educated buyers. You will see how purchasing behavior flips by lifestyle and place, from Southern ownership at 82% versus the 65% national average to 38% of apartment residents relying on electric tabletop units, plus what that means for 2025 upgrade, fuel, and design decisions.
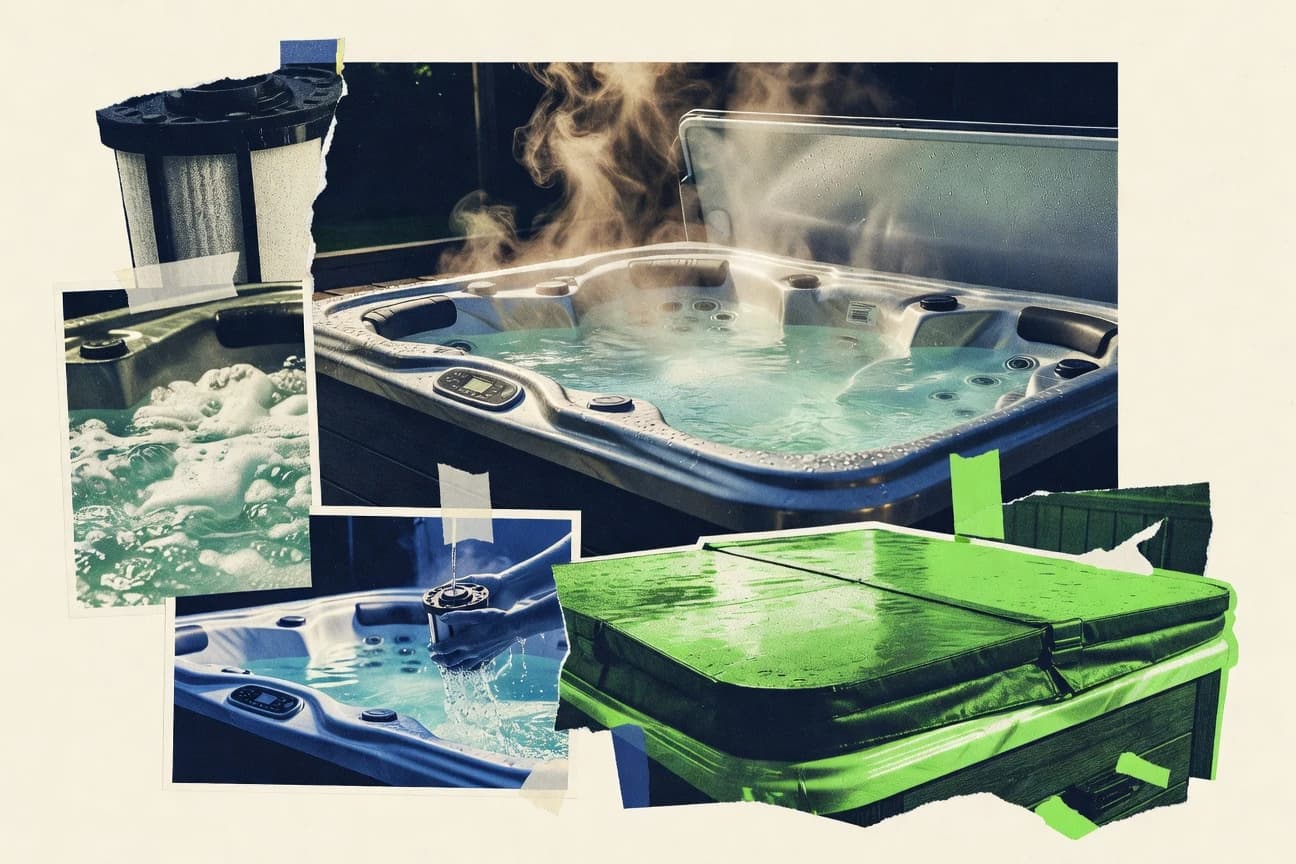
Hot Tub Spa Industry Statistics
With 45% of U.S. hot tub buyers in the 55 to 64 bracket and high income households driving 65% of sales, demand is getting both older and more upscale even as relaxation remains the top reason 62% of new owners cite it. If you want to spot where growth is hiding, the page contrasts therapy habits and tech friendly preferences, including 76% of U.S. owners using their hot tub at least three times weekly plus rising energy efficiency and app control adoption across buyers.
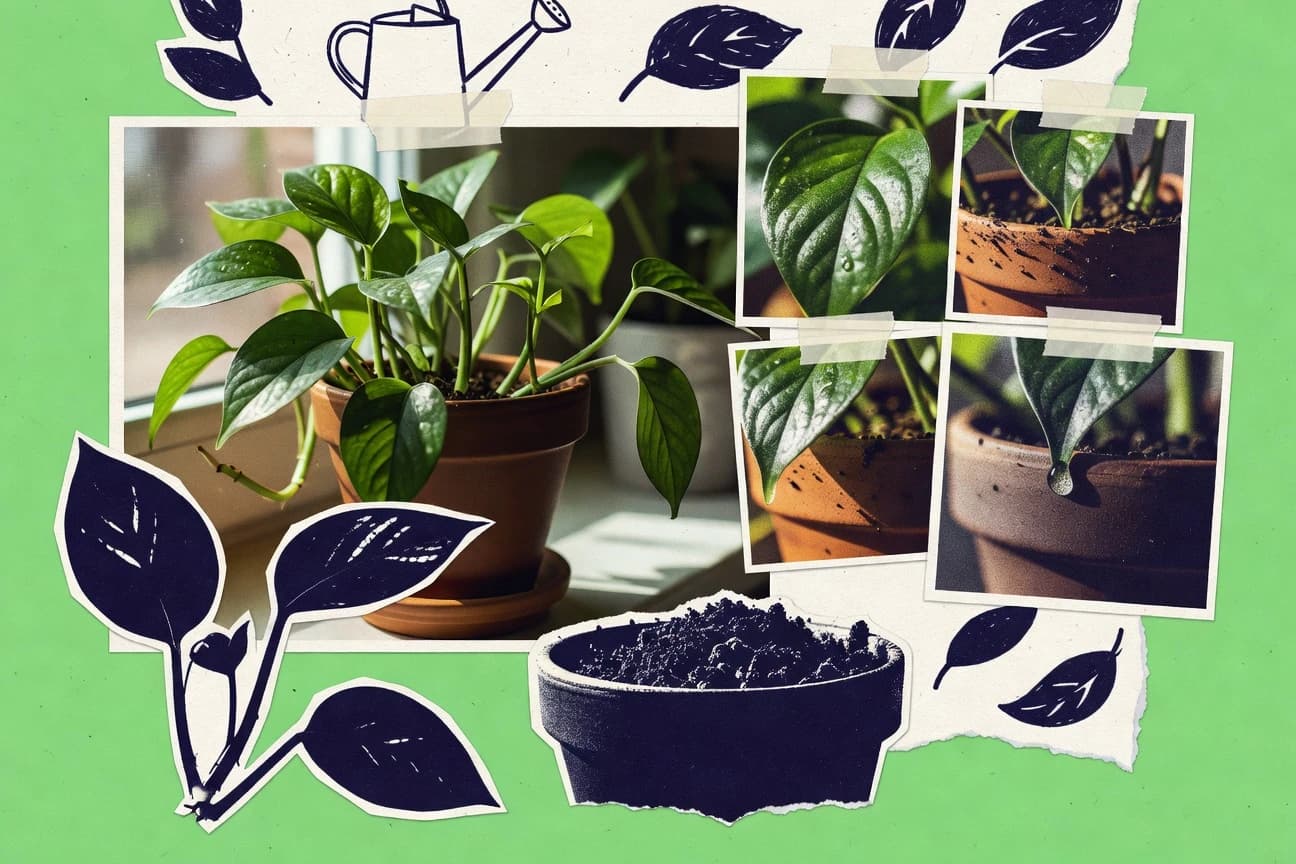
Houseplant Statistics
Spider mites hit 70 to 80% of dry air houseplants, while pests and diseases add up fast, from powdery mildew on 20 to 40% of African violet leaf surface to root rot that wipes out 50 to 70% of jade plants in waterlogged soil. This 2025 updated page turns those odds into practical cues, linking common culprits like mealybugs, aphids, thrips, and fungus gnats with the exact damage levels and environmental triggers so you can spot trouble before it multiplies.
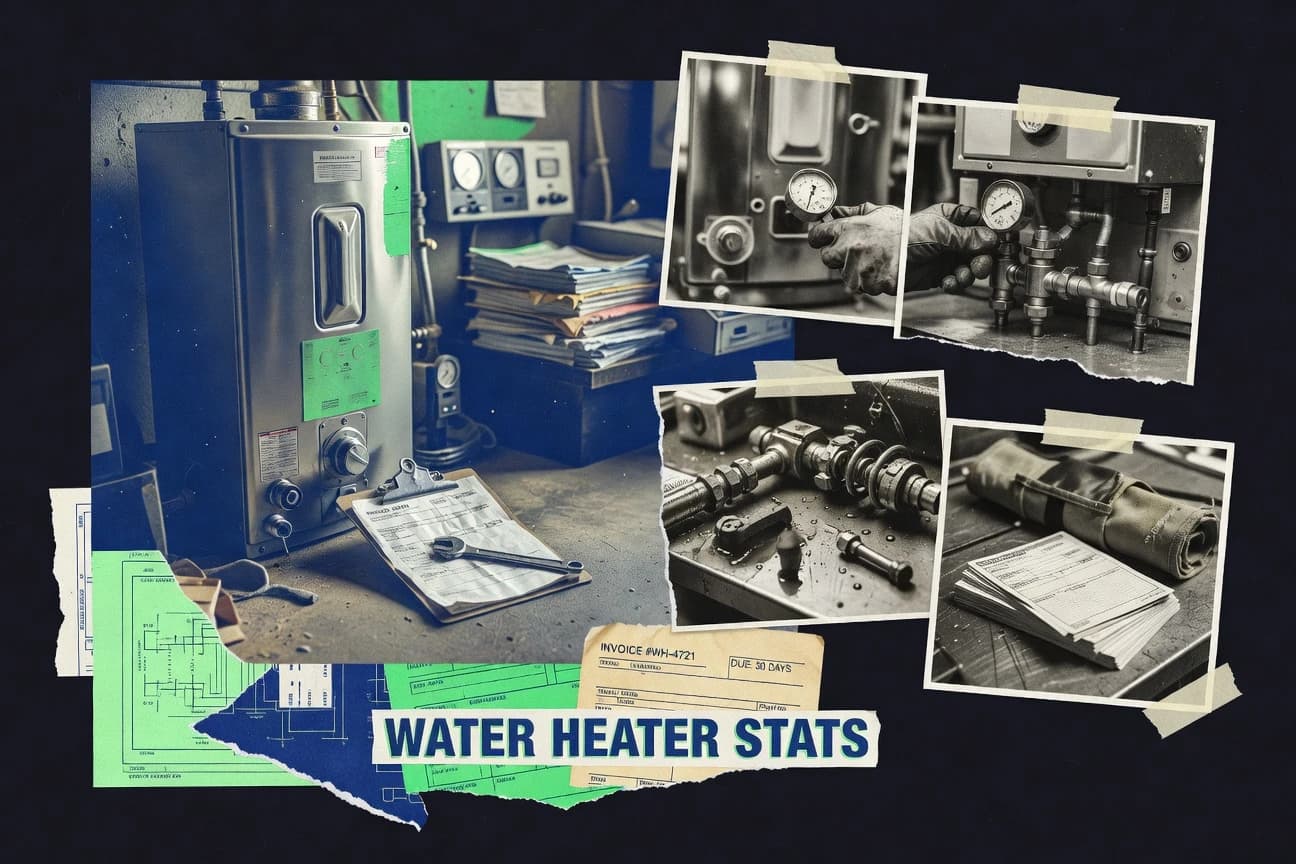
Water Heater Industry Statistics
With 72% of U.S. households still relying on tank heaters, the real story is how rapidly preferences are shifting toward efficiency and control, from 41% of Americans buying energy efficient models to 55% of U.S. millennials choosing WiFi enabled units in 2023. Track what these choices mean for cost and reliability too, including $450 average electric energy bills versus $250 for gas and 55% of replacements driven by leaks.
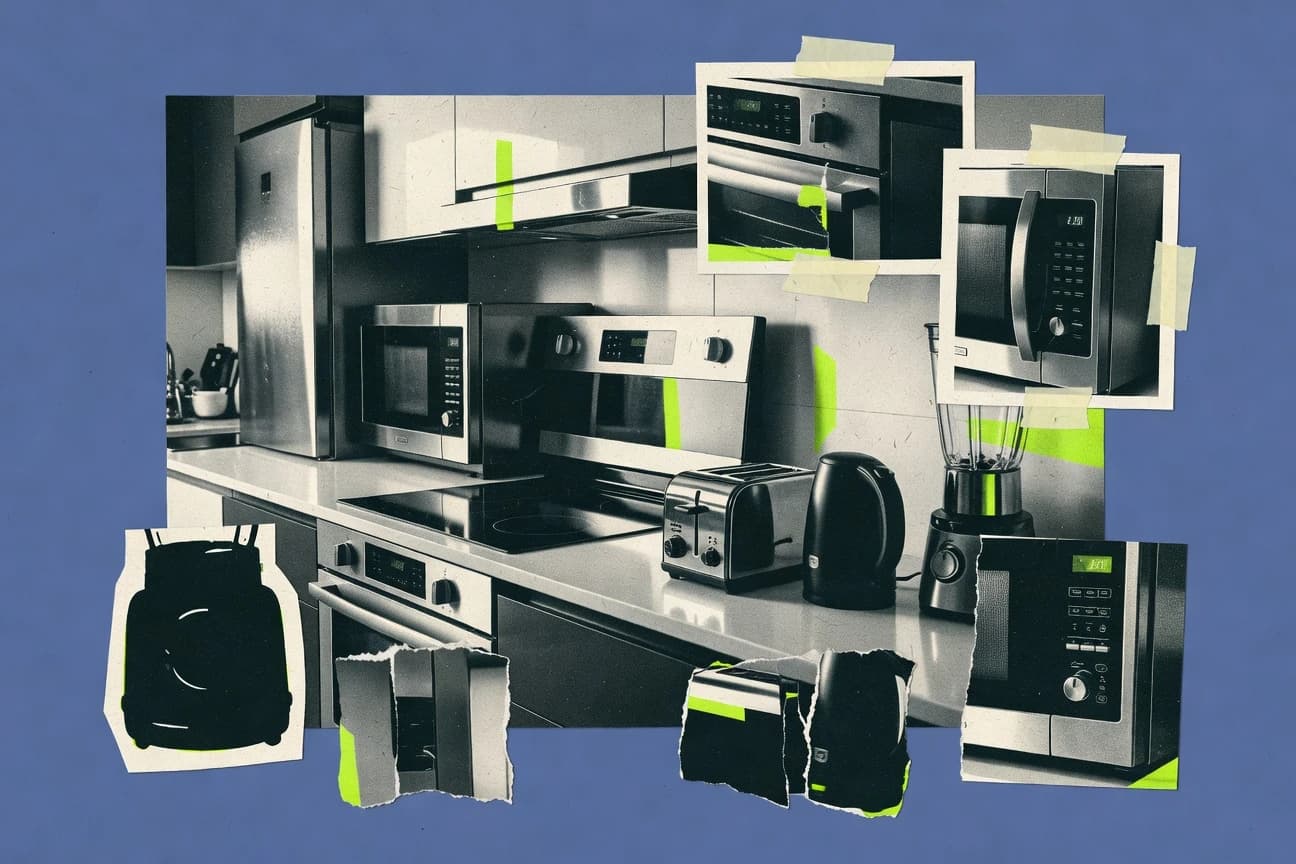
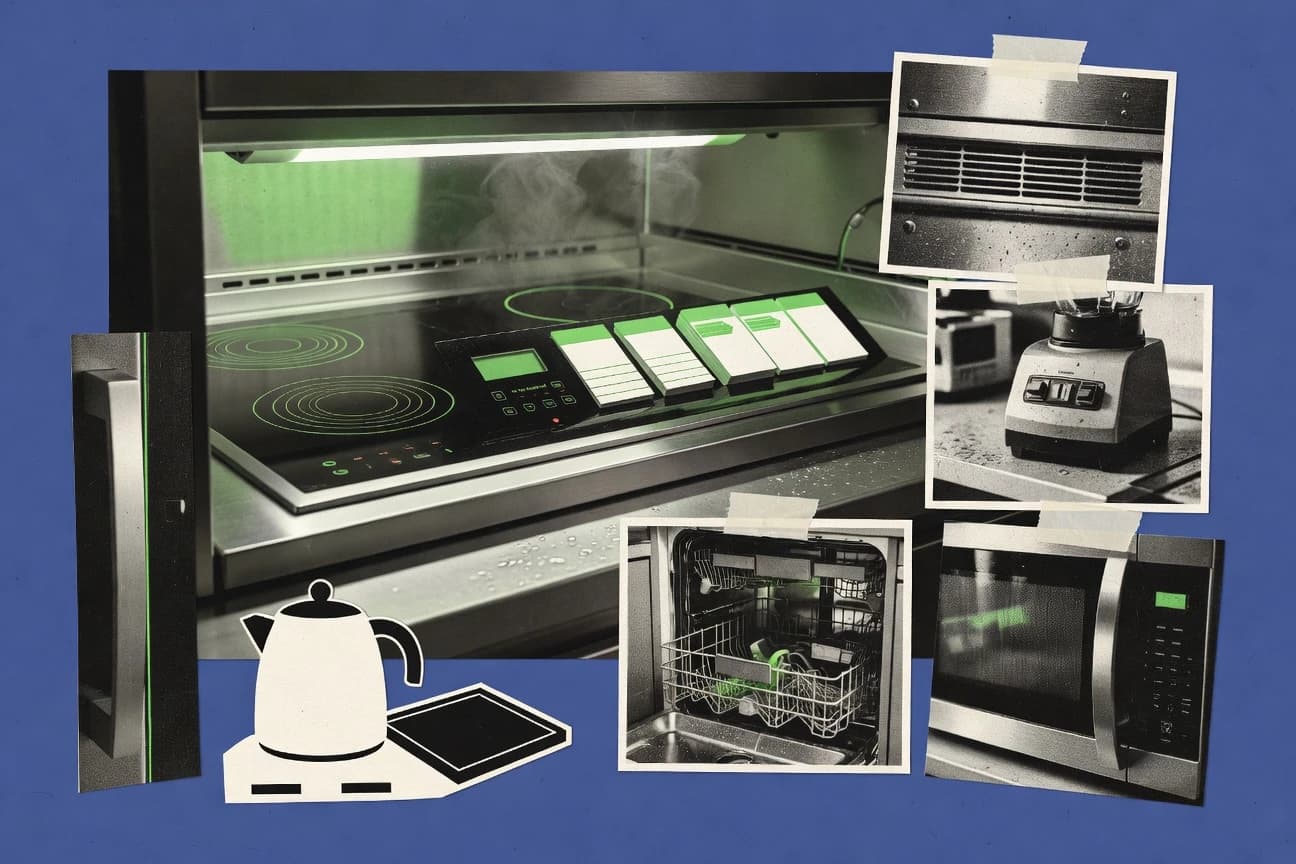
Kitchen Appliances Industry Statistics
Energy savings are no longer a niche priority with 65% of consumers favoring energy efficient kitchen appliances and 42% willing to pay a 20% premium, while demand for smart and space saving features keeps pulling buyers away from traditional models, from 72% of millennials prioritizing smart features to multifunctional appliance seekers worldwide. You also get a current market and product read powered by 2023 adoption and buying behavior, including 58% of US households upgrading to induction cooktops and air fryer sales jumping 120% among Gen Z from 2020 to 2023.
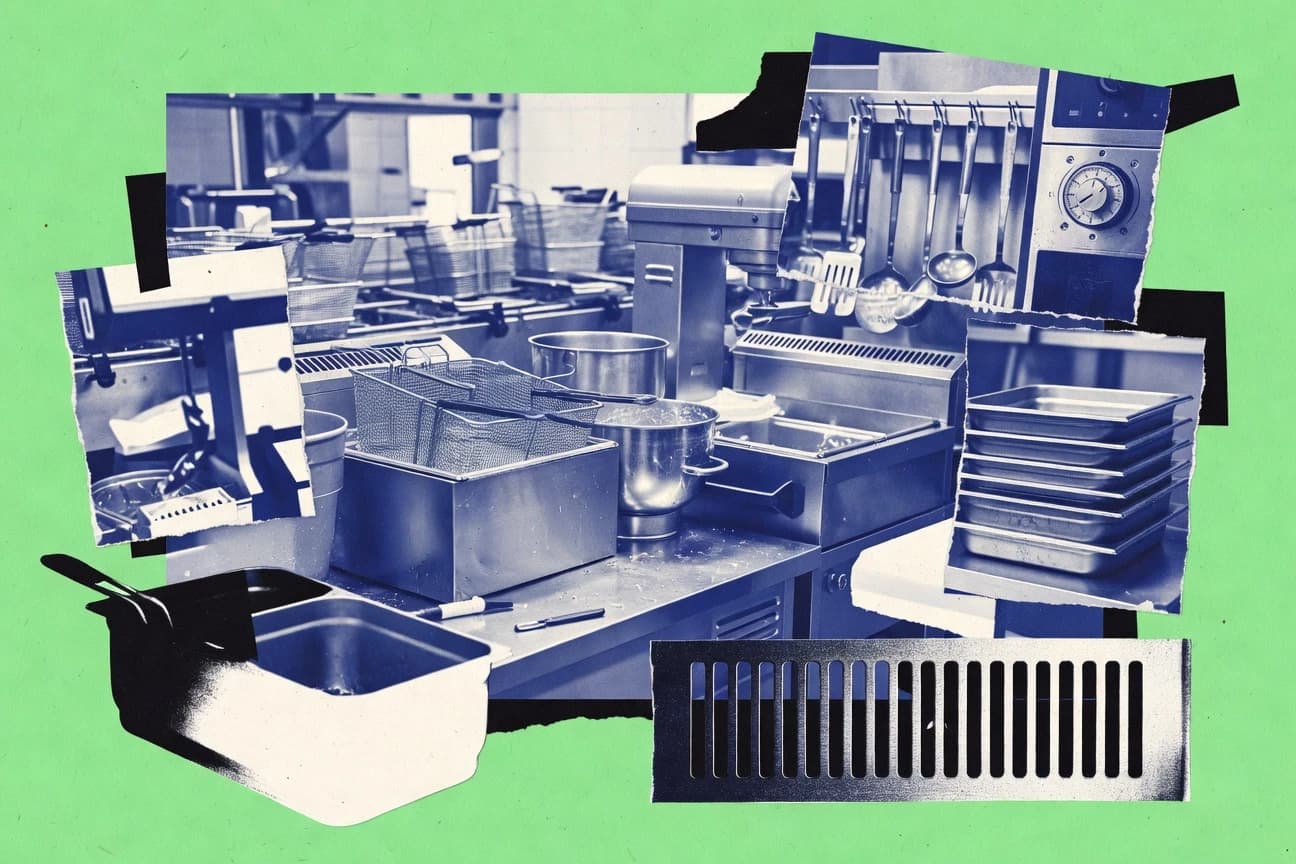
Kitchen Equipment Industry Statistics
Smart upgrades are reshaping kitchen equipment fast, with energy efficient adoption reaching 62% of commercial kitchens by 2023 and AI predictive maintenance cutting downtime by 25% in 18% of industrial kitchens. At the same time, premium homes are driving the user facing shift with voice activated appliances now at 22% and contactless operation features appearing in 65% of new prep equipment, revealing why sustainability and automation are becoming the real competition, not just add ons.
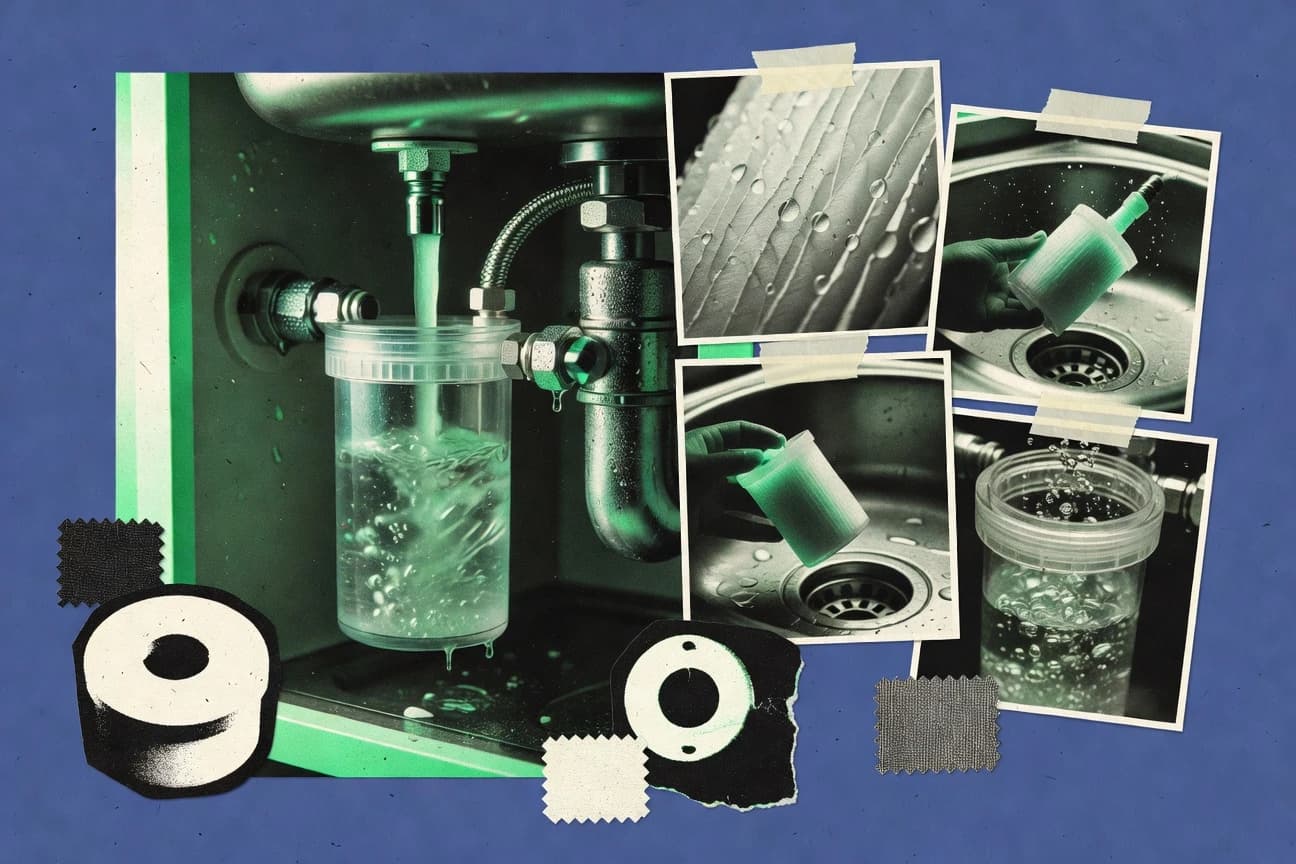
Water Filter Industry Statistics
With the PFAS rule now setting hard targets of 4.0 parts per trillion for PFOA and 4.0 parts per trillion for PFOS, you will see why filtration is no longer just about taste and scale but about meeting enforceable removal and materials standards like NSF/ANSI 53, 58, 372, and 61. Pair that regulatory pressure with household performance realities and market pull such as 2023 global point of use filtration growth to a projected $19.8 billion by 2030 and the choice between activated carbon, RO, microfilters, and UV gets sharper fast.
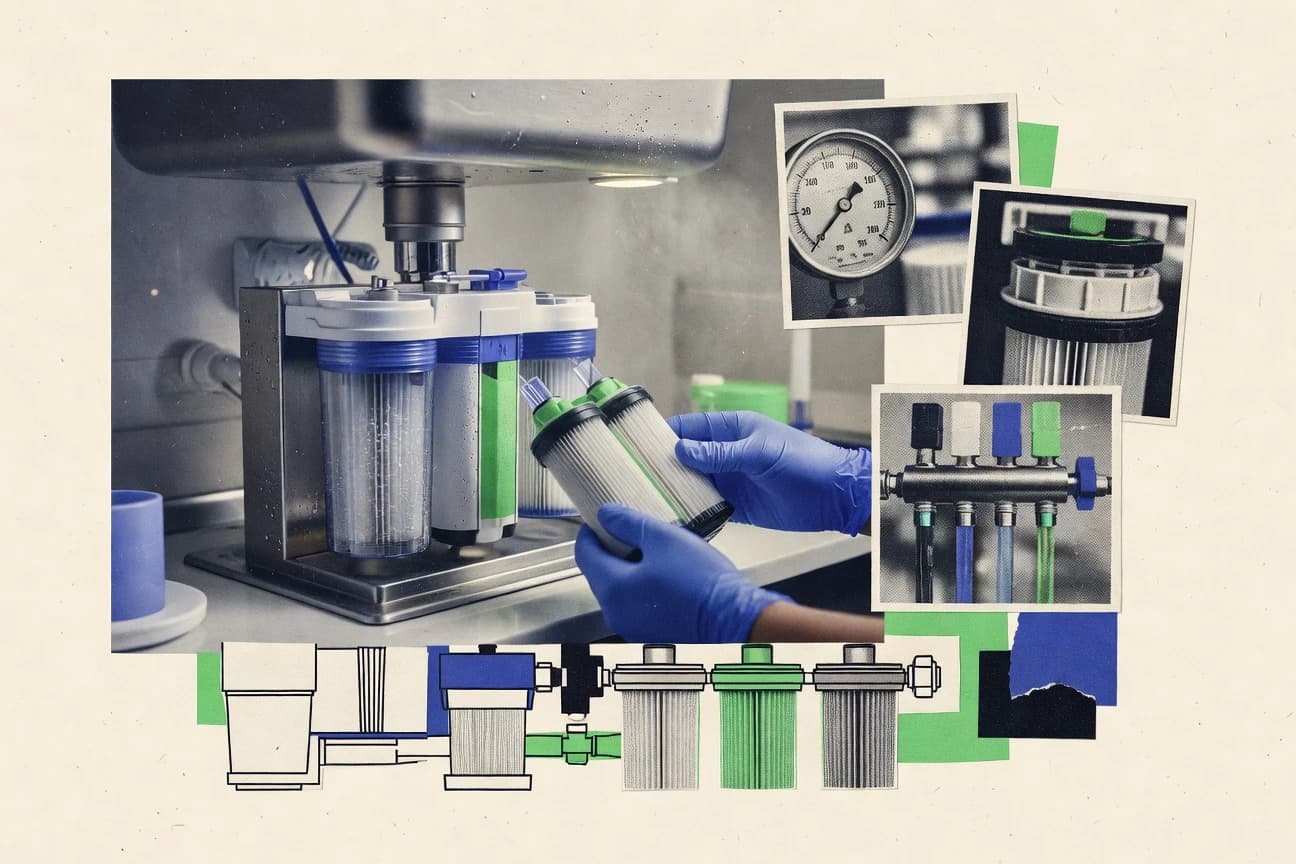
Water Purifier Industry Statistics
From 2023 household adoption to 2025 replacement cycles and certified filtration expectations, this page maps how buyers are shifting toward smarter, multi-stage purifiers, with 55% of residential RO expansion in Asia expected by 2025. You will also see where the big brands stand and why decisions are increasingly driven by real health outcomes, online reviews, and subscription based maintenance alongside tech leapfrogs like real time contaminant sensing.
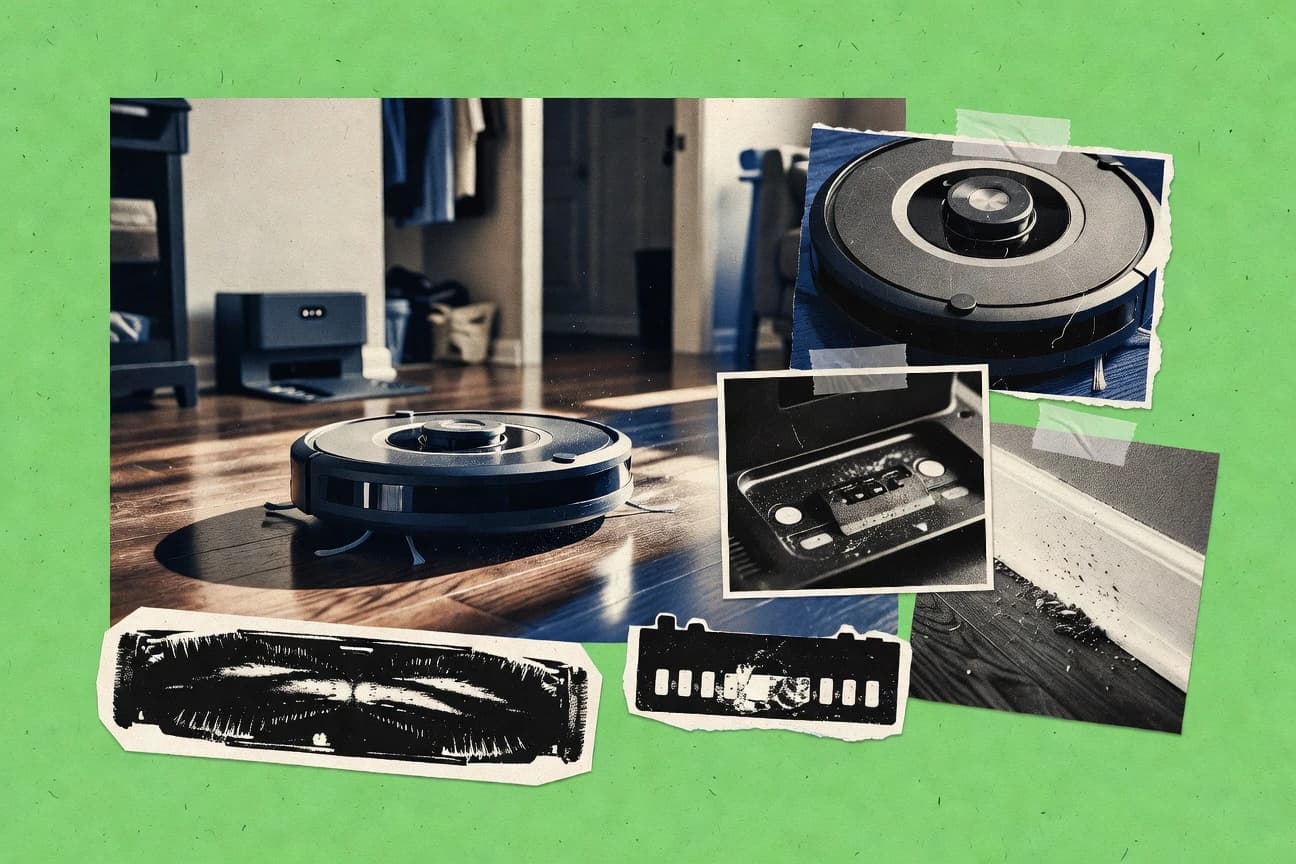
Robot Vacuum Industry Statistics
Robot vacuum adoption is moving past novelty, with 9.7% of U.S. households owning one in 2023 and Europe holding a 24.0% share of the market in a 2022 forecast. At the same time, regulations, power use rules, and real performance specs are tightening, from energy labeling and battery recycling duties to suction ratings up to 6,000 Pa and typical noise levels around 60 dB(A), so the “smart clean” story is now as much compliance and engineering as convenience.
Kitchen Appliance Industry Statistics
US kitchen appliance decisions increasingly hinge on smarter, more efficient tech, from 24% of households owning a smart kitchen appliance category to consumers favoring app enabled features at 49%, while energy efficiency rules are tightening through EU ecodesign and measurable reductions in refrigerator freezers’ annual energy use. Yet the consumer shift meets real world cost and reliability pressure with 2.3 million product returns in 2023, a 16.5% U.S. PPI jump for household appliances and furniture as a cost proxy, and guidance that an efficient dishwasher can cut water use by about 5,000 gallons per year.
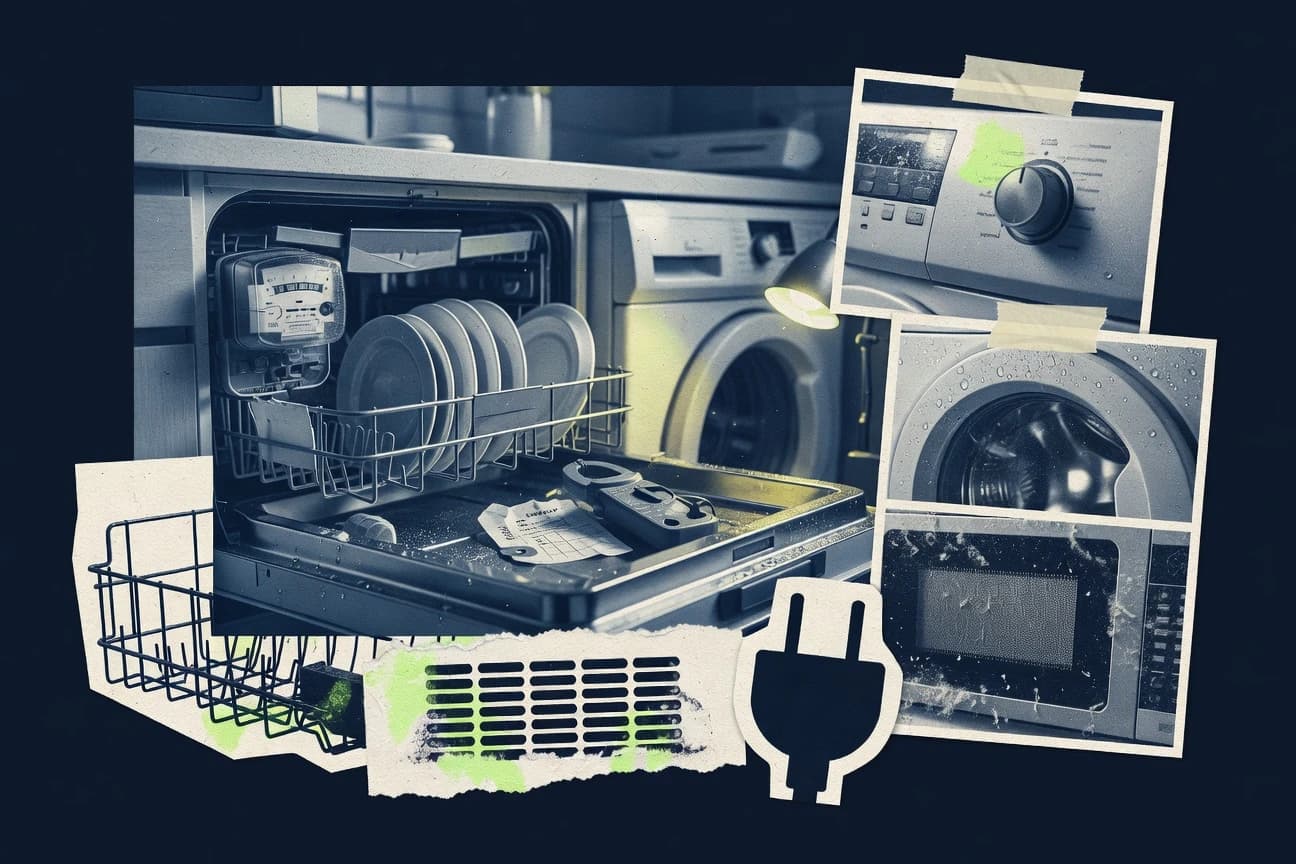
Dishwasher Industry Statistics
US households that own a dishwasher climbed to 68% in 2023, but what people buy is shifting fast as smart and water saving features pull attention away from basic cycles. From 42% of millennials favoring app connected models to 55% of Europeans choosing energy efficient units and 35% of urban dwellers turning to compact designs, these 2023 figures explain why quiet tech, eco materials, and connected controls are becoming the new baseline for dishwasher buyers.
Appliances Industry Statistics
With 35% of Europe buying appliances online, up sharply from pre-pandemic levels, and U.S. Eco-labels shaping 41% of major appliance decisions amid inflation delays, this page connects purchase behavior to smarter, cleaner, and more connected products. It also tracks fast tech adoption like 22% of U.S. homes using robotic vacuums in 2023, alongside sustainability and price pressure seen in markets from 45% EU energy efficient preferences to 62% of Indian small appliance buyers prioritizing cost.
Power Tool Industry Statistics
US power tool shipment value grew 3.5% year over year in 2023, while global market forecasts call for a 4.8% CAGR through 2032, even as pro users increasingly favor 5.0Ah+ packs and contractors lean on battery tools when jobsite power is unavailable. It also weighs the safety and cost pressure points, from silica exposure and stricter EU vibration rules to battery charging costs under $0.10 per full charge and brushless maintenance savings of about 30% over three years.