GITNUX MARKETDATA
Browse Our Category
Home And Kitchen Appliances
Latest update:


Heating Industry Statistics
From aging gas boilers and stalled heat pump adoption to the rapid rise of smart controls and cleaner district heating, this page maps what is driving residential and commercial heating choices and emissions. It also highlights the scale of the transition, like Europe’s gas boiler homes where 48 million units are over 15 years old, alongside the US potential to cut up to 170 MMT CO2 by 2030 through heat pump rollout.

Dehumidifier Industry Statistics
With the global dehumidifier market projected to reach USD 7.25 billion by 2030 at a 7.5% CAGR, the signals are clear that humidity control is no longer a niche purchase. From 67% of buyers swayed by online reviews to smart units growing 31% faster among millennials and 48% of non buyers citing noise concerns, this dataset connects what people want with how the industry is evolving across regions and segments.

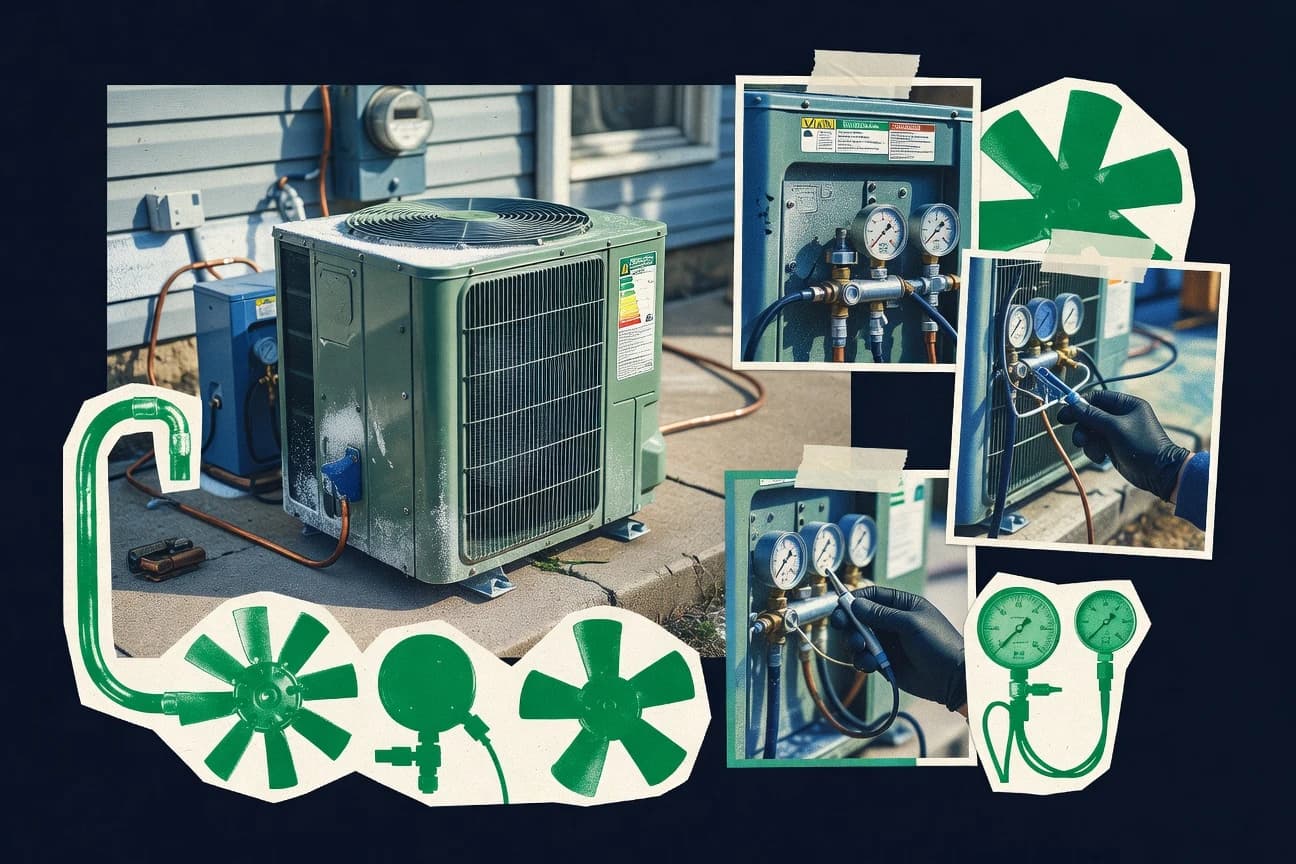
Air Conditioner Industry Statistics
In 2023, 65% of US households owned at least one air conditioner, and online channels delivered 37.2% of global AC sales revenue. The numbers get even more revealing as energy efficiency, smart features, financing, and seasonal peaks reshape what people buy and how the market grows. Dive in to see the full dataset behind cooling habits, technology shifts, and the sustainability impact driving the industry forward.

Kitchen Knife Industry Statistics
With 72% of US consumers favoring Santoprene ergonomic handles, the kitchen knife market is already telling you exactly what feels right in real use. From Japanese-style gyuto and lightweight sub 200g picks to sharpness retention, smart features, and sustainable packaging, these 2023 to 2024 signals reveal how buyers choose and why. Explore the full dataset to see which trends dominate by region, brand, and buying channel.
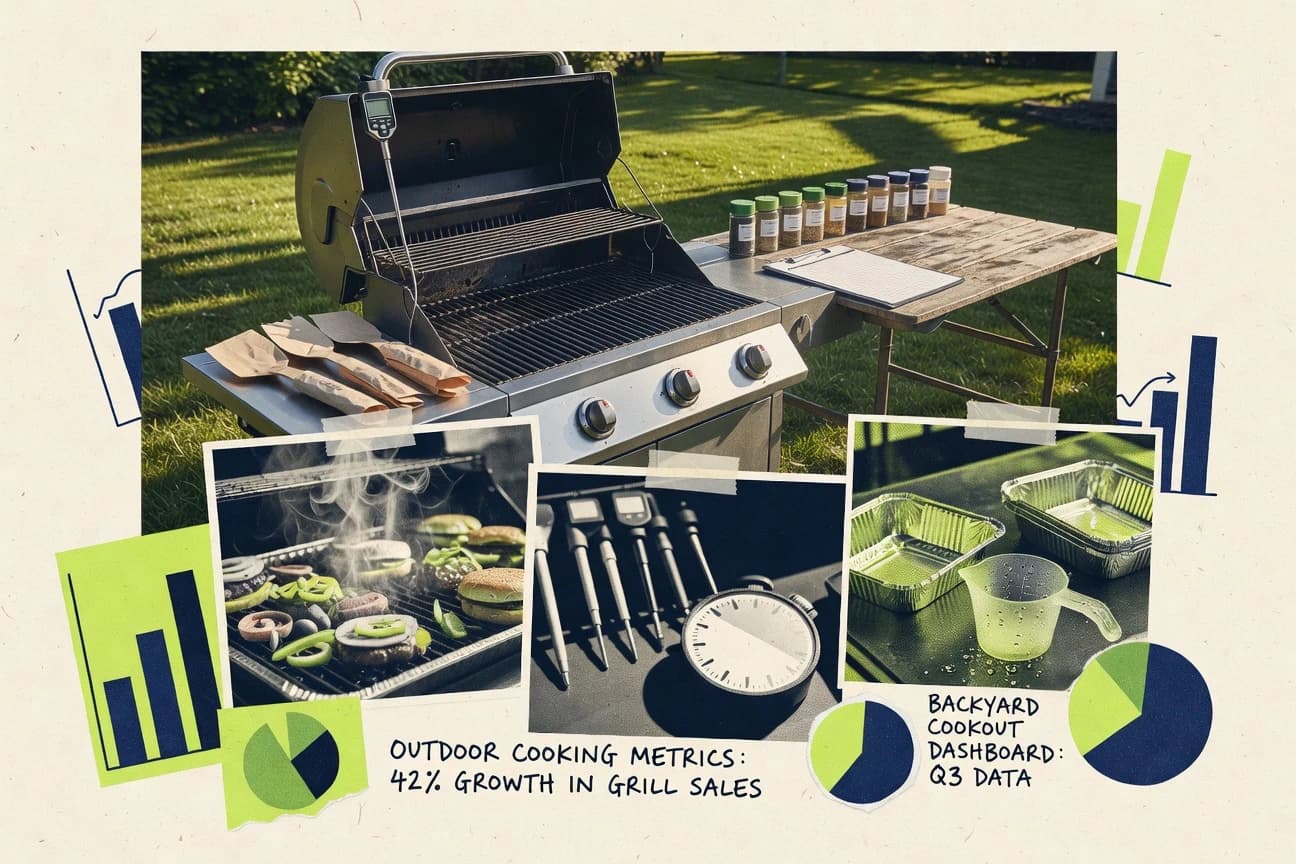
Outdoor Cooking Industry Statistics
Seventy five percent of U.S. adults grilled in summer 2023, the highest level on record, and the habits behind that spike are surprisingly varied. From 68% of households owning a grill or smoker to rapid shifts toward smart and electric models, this post breaks down who is buying, what they cook, and how trends like grilling beyond meat and more winter grilling are reshaping the market. You will see the full mix of demographics, preferences, and retail growth that makes outdoor cooking feel more like a year round culture than a seasonal pastime.

Air Conditioning Industry Statistics
With global cooling demand driven by urban heat, AC ownership reached 32 per 100 households in 2022, up from 25 in 2010, and new installations keep climbing. The post tracks how quickly adoption is shifting across regions, from India’s urban penetration and daily usage to record heatwave surges in Europe and soaring data center cooling needs in the US. You will also see how efficiency rules, smart controls, and refrigerant changes are reshaping energy use and industry jobs, country by country.

Home Appliances Industry Statistics
Energy-efficient appliances still top decision making with 68% of global consumers prioritizing efficiency in 2023, while 73% say brand reputation matters just as much. This post maps the shifts reshaping the home appliances industry, from the rise of smart and connected features to eco materials, online sales, and changing replacement cycles. You will find how factors like safety, noise concerns, and even pet hair needs are pushing product design and market growth.

Lawn Mower Industry Statistics
With 67% of U.S. households owning a lawn mower and electric options accelerating fast, the data behind backyard upkeep is more dynamic than most people expect. From weekly mowing habits and generational preferences to robotic adoption rising to 18% among high income homeowners, these 2023 and recent figures map exactly what drives purchases, satisfaction, and even emissions.

Hot Tub Industry Statistics
$2.4 billion is what the US hot tub market was worth in 2023, and the numbers behind that growth are just as revealing as the headline. From why stress relief drives 62% of purchases to how smart tech, eco preferences, and regional differences shape buying decisions, this dataset paints a clear picture of who is buying and why. Take a closer look and you will find patterns you would not expect, including shifting demographics, installation preferences, and how online research is changing the timeline to purchase.

Pizza Oven Industry Statistics
Global pizza oven revenue hit USD 1.35 billion in 2023, with the market split across everything from Ooni home units to TurboChef high speed commercial lines. This post breaks down the numbers behind brand dominance, regional demand, buying habits, and the shift toward faster, smarter, and greener ovens. By the end, you will be able to map who sells what, where it is growing, and why 2023 purchase decisions look so different from 2020.
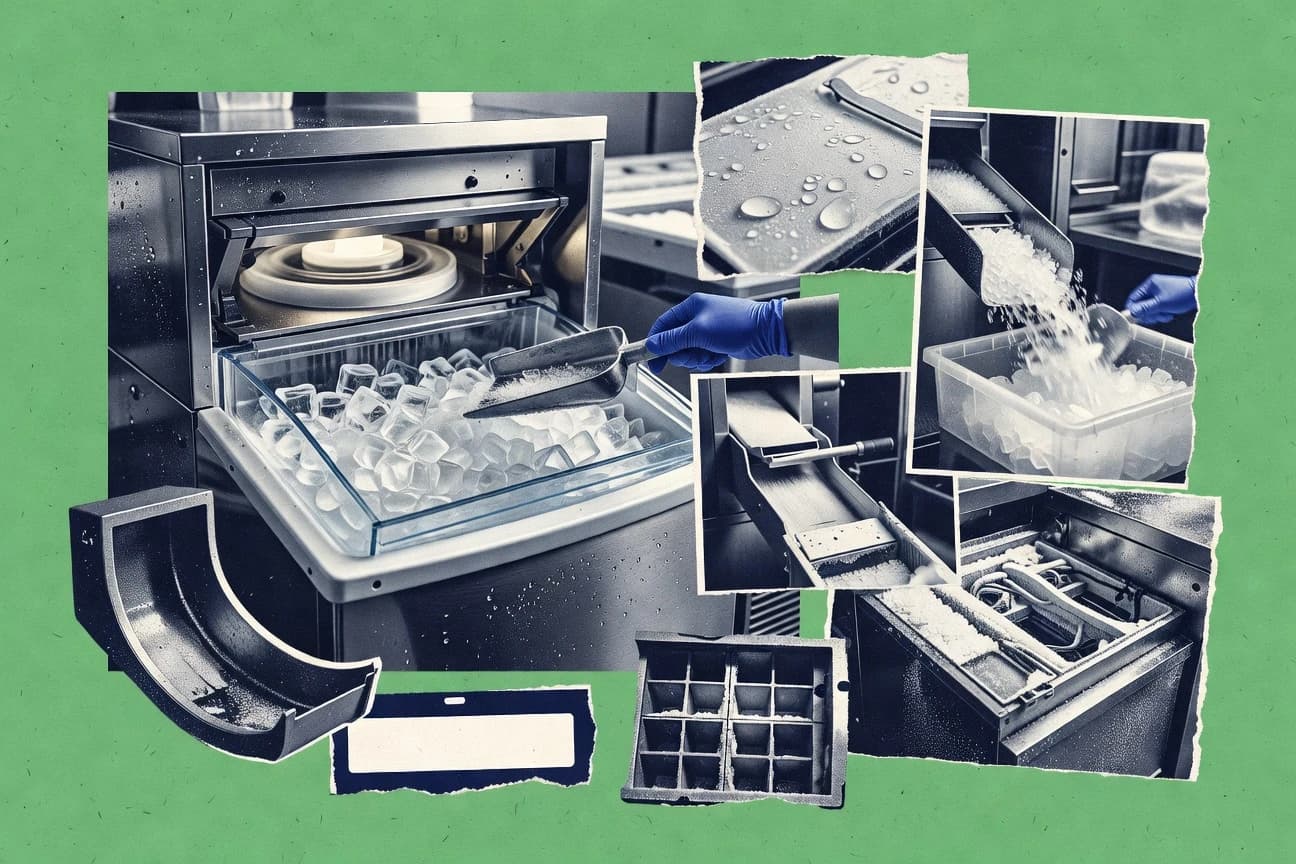
Ice Machine Industry Statistics
The global foodservice equipment market reached $149.7 billion in 2022 and is forecast to grow to $207.0 billion by 2030, with ice machines playing a bigger role than most people realize. From North America at $55.1 billion to Europe at $45.6 billion and Asia Pacific at $38.2 billion, the numbers point to why chefs, restaurants, and drive thru programs keep demanding steady ice supply. Dive into the full breakdown to see how installed bases, restaurant counts, hospitality tourism, and even energy standards shape commercial ice maker demand.

Laundry Statistics
U.S. laundry services brought in $11.2 billion in 2023, with 4,068 businesses and about 129,400 people employed. From energy and water use to microfibers in waterways and what drives consumers to wash in cold or hot water, this post pulls together the numbers behind everyday laundry choices and the detergent market. It also maps how regulations and efficiency standards shape what ends up in your washer and dryer.

Washing Machine Industry Statistics
The global washing machine market is growing steadily with rising demand for energy efficient and smart features.

Grill Industry Statistics
The global grill industry is expanding rapidly, fueled by innovation and widespread consumer demand.

Pressure Washer Industry Statistics
The pressure washer industry is growing steadily due to rising residential demand and electric model popularity.

Bed Bug Statistics
Bed bugs complete their life cycle in just over a month and can rapidly create a major infestation.

Power Tools Industry Statistics
The power tools market is growing steadily as cordless tools dominate and DIY demand rises.

Kitchenware Industry Statistics
The global kitchenware industry is growing steadily and valued in the hundreds of billions.

Appliance Industry Statistics
The global appliance market is steadily expanding as consumers increasingly adopt smart and energy-efficient products.
Heat Pump Industry Statistics
The global heat pump industry is booming with strong growth and significant environmental benefits.