GITNUX MARKETDATA
Browse Our Category
Food Service Restaurants
Latest update:


Cafe Industry Statistics
Cafe habits are shifting fast with 68% of customers ordering via mobile apps and 65% of U.S. consumers visiting cafes weekly, yet comfort cues like Wi Fi and outdoor seating are becoming the differentiator since 66% want free Wi Fi and 47% prefer outdoor seating post pandemic. Specialty rules the counter too, with espresso making up 70% of cafe sales and demand for plant based milk jumping 28% while global growth targets $406.23 billion by 2030 signal plenty of room for new formats that keep customers coming back.

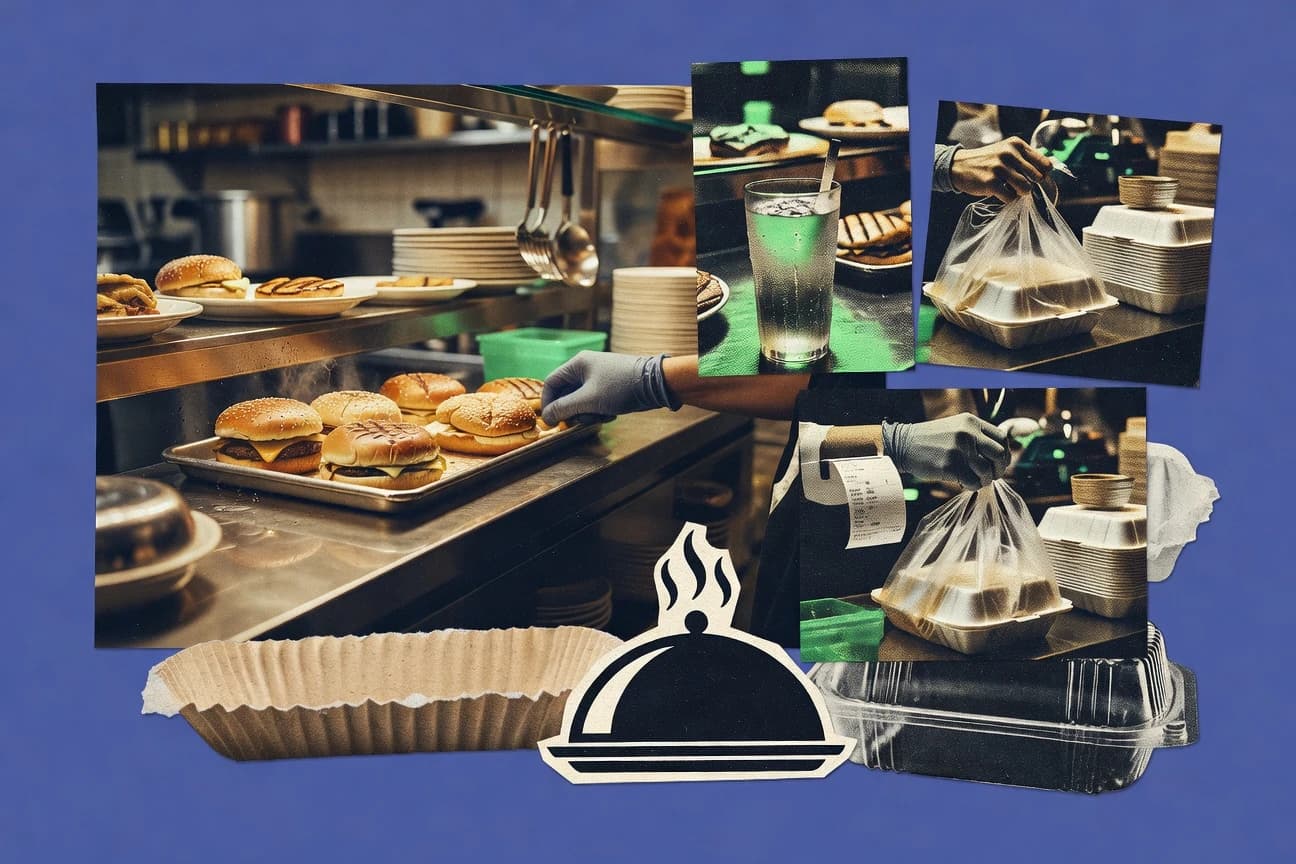
Online Food Ordering Statistics
Convenience is winning, but speed and trust are the price of admission. From Friday peaks and 80% of consumers abandoning orders over a 60-minute wait to 63% preferring family delivery over dining out, this page maps what makes online food ordering stick, plus where platforms are heading next in market growth and customer behavior.
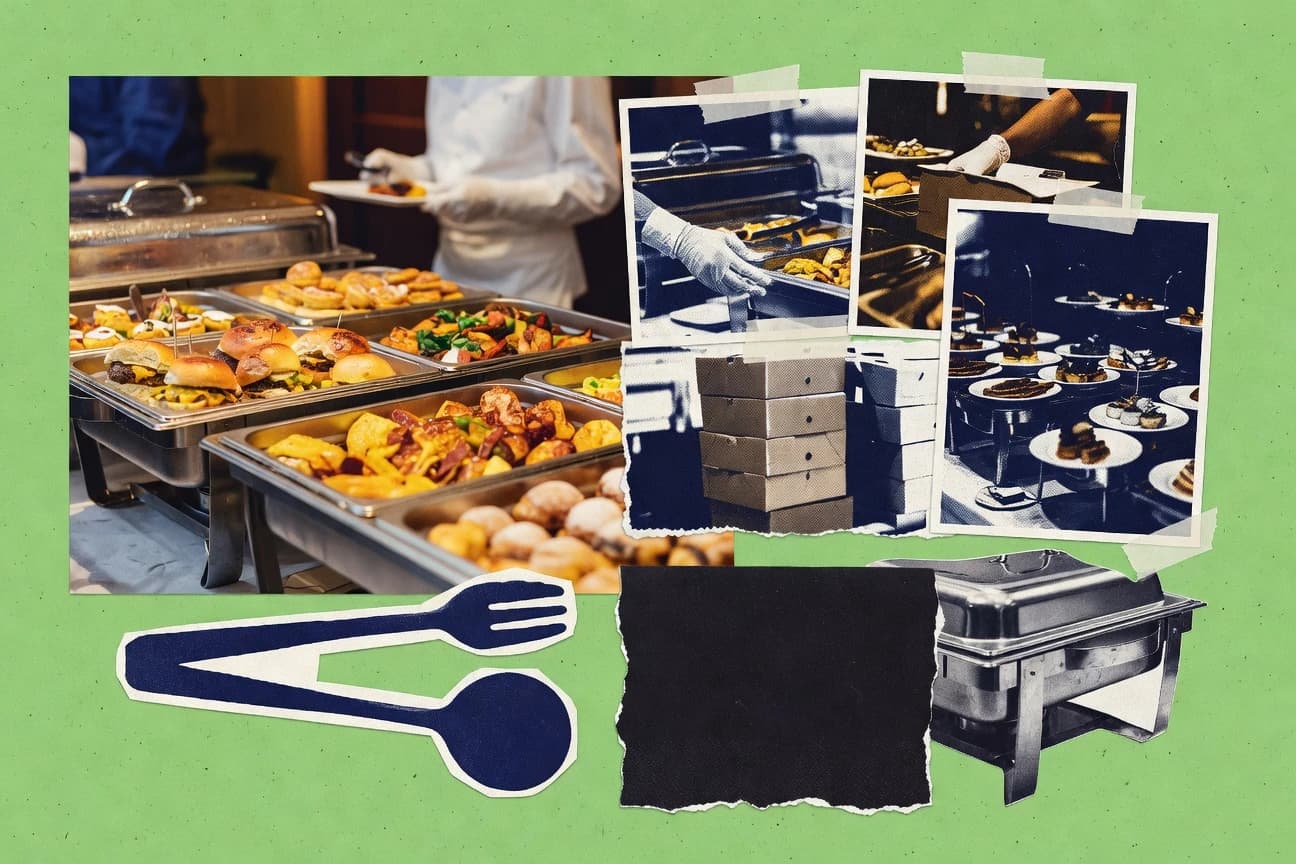
Catering Industry Statistics
US catering customers are still placing catering orders at scale, with 82% ordering for events in the past year, while spending shifts fast toward hybrid needs that lift budgets by 55%. Track how sustainability, allergen free menus, digital ordering, and labor realities intersect across global markets where the sector is growing at a 7.8% CAGR through 2030 and profitability sits in the 8 to 12% range.
Food Service Industry Statistics
From rising food and labor pressure to cybersecurity and energy shocks, the 2025 signals are loud, with 50% of US operators expecting recession impact and regulatory costs averaging $50k per small restaurant each year. See how consumer behavior keeps shifting toward loyalty, mobile ordering, and sustainable menus even as margins get squeezed by delivery fees, waste, and supply chain disruption.
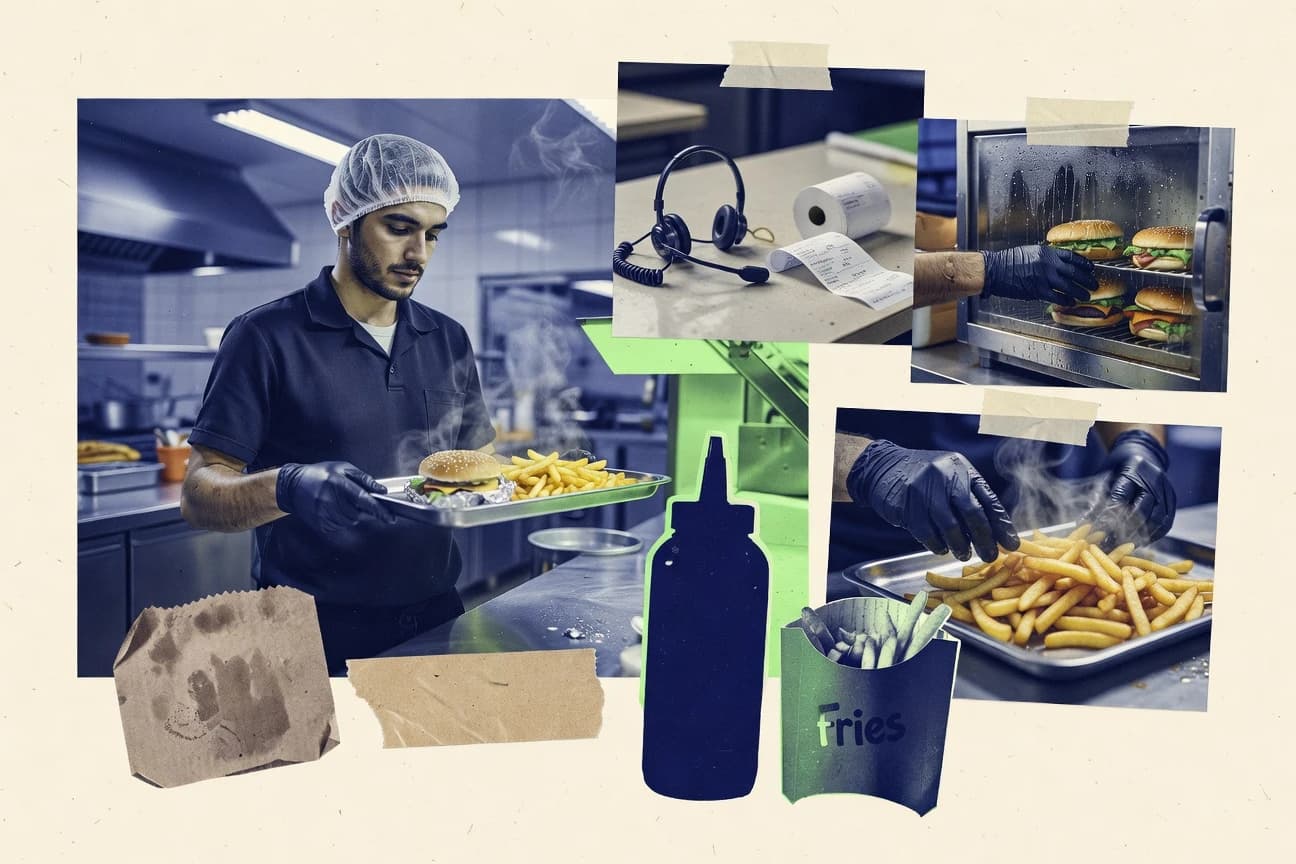
Fast Food Employee Statistics
With about 3.48 million fast food and counter workers in the United States as of 2023, this page breaks down who these workers are and why the job can feel so unstable, from 1.2 times higher workplace violence risk to paid sick leave that just 21% effectively have access to and an average commute of 18 minutes. You will also see how pay and safety vary by state and schedule, including median wages as low as $10.89 in Mississippi and the reality that shift injuries and customer harassment remain alarmingly common.
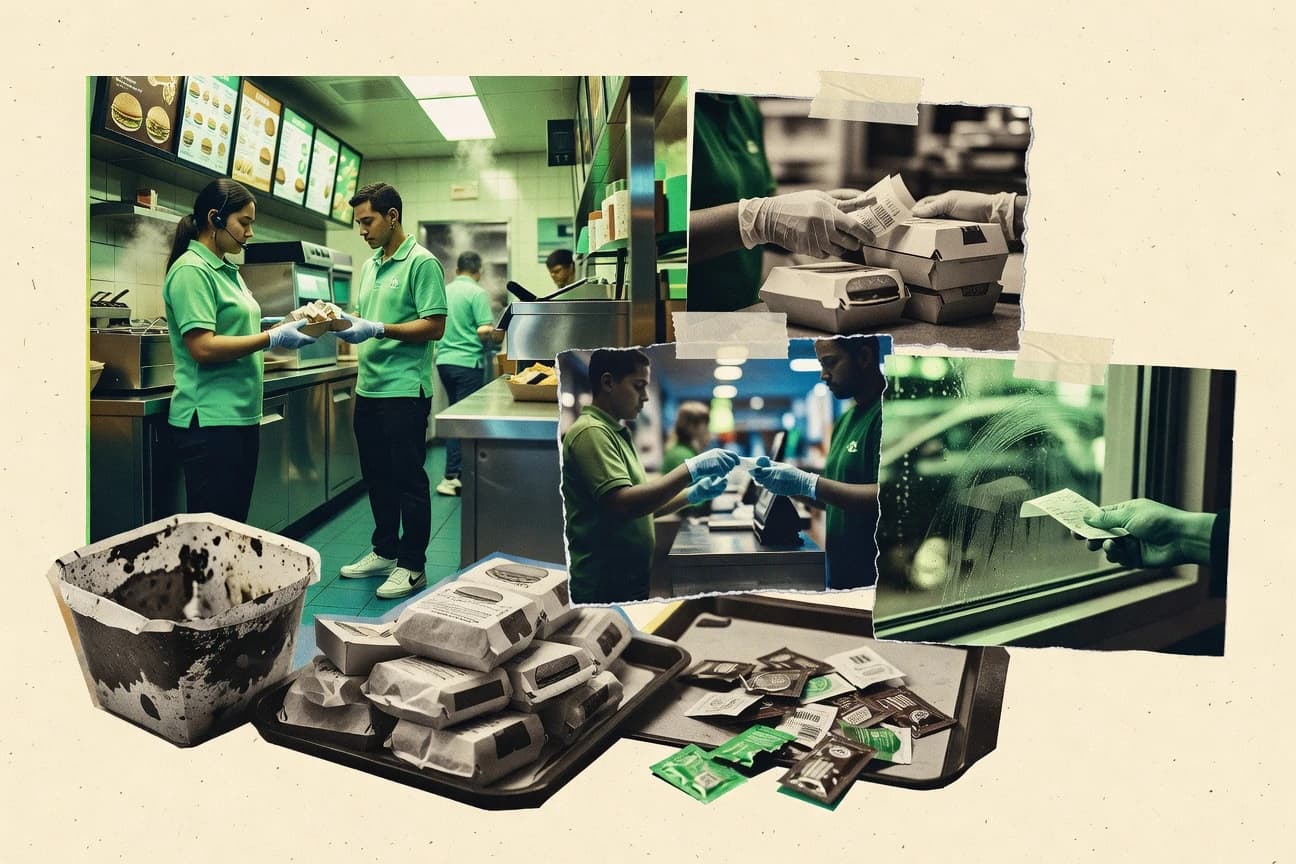
Fast Food Workers Statistics
Fast food work is a revolving door, with annual turnover hitting 150% in 2023 and wages that still leave most workers juggling long, irregular hours. This page maps who fast food employs, how often they are quitting and why, from 68% under 30 and 71% of cashiers being female to the health and stress strain behind the service windows.

Bar Industry Statistics
Nonalcoholic orders have surged 300% since 2018, even as bars still pull their biggest crowds from 8 to 11 PM and 70% of patrons come for live, themed experiences. This page connects what guests want right now, from mobile reservations and social reviews to labor shortages and rising costs, so you can see exactly where bar profits are getting won or squeezed.

Food Delivery Industry Statistics
Weekly delivery has become routine, with 42% of U.S. consumers ordering food delivery each week and average order value rising 15% to $35, even as 45% abandon carts over high fees. The page tracks what drives repeat behavior and how platforms are scaling delivery speed with GPS tracking now in 90% of orders, plus why convenience tips, contactless handoffs, and demographic shifts are reshaping every peak 6 to 9 PM.
Number Of Employees In The Canadian Restaurants Statistics
Youth aged 15 to 24 make up 41% of Canada’s restaurant workforce, even as women hold 53% of food services jobs and women also account for 25% of supervisors and managers. With turnover still around 75% and average tenure just 2.4 years, the page lays out who is staffing Canada’s $100 billion restaurant business and how rapidly that talent churns from first job seekers to seasoned kitchen and dining roles.

Restaurant Social Media Statistics
If 75% of restaurants post food photos yet video delivers 80% better performance, you cannot afford to guess what wins customer attention. This page stacks the latest Restaurant Social Media benchmarks from UGC trust lift of 92% to influencer reach 3x higher and social ads hitting a 4:1 ROI, so you can plan menus, captions, and campaigns that turn saves into reservations.

Starbucks Statistics
With 37% of the U.S. coffee shop market and 62 million weekly global customers, Starbucks is still expanding its reach at a pace that shows up in the loyalty details too, including 40% Rewards growth since 2020 and 32.6 million active U.S. members in 2023. The page also tracks how digital behavior, premium coffee momentum, and sustainability efforts add up across finances, stores, and partners, from 25% of U.S. sales driven by Gen Z to 75% of U.S. customers influenced by sustainability.

Romania Restaurant Industry Statistics
Romania’s restaurant market is now worth about 7.2 billion EUR, up 12 percent year over year, but the real shock is how spending habits have split, with online ordering taking 35 percent of transactions while weekend diners drop 120 RON per person versus 65 RON on weekdays. From loyalty app savings and plant based menu growth to labor shortages and rising energy costs, this page connects what drives visits to what squeezes margins.
F&B Restaurant Industry Statistics
Even with staffing pressure and thin restaurant margins, U.S. diners are widening the playbook in 2024 with health-focused habits, mobile booking reliance, and a clear swing to faster, plant-forward, and digital-first experiences. This page pulls together 65 percent more frequent dining out in 2024, 71 percent using mobile reservations post-pandemic, delivery at 18 percent of urban orders, and the labor realities behind the scenes so operators can spot what is actually driving sales and what is quietly squeezing profitability.

Poland Restaurant Industry Statistics
Poland’s restaurant market is bigger than ever, with a total value of about 45.2 billion PLN and weekly dining at 52% among people aged 18 to 34, while delivery alone drives 35% of urban sales. The page connects what people crave and how they pay, from 78% ordering via apps and 82% swayed by online reviews to a sharp split where price beats quality for 67% and casual dining wins 41%.

Restaurant Statistics
Loyalty apps now touch 51% of U.S. restaurant guests, yet 49% still avoid places with poor online reviews, so satisfaction and reputation are tightening together faster than ever. From online ordering at 62% and contactless preference at 82% to TikTok and Instagram driving 35% and 63% of new visits, these are the 2023 signals shaping everything from menus and labor to sales and margins.
Sports Bar Industry Statistics
Sports bars are making a sharp pivot from game day viewing to betting ready, since 34% now compete directly with casinos for sports betting integration, while revenue is projected to climb to $38B by 2028 and 45% of bars add legal sports betting kiosks by 2027. You also get the business pressure points behind monthly regulars, HD TV expectations, and fast changing winners and losers like Hooters, Buffalo Wild Wings, and regional upstarts.

Foodservice Equipment Industry Statistics
Cooking and refrigeration tell the biggest story, with cooking equipment holding a 35% global share and U.S. refrigeration sales rising 7% YoY to 28% of total equipment sales in 2023, while warewashing and display cases reshape European and retail buying patterns. Use this page to benchmark what is actually moving right now across regions and categories, from deep fat fryers driving 25% of quick service cooking sales to sustainability and automation pressures lifting energy star equipment sales by 28% globally in 2023.
Portugal Restaurant Industry Statistics
Portugal’s restaurant scene is busy and rapidly digitizing, with 68% of consumers dining out at least weekly and online reservations reaching 40% of bookings in 2023, while loyalty apps lift repeat visits by 28%. Yet the spending glow comes with pressure points, from €1,120 average monthly wages that sit 18% below the national average to tourism driving customers who spend 2.5 times more than locals, reshaping menus, staffing, and demand for sustainable and health-forward choices.

Japan Catering Industry Statistics
Japan’s catering scene is being reshaped by delivery convenience, health and sustainability choices, and a workforce under pressure, with revenue reaching 27.8 trillion yen in 2023 and customer habits swinging toward online reviews and contactless payments. From 62% of 20 to 39 year olds dining out at least twice weekly to plant based items in 29% of chain menus and solo dining taking 42% of Tokyo visits, this page shows exactly where demand is accelerating and what it means for operators.

Singapore Restaurant Industry Statistics
As Singapore’s restaurant world embraces tech and lifestyle shifts, delivery is projected to reach 35% of total revenue by 2025 while plant based orders have already surged 3x since 2020 and readers of online reviews account for 67% of restaurant choices. Staff constraints and costs are just as real as demand, with a 28% average annual turnover rate, staffing shortages reported by 72% of restaurants in peak seasons, and loyalty programs swaying 64% of repeat visits.