Market data
Food & Nutrition
Explore food & nutrition statistics and market research reports with sourced data and trend analysis.
Latest update:
 Yumi Nakamura


Statistics · 2026
Alcoholic Beverage Industry

Statistics · 2026
AI In Food Industry
See how AI is reshaping food industry decisions with numbers that move in 2025, and notice the gap between what companies expect and what’s actually happening. If you care about where automation delivers real gains versus where it stalls, these statistics make the contrast hard to ignore.

Statistics · 2026
Winery Industry
Statistics · 2026
Meat Packing Industry

Statistics · 2026
Meat Packaging Industry

Statistics · 2026
Food And Bev Industry
Statistics · 2026
Coffee Processing Industry
Statistics · 2026
Food Processing Industry
Food Processing Industry’s latest stats show a clear shift in how production, inputs, and costs are moving, with 2025 figures setting a more urgent baseline than the prior year. Get the numbers that explain what changed and why it matters for processors trying to stay competitive as margins tighten and supply pressures evolve.

Statistics · 2026
F B Industry
45% of U.S. consumers increased functional beverage purchases in the past year for health benefits—see what’s driving F&B demand.
Statistics · 2026
Healthy Food Industry Statistics
Plant-based momentum is real: the global plant-based food market is forecast to grow at a 6.3% CAGR (2023–2032)—discover what’s driving demand.
Statistics · 2026
Bubble Tea Consumption Statistics
Millennials account for 35% of US bubble tea spending in 2023—explore the numbers behind who spends, where, and which flavors win.
Statistics · 2026
Raw Milk Illness Statistics
Raw milk can be about 5× riskier than pasteurized milk for Listeria illness—Listeria was detected in 5.2% of raw milk samples.
Statistics · 2026
Food Ingredients Industry Statistics
Clean-label wins: 61% of global consumers prefer it—up from 52% in 2021. Explore how food ingredients meet rising expectations.
Statistics · 2026
Food Statistics
Food systems were worth US$6.1 trillion in 2019—yet 735 million people still face hunger. Explore the numbers behind jobs, markets, and impact.

Statistics · 2026
Global Meat Consumption Statistics
Global meat consumption reached 229.8M tonnes in 2022 and grew 3.15x since 1990. Explore which meats are rising fastest and why.

Statistics · 2026
Thailand Sugar Industry Statistics
Sugar imports are just 0.3 million tonnes in 2022—how can such a small inflow support demand and fuel targets? Explore the link.
Statistics · 2026
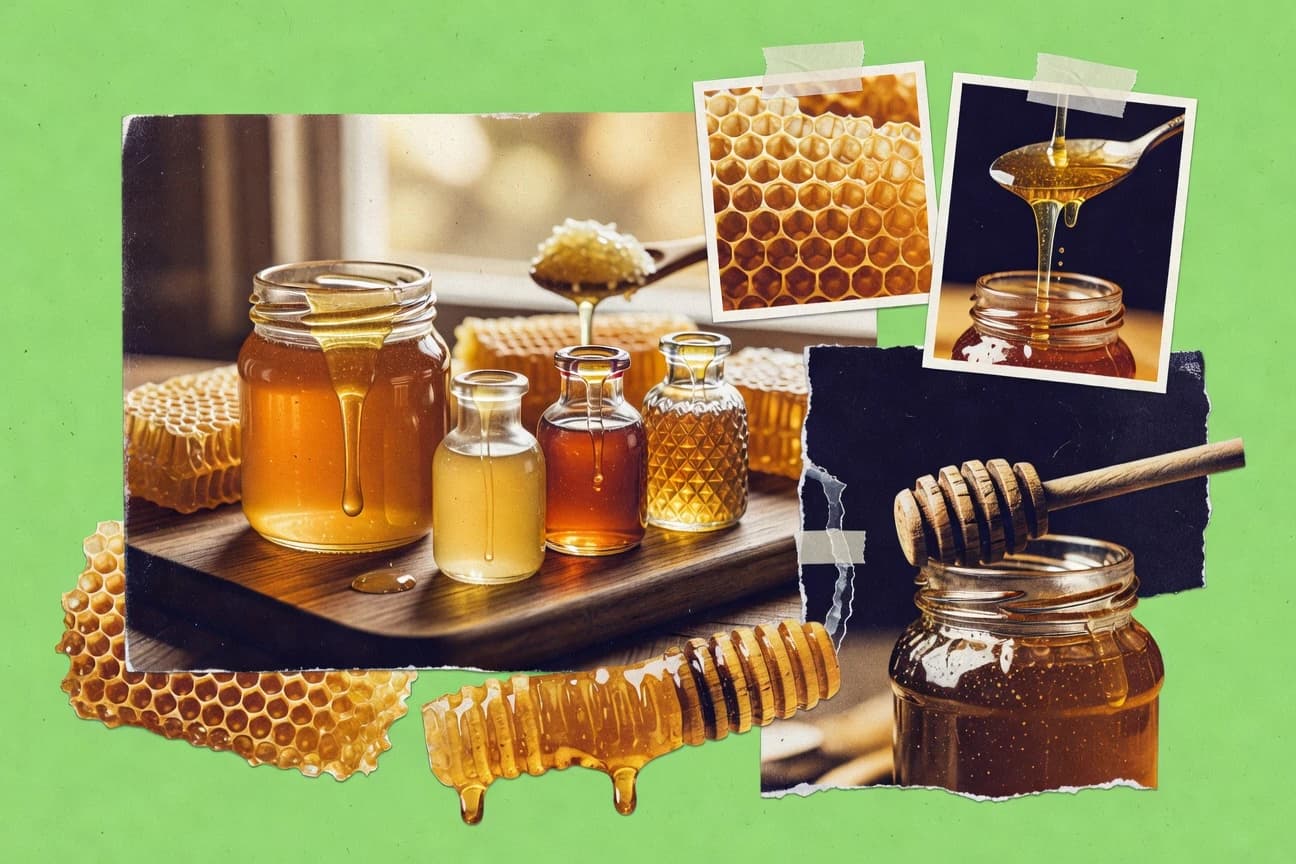
Most Expensive Honeys Statistics
Elvish honey can fetch ~€5,000 per kilogram—but only 2,000kg are harvested each year from the Saricayir cave. See what drives the cost.
Statistics · 2026
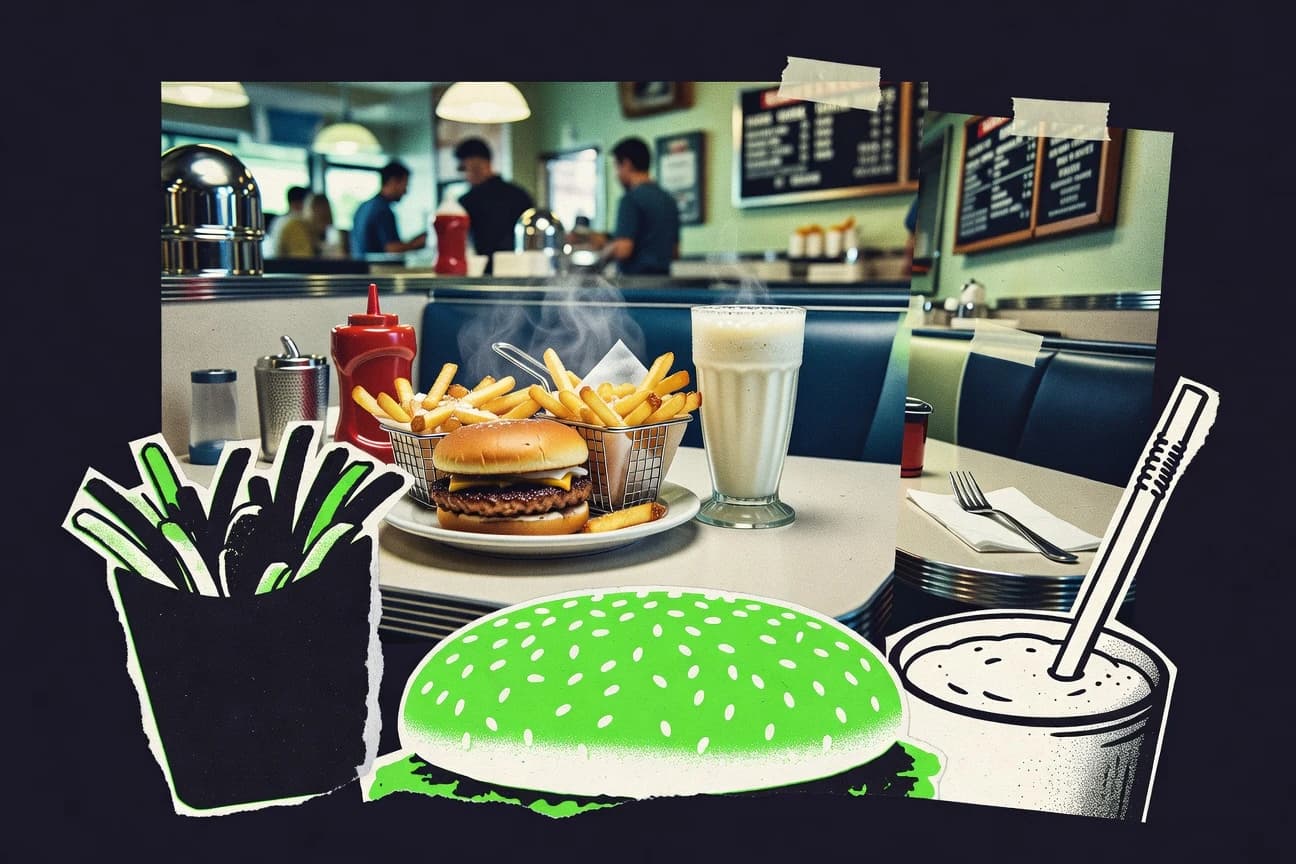
Americans Eat Out Statistics
Gen Z orders delivery weekly (73%), and the takeaway trend is redefining where Americans spend. Explore age-based dining behavior and spending shifts.
Statistics · 2026
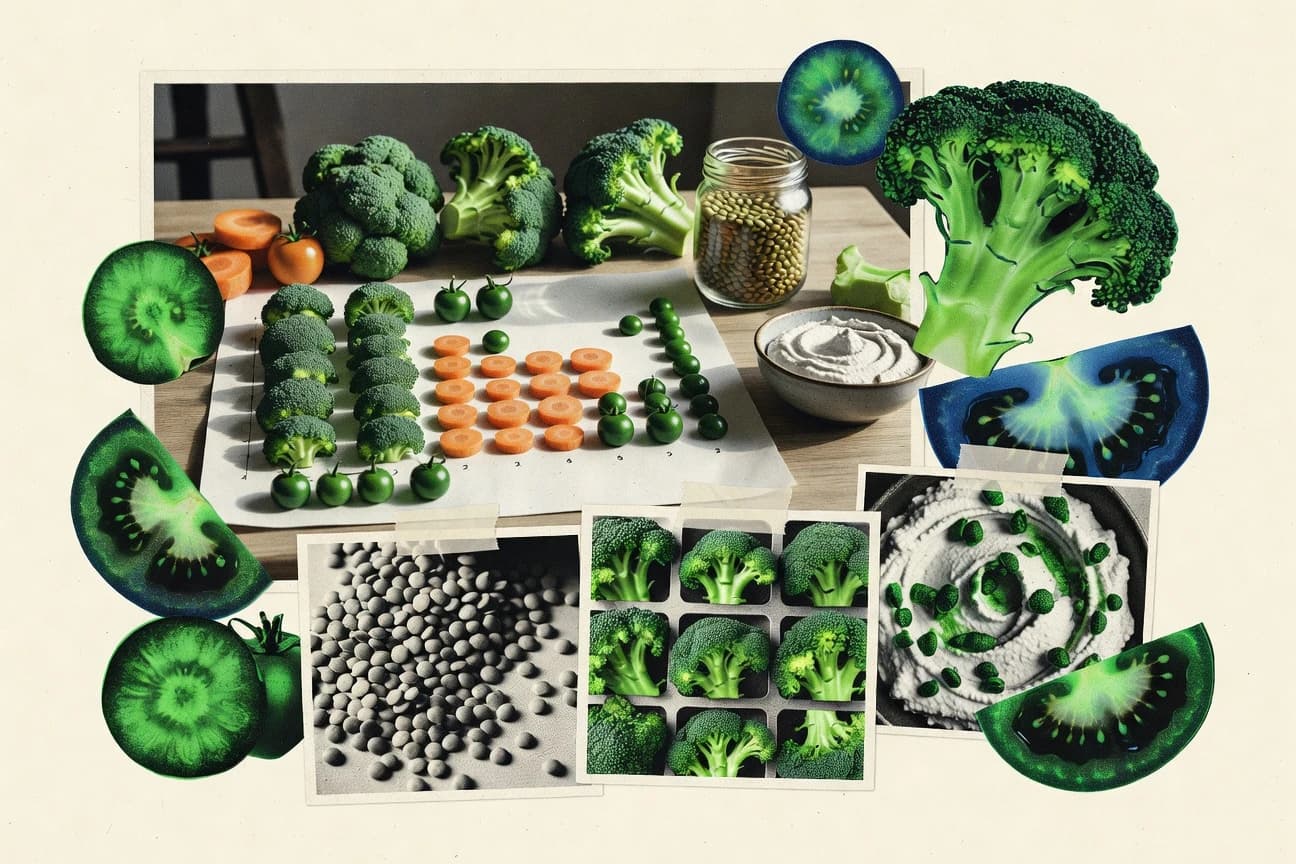
Vegetarian Statistics
Beef needs up to 15,000 liters of water per kg—switching to vegetarian proteins can mean far less. Explore the regional stats.
Statistics · 2026
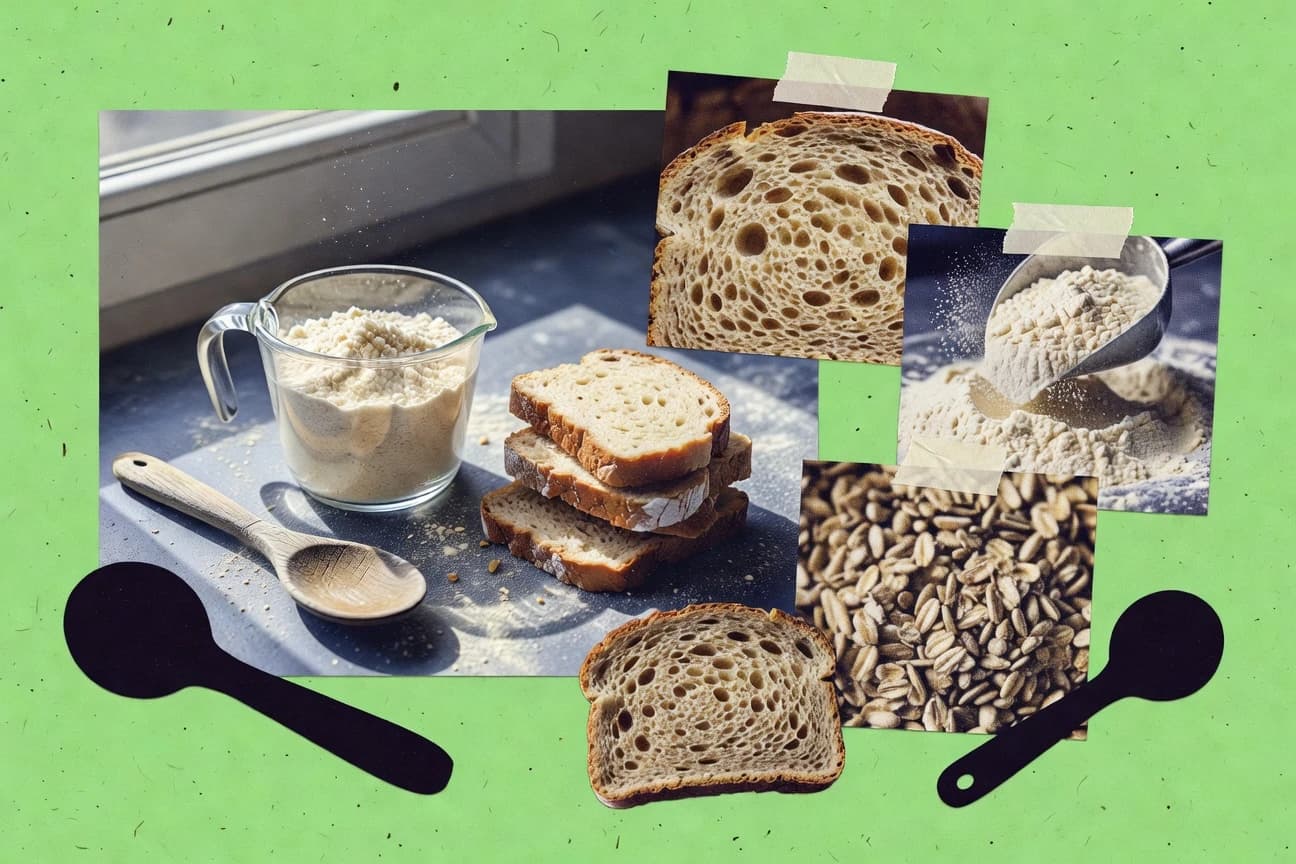
Gluten Free Statistics
65% of US adults 18–34 think gluten causes weight gain—but only 1% have celiac disease. Explore the gluten-free reality behind the numbers.