Market data
Food & Nutrition
Explore food & nutrition statistics and market research reports with sourced data and trend analysis.
Latest update:
 Yumi Nakamura


Statistics · 2026
Uk Snack Food Industry Statistics
UK snack buyers are shaping everything from healthier choices to sustainable packs, with 58% willing to pay more and 66% reading nutrition labels, yet crisps still dominate at 78% preference and top sales are driven by evening TV snacking. This page also keeps an eye on where the industry is heading, including a UK savory snacks revenue forecast of £5.2 billion by 2028 and a 6.5% annual growth projection for healthy snacks to 2028.

Statistics · 2026
Food Consumption Statistics
Food Consumption stats bring hunger and climate costs into the same frame, with 30% of countries flagged by FAO as having elevated severity in 2022 and food systems responsible for about 8.9% of anthropogenic greenhouse gas emissions. You can compare what people eat and what it costs, from 54.3% of US calories from ultra processed foods to $4,069 average annual US household spend on food at home.
Statistics · 2026
Peanut Butter Statistics
With U.S. peanut butter prices up about 5% year over year in 2022 and EU trade still moving at a large scale, this page pairs market signals with the safety rules that shape what can make it into your jar. You will see how aflatoxin limits at 8 μg/kg for AFB1 and 15 μg/kg total aflatoxins, allergen labeling requirements, and nutrition evidence from major trials and meta analyses connect the science of peanuts to real world purchasing, production, and health outcomes.
Statistics · 2026
Sports Nutrition Supplement Industry Statistics
With the global sports nutrition market forecast to hit $90.3B by 2032 and Asia Pacific already valued at $10.7B in 2024, this page connects the growth push to the science behind everyday essentials like creatine, caffeine, and protein plus the regulatory realities that shape what actually reaches athletes. Expect sharp contrasts such as energy gels climbing in the US and 27% of purchasers choosing third party verified products, alongside what the evidence supports and what compliance and enforcement are quietly changing for label claims.

Statistics · 2026
Vegan Statistics
From 99% of US farm animals kept in factory farms to 70 billion land animals slaughtered worldwide each year, these vegan statistics lay out the cruelty gap in stark figures. They also pair it with fast health and planet wins, including vegan diets cutting food related greenhouse gases by 75% compared with an average UK diet, so you can see exactly what changes when your plate stops funding factory farming.

Statistics · 2026
Chocolate Statistics
A cocoa import duty baseline of just 2.0% for cocoa preparations and chocolate in one widely used EU customs framework meets 7.6 million metric tons of EU cocoa imports tied to HS 1801 and related codes, so your bar’s price is shaped by both policy and supply risk. The page then stacks life cycle and health evidence together, from cocoa cultivation driving most greenhouse gas emissions and climate related yield threats up to 30% by 2050, to flavanol and methylxanthine measured effects on blood pressure and endothelial function, plus the regulatory reality of lead and ochratoxin A limits that manufacturers must meet.
Statistics · 2026
Fast Food Statistics
U.S. fast food sales grew 2.6% year over year in 2023, but the margins, costs, and channel shifts tell the sharper story. From 7.0% average operating margins to mounting labor and packaging pressure plus the surge in delivery and drive thru preferences, these 2023 and early 2024 consumer and market signals explain what’s changing at QSR checkouts and kitchens now.
Statistics · 2026
Grilling Industry Statistics
With 91 million U.S. households owning a grill or smoker and smart connected models pulling in Gen Z, the industry is shifting fast in 2023, not just toward new gadgets but toward new habits, from chicken dominance to 84 million weekly grillers. This page tracks the market and the reasons behind it, including gas’s 52% unit-share, smart grills up 28% year over year to 1.2 million units, and safety details like grease buildup driving 21% of grill fires.
Statistics · 2026
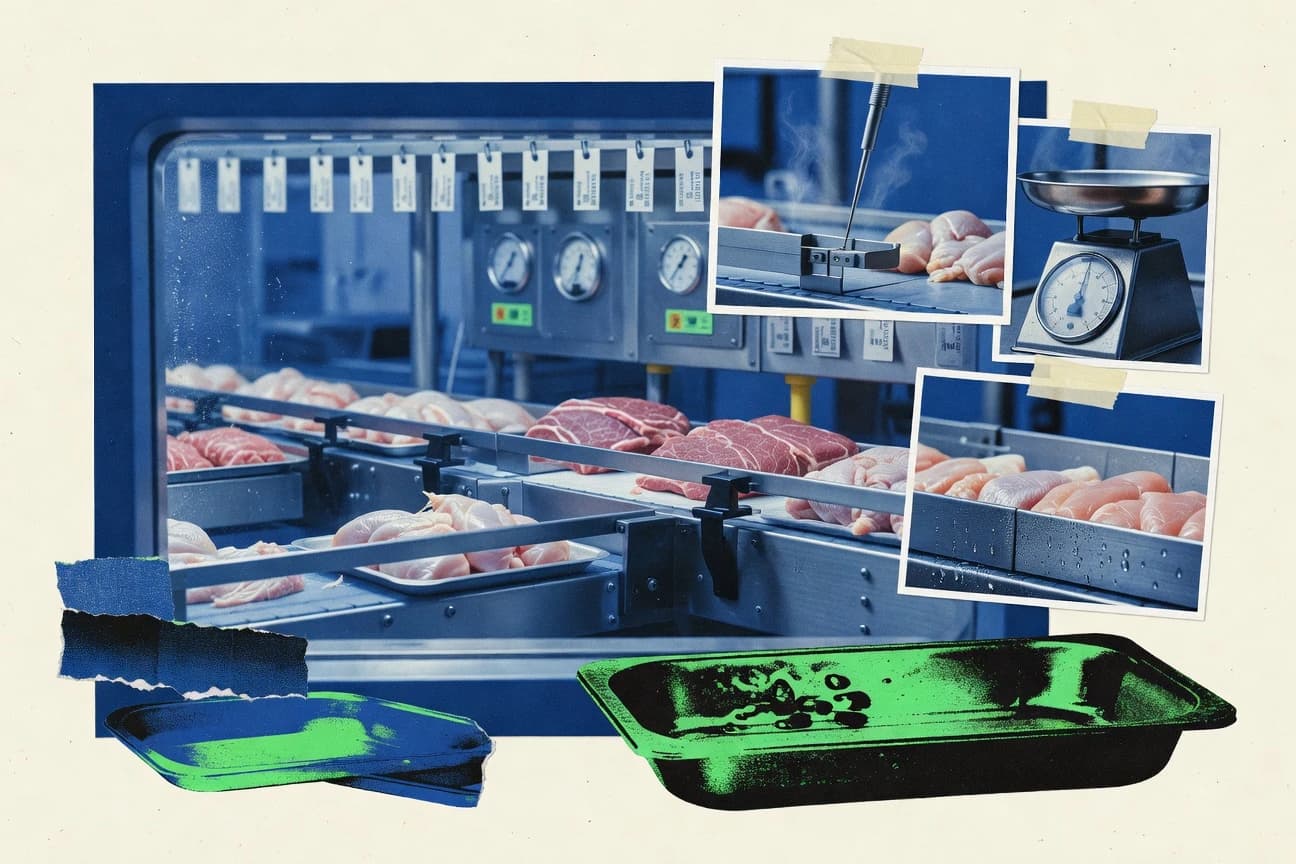
Meat Poultry Industry Statistics
US turkey demand is slipping, with per capita consumption easing to 14.5 pounds in 2023, while chicken stays firmly on a higher track at 98.9 pounds per person in 2022 and global poultry consumption is projected to keep rising toward 15.6 kg by 2030. This page connects what drives those shifts with market size, production volumes, trade flows, and the jobs and emissions behind the protein on shelves.

Statistics · 2026
Pineapple On Pizza Statistics
While 80% of Swedes accept pineapple on pizza as a cultural mainstay, 59% of people worldwide still hate it, turning a simple topping into a global argument. This page maps how Hawaiian pizza went from Sam Panopoulos’s 1962 canned pineapple experiment to today’s market impact, with country by country shares and the loudest pro and anti camps.

Statistics · 2026
Espresso Coffee Industry Statistics
Finland leads global per capita espresso consumption with 4.5 kg a year while U.S. demand jumped 10% to 50 billion espresso based drinks in 2023, turning the market into a telltale competition between cafés and at home routines. From 65% of Europeans choosing espresso over drip to smart espresso makers shipping 12 million units and carbon neutral initiatives drawing $500 million, this page tracks the forces behind how people drink espresso and why they switch.

Statistics · 2026
Philippines Coffee Industry Statistics
Retail instant still takes 65% of market share, yet ready to drink coffee has surged to 20 million liters and coffee shop outlets now reach 5,000 nationwide in 2023. Follow how 1.8 kg per capita consumption and a 40% jump in e commerce spending sit alongside Robusta dominance and smallholder realities, including 1.5 million farmers directly employed by the sector.

Statistics · 2026
Coffee Statistics
Finland sets the pace at 12.54 kg of coffee per person yearly while the US sits at 4.2 kg, and the gap becomes even sharper when you see Europe at 52.5 million 60 kg bags versus instant coffee taking 25% of global consumption. Follow the trail from coffee shop life, with over 30,000 Starbucks stores serving 4 billion customers yearly, to global supply and prices, including 10.5 million tons traded in 2022 and an ICO composite price averaging 160.95 US cents per lb.

Statistics · 2026
Olive Oil Industry Statistics
Olive oil is expanding fast at a 3.5% global CAGR through 2032, yet drought and heat can cut yields by 20% to 50% when water runs scarce, reshaping everything from export volumes to price signals. This page puts fresh trade, pricing, regulation, and health research together, including Spain’s 2.0 million tonnes of 2022 exports and EU and US labeling rules that determine what counts as extra virgin.