Market data
Food & Nutrition
Explore food & nutrition statistics and market research reports with sourced data and trend analysis.
Latest update:
 Yumi Nakamura


Statistics · 2026
Philippines Coffee Industry Statistics
Retail instant still takes 65% of market share, yet ready to drink coffee has surged to 20 million liters and coffee shop outlets now reach 5,000 nationwide in 2023. Follow how 1.8 kg per capita consumption and a 40% jump in e commerce spending sit alongside Robusta dominance and smallholder realities, including 1.5 million farmers directly employed by the sector.

Statistics · 2026
Coffee Statistics
Finland sets the pace at 12.54 kg of coffee per person yearly while the US sits at 4.2 kg, and the gap becomes even sharper when you see Europe at 52.5 million 60 kg bags versus instant coffee taking 25% of global consumption. Follow the trail from coffee shop life, with over 30,000 Starbucks stores serving 4 billion customers yearly, to global supply and prices, including 10.5 million tons traded in 2022 and an ICO composite price averaging 160.95 US cents per lb.
Statistics · 2026
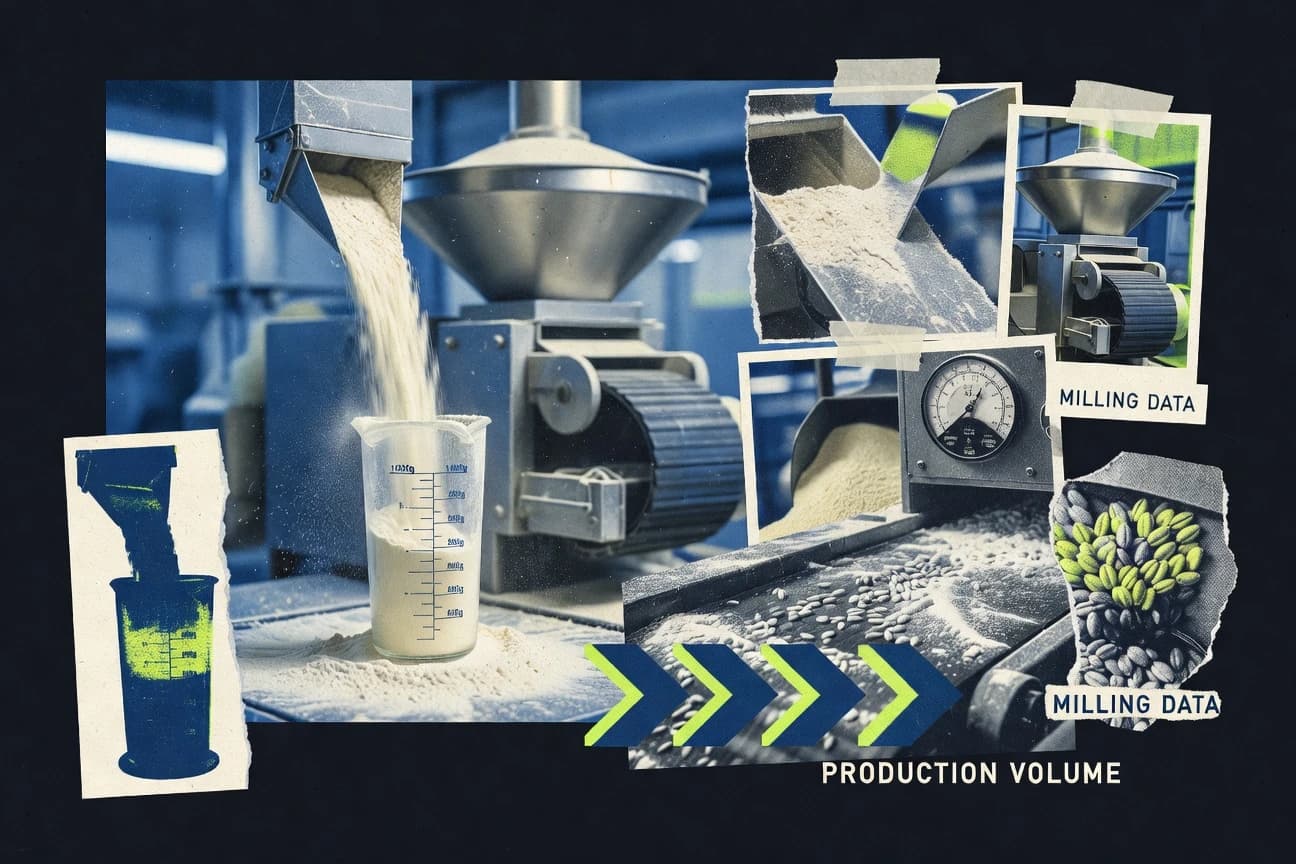
Flour Milling Industry Statistics
Automation is reshaping labor and output, with US flour milling employment falling to 16,500 workers in 2023 while EU mills still rely on an aging skilled workforce and rising energy costs squeeze margins. You will also see how global scale compares, from 2.5 million direct jobs worldwide and an export push that lifted market size to $200.5 billion in 2023, to region by region workplace risks, wages, emissions cuts, and capacity gains.

Statistics · 2026
Olive Oil Industry Statistics
Olive oil is expanding fast at a 3.5% global CAGR through 2032, yet drought and heat can cut yields by 20% to 50% when water runs scarce, reshaping everything from export volumes to price signals. This page puts fresh trade, pricing, regulation, and health research together, including Spain’s 2.0 million tonnes of 2022 exports and EU and US labeling rules that determine what counts as extra virgin.
Statistics · 2026
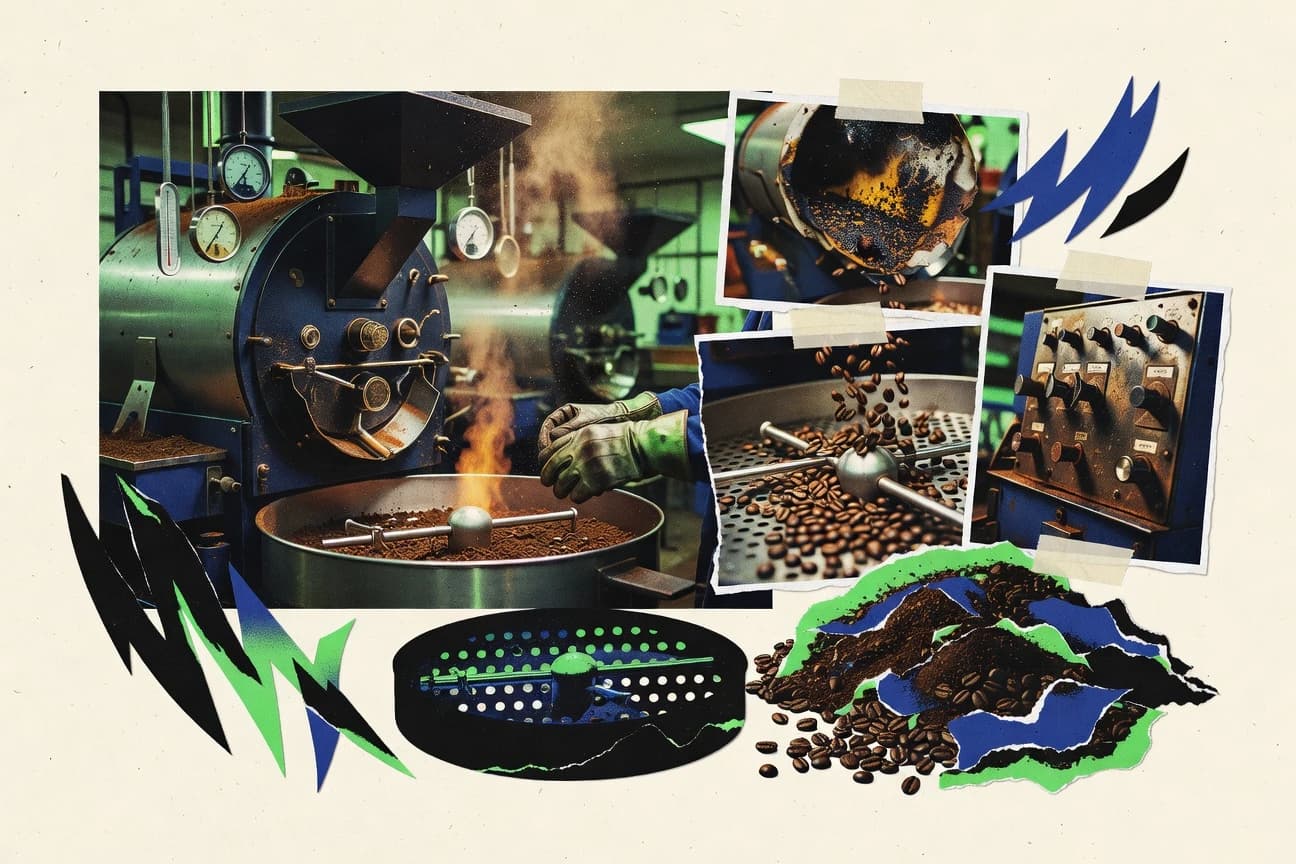
Roasting Industry Statistics
Coffee roasters are betting on precision equipment and control tech as the specialty coffee market reaches $5.8 billion in revenue in 2023 and most facilities still report variability challenges, from ±3°C temperature swings that shift roast degree by a full level to 5–10% of small batches missing sensory thresholds without standardized roast profiling. This page connects the latest operating spend and monitoring practices, like $6.0 million on machinery and equipment and 56% using data analytics for roasting quality, with real outcomes in energy control, particulate compliance, and process contaminant risk such as acrylamide and ochratoxin A.