GITNUX MARKETDATA
Browse Our Category
Food Nutrition
Latest update:

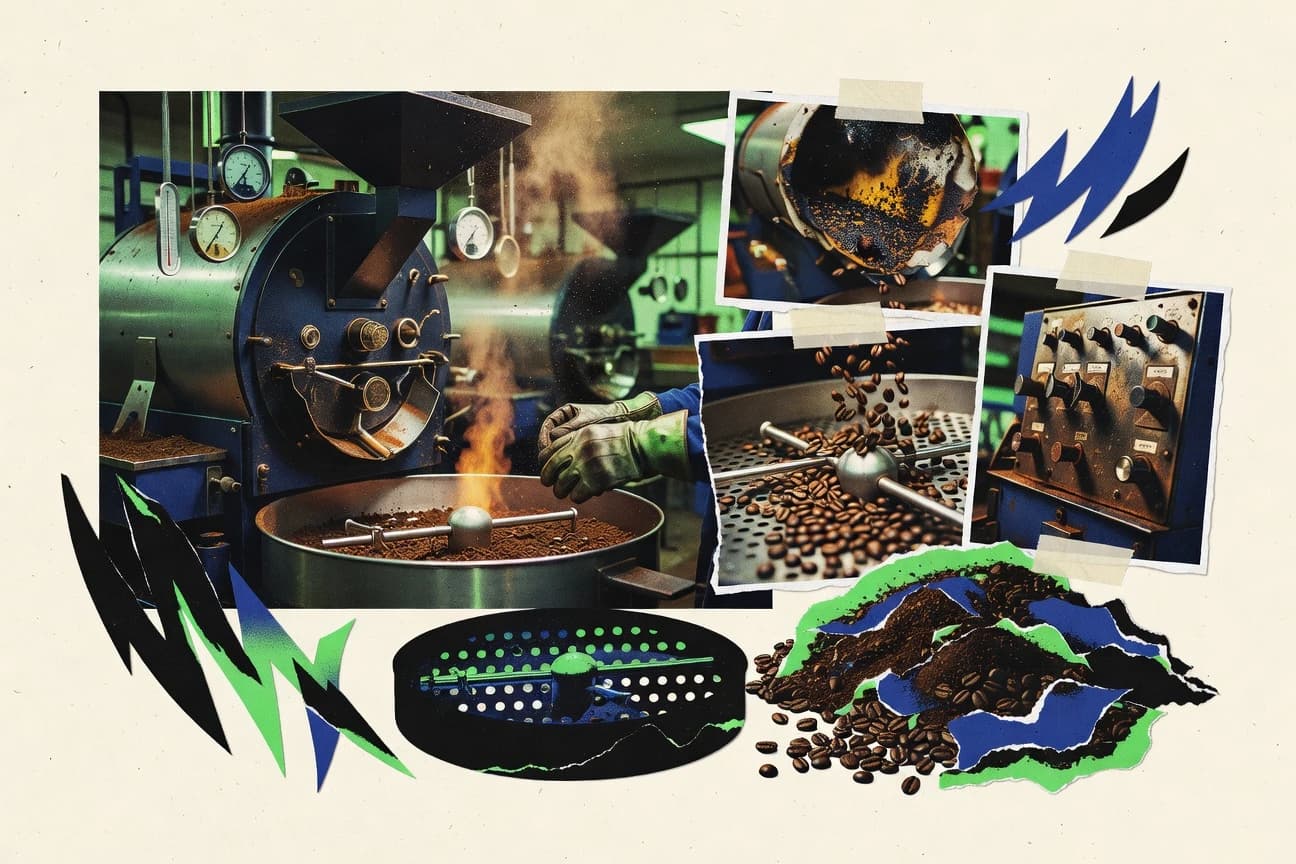
Roasting Industry Statistics
Coffee roasters are betting on precision equipment and control tech as the specialty coffee market reaches $5.8 billion in revenue in 2023 and most facilities still report variability challenges, from ±3°C temperature swings that shift roast degree by a full level to 5–10% of small batches missing sensory thresholds without standardized roast profiling. This page connects the latest operating spend and monitoring practices, like $6.0 million on machinery and equipment and 56% using data analytics for roasting quality, with real outcomes in energy control, particulate compliance, and process contaminant risk such as acrylamide and ochratoxin A.
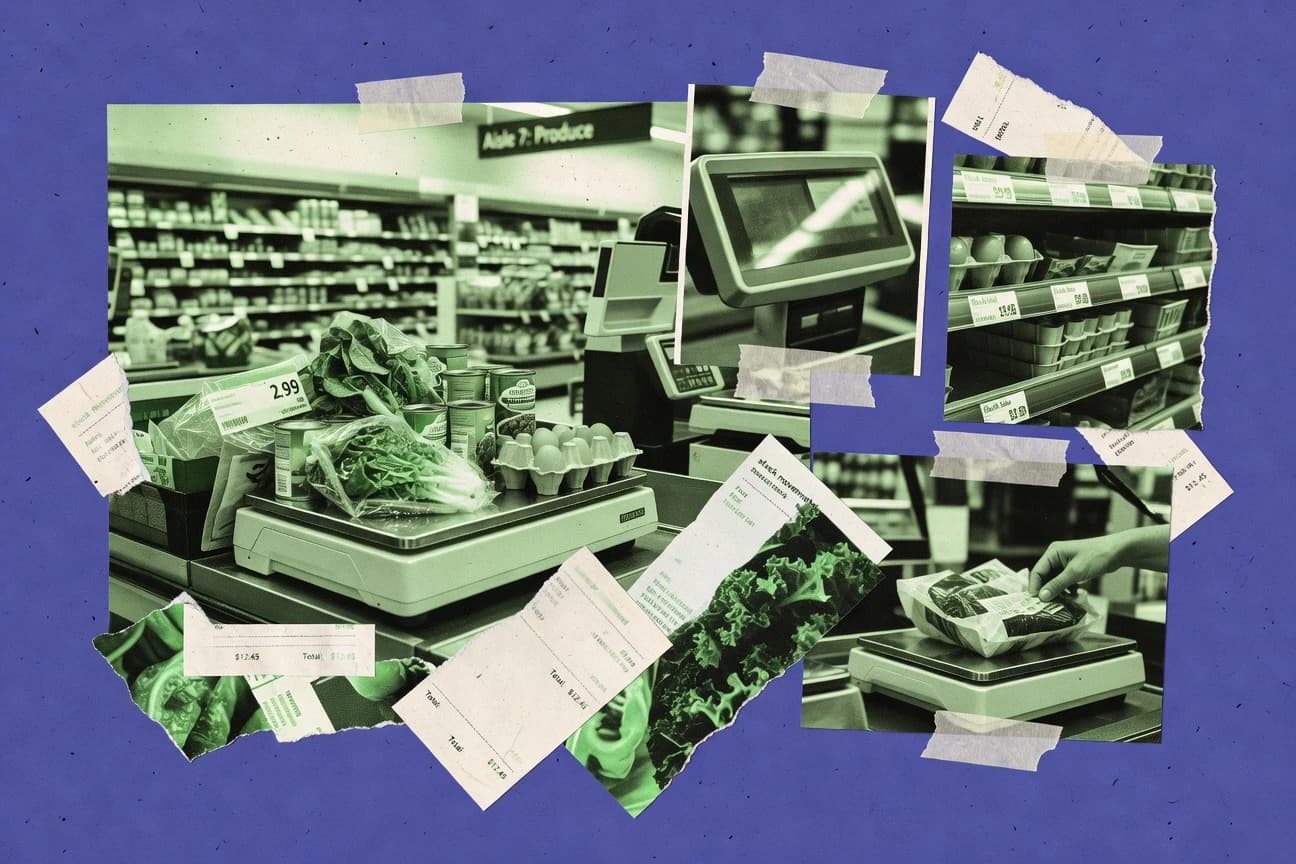
Food Retail Industry Statistics
U.S. grocery establishments numbered 58,694 in 2020, but shopper expectations and systems have surged, with 57% of consumers expecting same day delivery and 62% of retail data breaches tied to credentials and authentication attacks. See how inflation pressure, payment risk, and fulfillment accuracy are reshaping food retail performance from checkout to supply chain, including 96.2% grocery e commerce order accuracy and $1.6 billion in U.S. retail cybersecurity spend in 2023.
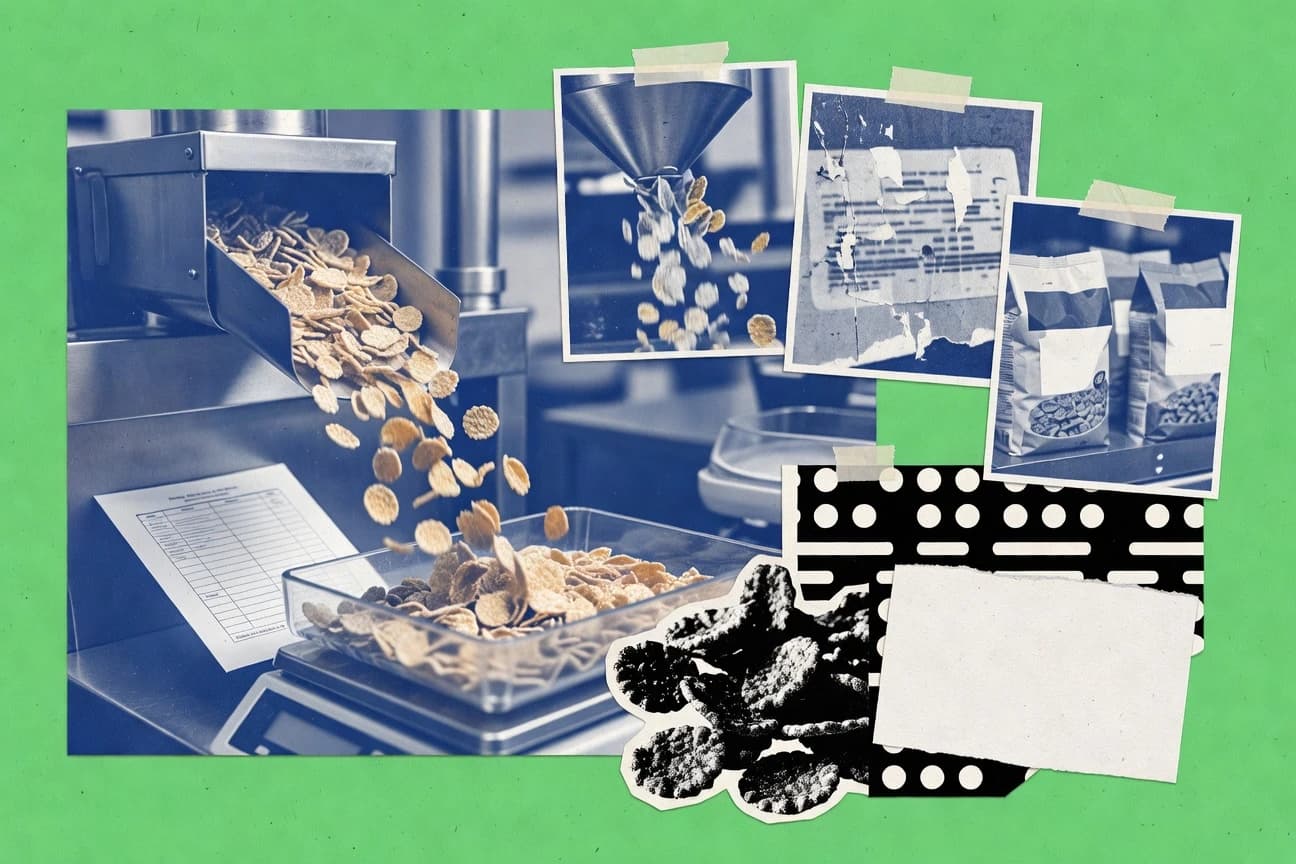
Cereal Industry Statistics
See how 2024 Q1 producer price signals for cereal breakfast foods (index 252.8) and flour milling costs (260.6) sit alongside shifting daily habits like 73% of U.S. adults eating breakfast at least 5 days a week, plus whole grain and fiber science that keeps pushing performance claims. From maize supply fundamentals to EU and U.S. labeling rules and packaging targets, this page links health demand, input pressures, and shopper behavior into one clear picture of what is reshaping cereal shelves now.
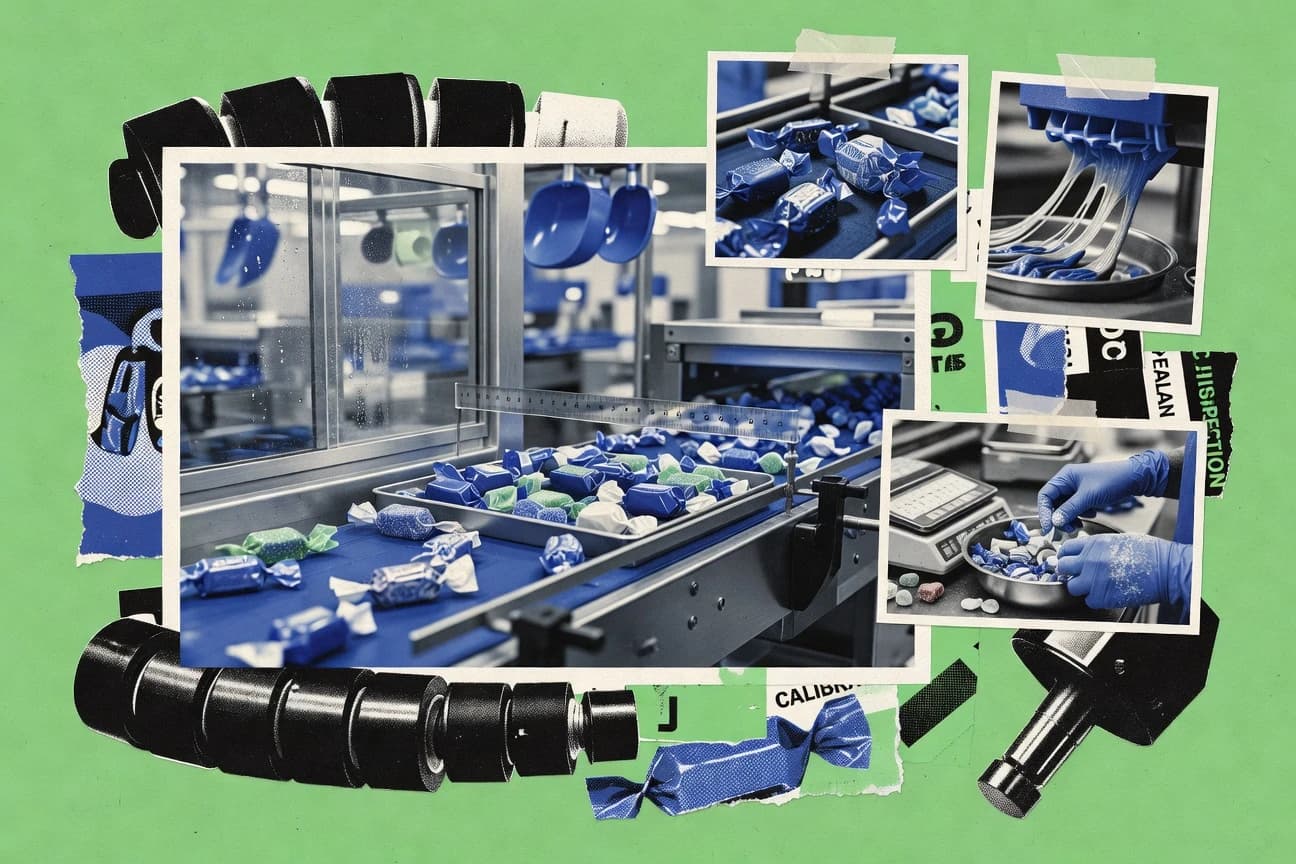
Candy Industry Statistics
Global chocolate candies reached $9.4 billion in 2023 and gummies are projected to hit $18.1 billion by 2032, while major segments like sugar confectionery, hard candy, and lollipops all track solid growth rates through 2032. Add the consumer shift toward natural ingredients in the U.S. and tightening nutrition and allergen rules in the EU alongside cocoa and sweetener cost pressures, and you get a sharp picture of what will shape candy demand and pricing next.

Thailand Food And Beverage Industry Statistics
Functional beverage sales climbed 18% to 45 billion THB, while carbonated drinks hit 7 billion liters and sugar-sweetened beverage tax raised 25 billion THB as volume fell 5%. Use these Thailand-specific production, export, packaging and consumer-shift figures to spot how health rules are reshaping everything from PET recycling at 52% to RTD tea leading exports of USD 1.1 billion.

Specialty Tea Manufacturing Industry Statistics
Specialty tea manufacturing is riding a widening market split, from a $3.1 billion global specialty tea market in 2023 forecast to $5.4 billion by 2030, while manufacturing pressures come from packaging cost inflation near 10% in the US and sharply higher EU industrial energy bills that directly hit drying and roasting. The page connects this demand pull to process and compliance realities, including catechin retention and aroma gains from controlled drying and particle size, plus EU residue and heavy metal limits under 396/2005 and 1881/2006 that shape what specialty blends can legally become.
Taiwan Beverage Industry Statistics
Taiwan consumers spent NT$ 3.2 billion on bottled water in 2023 while the household final consumption context reached NT$ 1.74 trillion in 2023, a useful contrast that shows why prices, label rules, and taste preferences can move fast in this market. See how 35% of shoppers favor sugar reduced or no sugar and how Taiwan FDA inspections still flagged 2.3% noncompliance with beverage labeling in 2022, alongside production scale from 3.12 billion liters of bottled water to 8.4 billion liters of carbonated soft drinks.

Childhood Nutrition Statistics
With global wasting still estimated at 6.9% in 2022 and only 44% of infants under 6 months exclusively breastfed in 2023, the page shows why progress can stall even when policies exist, like the 64% of countries with protections for breastmilk substitutes as of 2022. It also ties “hidden hunger” to survival, with undernutrition behind 45% of deaths under 5, while mapping what it would take to scale action from UNICEF’s 3.1 billion micronutrient powder sachets in 2022 to the estimated $49 billion a year global investment gap to reach 2030.
Frozen Potato Industry Statistics
Frozen potato products are projected to reach US$6.70 billion by 2032, even as stricter acrylamide rules and HACCP driven cold chain requirements push processors to rethink everything from raw material selection to freezer energy costs. From $36.7 billion global cold storage to major demand growth in Asia and steady EU consumption, these statistics explain why frozen potatoes are becoming both more regulated and more strategically valuable.
Food And Beverage Industry Statistics
Food and beverage is still growing steadily, with global real GDP in food services averaging 4.1% annually, yet U.S. consumers are paying more attention to price pressure as food-away-from-home inflation runs at 3.2% year over year and food at home carries an 0.8% CPI weight in 2024. Get the full picture from a $1.0 trillion global meat, poultry, and seafood processing market and $9.9 trillion in global retail food sales to where emissions, food loss, and packaging costs concentrate across the chain.

Singapore Food Industry Statistics
Singapore’s food scene is switching gears fast, with plant based consumption up 28% in 2023 and online ordering now 62% of urban orders, even as hawker centre regulars still account for 75% of daily meals and spend S$5 to S$8 each. From 8.5% productivity gains and 240,000 F and B workers to 817,000 tonnes of food waste and a 20% recycling rate, these statistics explain why health, sustainability, and delivery are reshaping demand from the chicken rice crowd to the zero waste programmes.

Uk Coffee Industry Statistics
With UK coffee spend tipped to hit £1.5 billion by 2027 and the instant segment still holding a massive 45% share at home, this page tracks what is actually driving demand, from decaf growth to the surge in iced coffee. You will see how consumption is shifting by generation and format, including pods reaching 4.2 billion uses in UK homes and coffee shop volumes topping 1.2 billion servings, alongside the sustainability signals shaping everything from plant based milk to net zero pledges.
Sustainability Food Industry Statistics
Plant based meat alternatives are climbing from $26.0 billion in 2024 to an expected $33.3 billion by 2028, while 12.6% of global food still goes to waste somewhere along the supply chain. This page connects the pressure points behind food sustainability and investment, from $143.0 billion in sustainable packaging and EU CSRD coverage to the climate and compliance costs that are steadily reshaping how food is produced, packaged, and tracked.
Germany Beverage Industry Statistics
Germany’s beverage market is shifting fast in the latest data, with non-alcoholic beverages claiming 52% of total revenue while beer production slips to 7.9 billion liters and per capita falls to 99.5 liters. Wine, spirits, and soft drinks sit right beside the sustainability numbers like 98% packaging recyclability and 65% renewable energy use, making this the page to understand what Germans are buying, drinking, and expecting next.
Supplements Industry Statistics
From supplement launches climbing to 8,940 U.S. product launches in 2023 to quality and labeling missteps still showing up in testing, this statistics page puts the industry under a microscope with regulatory pressure and safety signal data side by side. Expect one clear takeaway on what is working and what is not including costs of DS CGMP compliance estimated at $1.6 billion annually and evidence gaps where risk of bias and low quality health-claim support remain persistent.
Saudi Beverage Industry Statistics
Saudi Beverage Industry data has shifted fast enough that 2026 figures reshape expectations for volumes, pricing, and market momentum, not just a few product lines. Get the latest dashboard of what’s driving consumption and where growth is most likely to concentrate in Saudi Arabia, with the kind of contrasts that matter for real decisions.
Sugar Industry Statistics
With sugar demand and pricing moving faster than the industry’s traditional supply rhythms, the latest 2026 figures reveal a market that is tightening in unexpected ways and shifting bargaining power across growers, refiners, and buyers. Read these Sugar Industry statistics to see what’s changing now and which signals are already separating steady performers from those exposed to the next swing.

Pakistan Sugar Industry Statistics
See how Pakistan’s sugar economy is shifting with the latest 2025 production and export numbers, and what that means for mill output and earnings across the season. The page puts the biggest swings side by side so you can spot whether demand is keeping pace or squeezing margins.
Global Food And Beverage Industry Statistics
Global Food And Beverage Industry market muscle reaches $10.3 trillion in 2023, but the page pairs that scale with hard pressure points from hunger and wasted food to energy use, foodborne illness costs, and tighter traceability, so you see where growth meets risk. You also get fast signals on demand and disruption, from $44.3 billion in online delivery and a 11.4% online grocery growth forecast to $1.8 trillion in global food loss and waste, making it the quickest way to benchmark what matters now.
Spice Industry Statistics
See how spice industry numbers shifted in 2025, from supply pressure to pricing swings and demand patterns that don’t look like the last cycle. It is the fastest way to spot what changed and what stayed stubbornly the same before you plan purchases or pricing for what comes next.