GITNUX MARKETDATA
Browse Our Category
Food Nutrition
Latest update:


India Beverage Industry Statistics
India’s beverage market is set to reach ₹2,01,700 crore in 2026 even as the mix shifts toward modern formats and new consumer tastes rather than simple volume growth. This page connects those forward looking numbers to what is actually changing on the ground so you can separate hype from the trends shaping 2025 and beyond.

Caviar Industry Statistics
Premium caviar is still a niche in day to day life, yet it moves globally at speed, with US demand at just 0.05 kg per person while top cities like New York reach 0.2 kg and luxury buyers push fine dining to 50% of servings. Read why trade logistics, farm scale, and regulation collide, from 70% of global volume flying by air and global market value at $1.2 billion in 2023, to Russia rerouting shipments after sanctions and sustainability rules tightening around traceable aquaculture.

Foodborne Illness Statistics
Foodborne illness still sickens 1 in 6 people in the United States every year, and the costs are enormous, with $77.9 billion in total economic impact reported for 2011–2016. From restaurant related outbreaks and genome based outbreak tracking to how soap, sanitation, and safer food handling can cut risk, this page shows which interventions move the needle fastest.
Germany Food Industry Statistics
Germany Food Industry statistics reveal how 2025 food production and consumption trends are reshaping output, demand, and market pressure at the same time. The page tracks the shift that makes 2025 harder to ignore than the years before it.
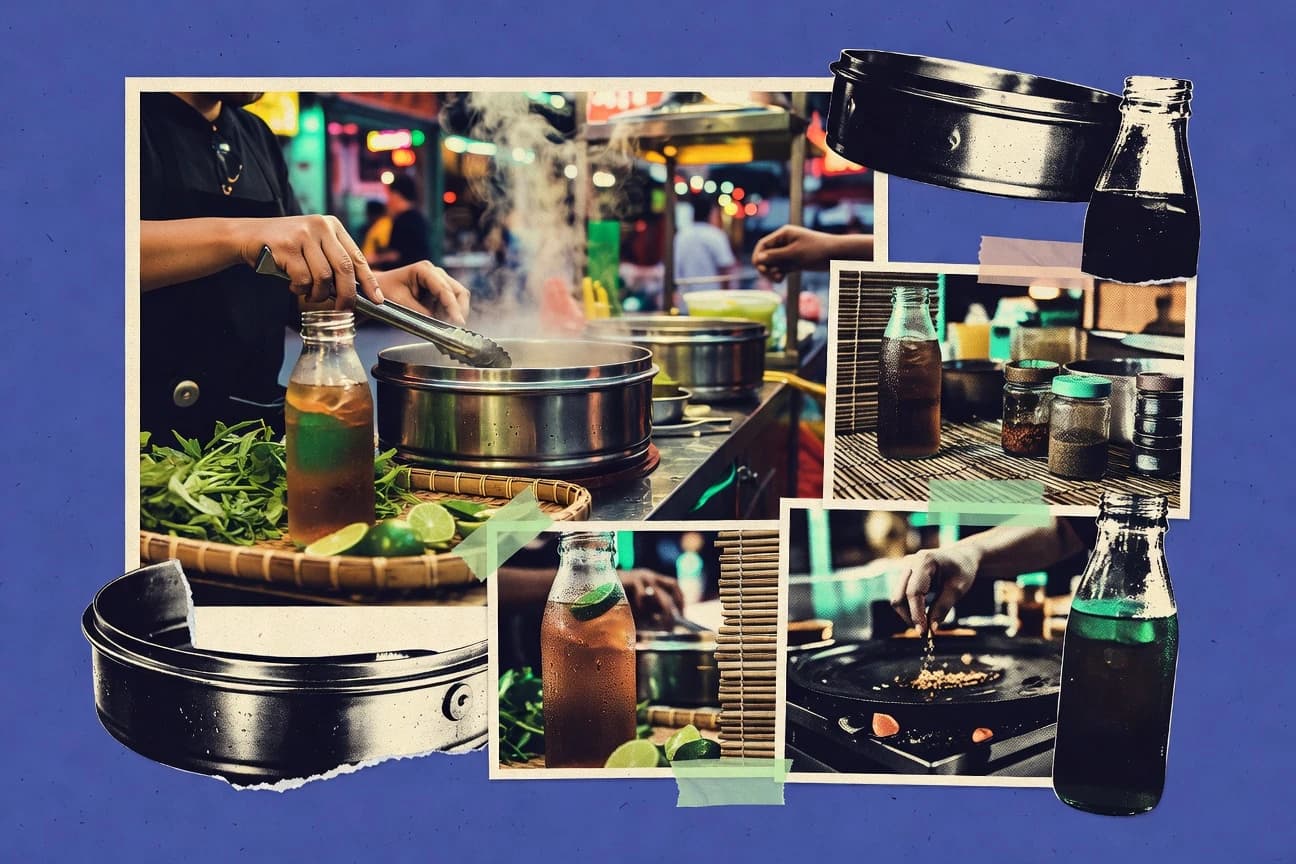
Vietnam Food And Beverage Industry Statistics
Vietnam’s functional beverage market hits $1.9 billion in 2023, while food retail inflation averages 6.4% in 2023 and VAT on most retail F and B stays at 10%, putting cost and health priorities into direct tension with drink and snack demand. The page tracks what consumers actually buy and how supply chains move, from $8.2 billion seafood exports and 1.1 million tons of coffee output to e commerce grocery set to grow at an 18.2% CAGR through 2030.
Uk Food And Drink Industry Statistics
UK food and drink industry numbers for 2025 reveal the squeeze and the shifts happening at the same time, with working patterns and spending moving in opposing directions. Read the page to see which parts of the supply chain are gaining, which are losing, and what those 2025 signals suggest for the year ahead.
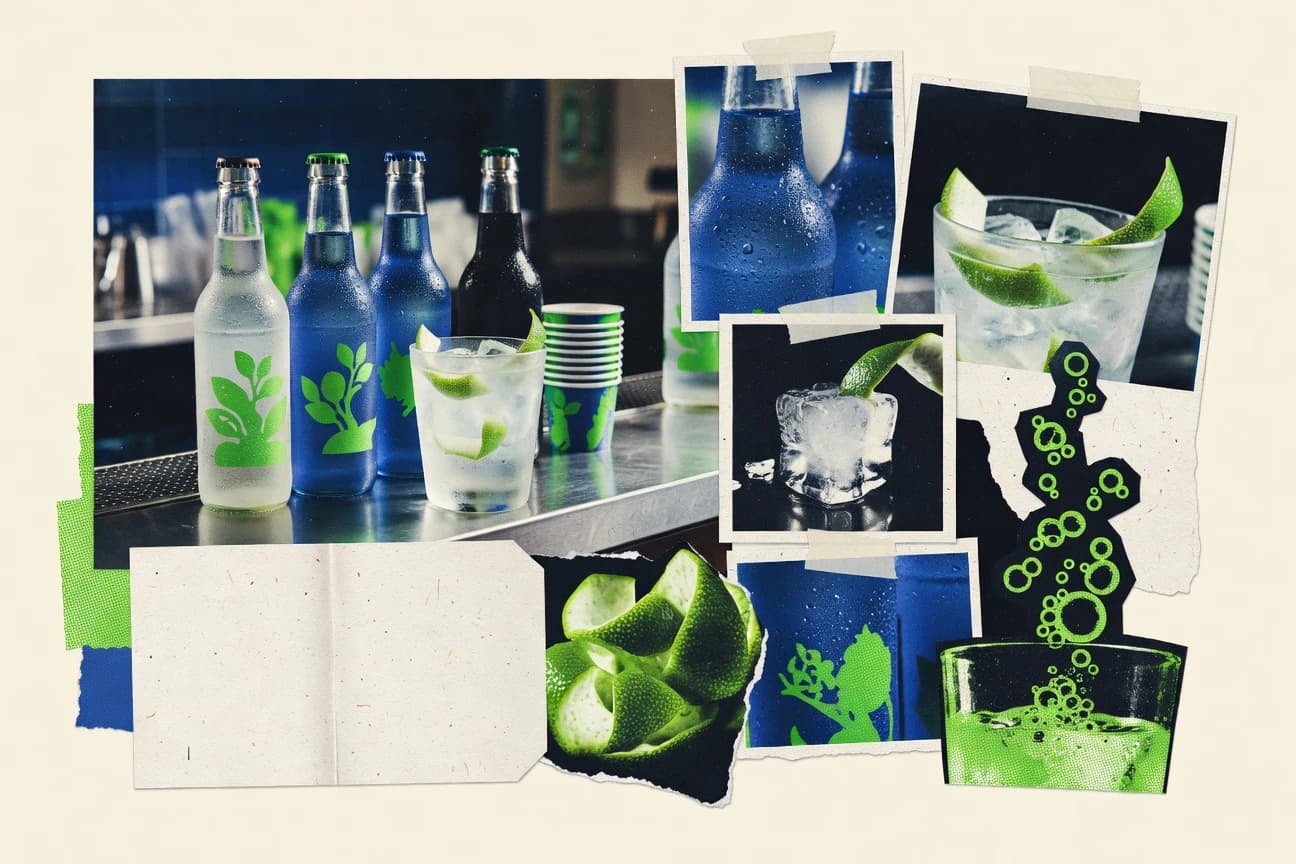
Non-Alcoholic Drinks Industry Statistics
Non-Alcoholic Drinks Industry figures for 2026 reveal how quickly premium refreshment is moving from a niche habit to mainstream demand, with growth that outpaces many still treatable as “substitutes.” If you think non-alcoholic is only about staying in, these statistics show where the market is pushing next and what that means for pricing, formats, and buying behavior.
Vietnam Beverage Industry Statistics
Vietnam’s beverage industry is shifting fast, with 2026 projections pointing to steady growth in the market while 2025 figures for beer, bottled water, and soft drinks reveal where demand is tightening or accelerating. Read these Vietnam focused statistics to see exactly which categories are gaining share and which ones are being squeezed.
Dessert Industry Statistics
Dessert Industry’s latest stats reveal how quickly sourcing and shopper behavior are shifting, with 2026 indicators pointing to a new baseline rather than a gentle trend. See which product categories are accelerating and what that means for margins, pricing, and menu decisions right now.
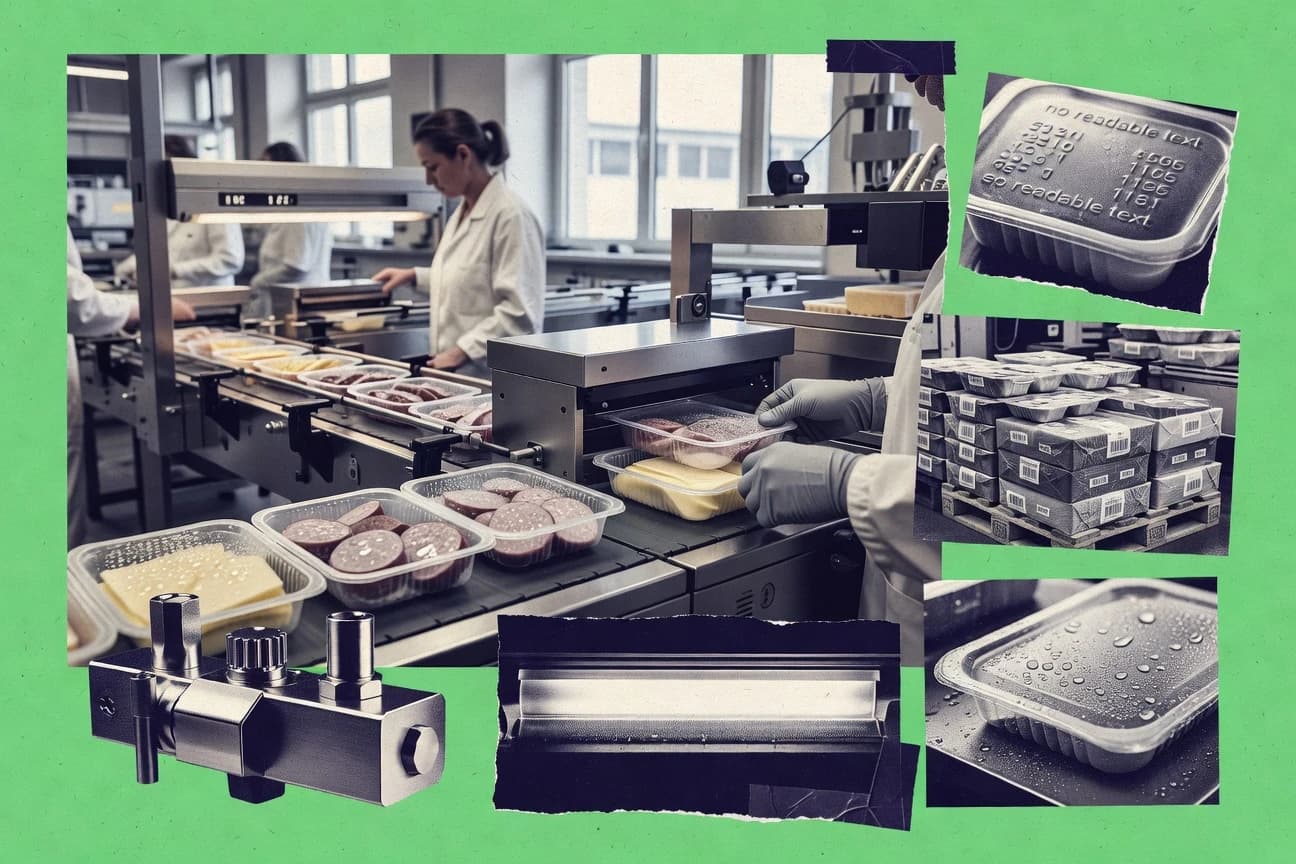
Food Beverage Cpg Industry Statistics
U.S. food and beverage operations face a high stakes mix of cost and compliance pressures, from ingredient driven price hikes identified by 41% of surveyed manufacturers to 56,779 total FDA food facility inspections in 2023, including 2,186 class I recalls. At the same time, packaged food continues to gain momentum and tech adoption is widening, including 8.3% year over year growth in global packaged food retail sales and real time production monitoring dashboards used by 49% of food manufacturers.
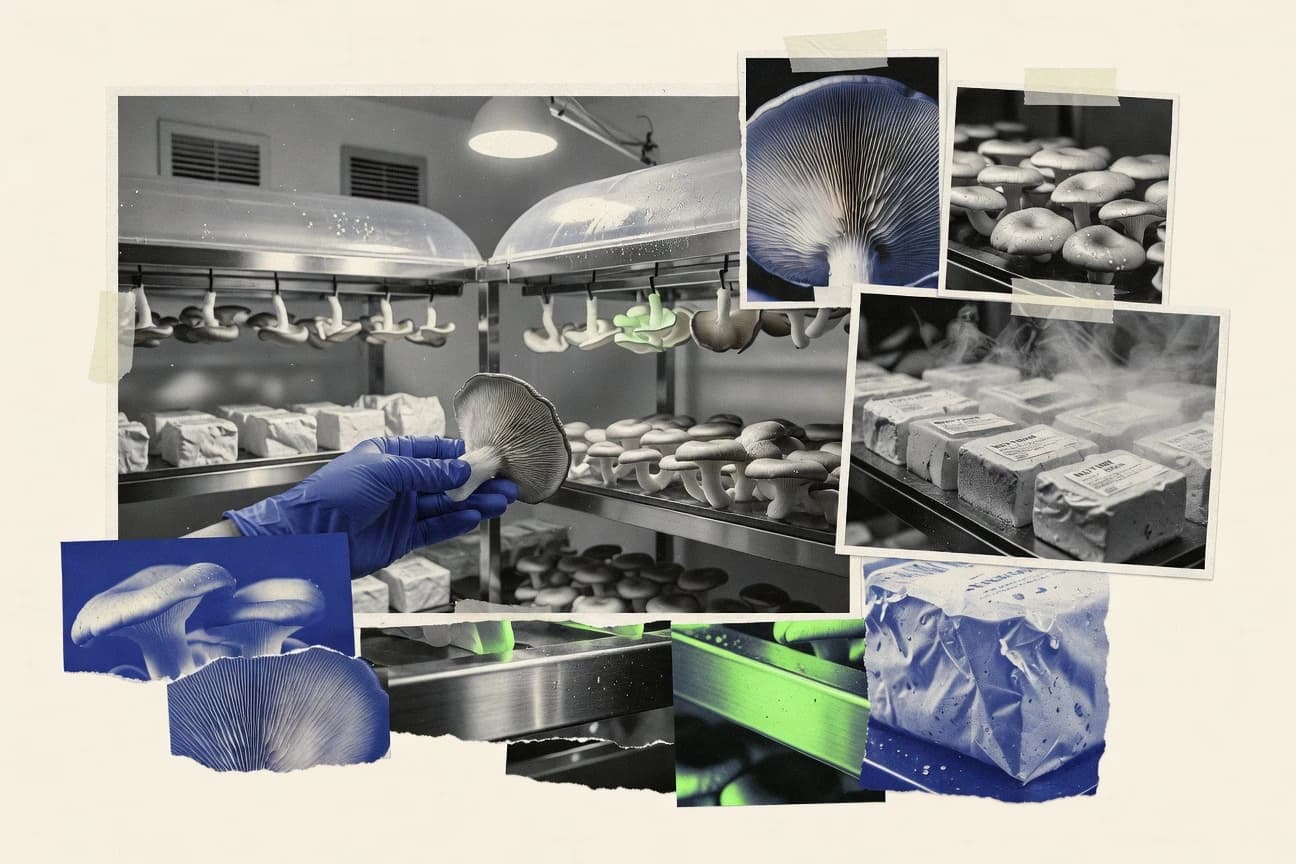
Functional Mushroom Industry Statistics
See the latest Functional Mushroom Industry numbers for 2025 and 2026, where rapid demand growth collides with shifting supply and pricing realities. It is the kind of data that helps you understand what is driving the market now, not just what was trending before.

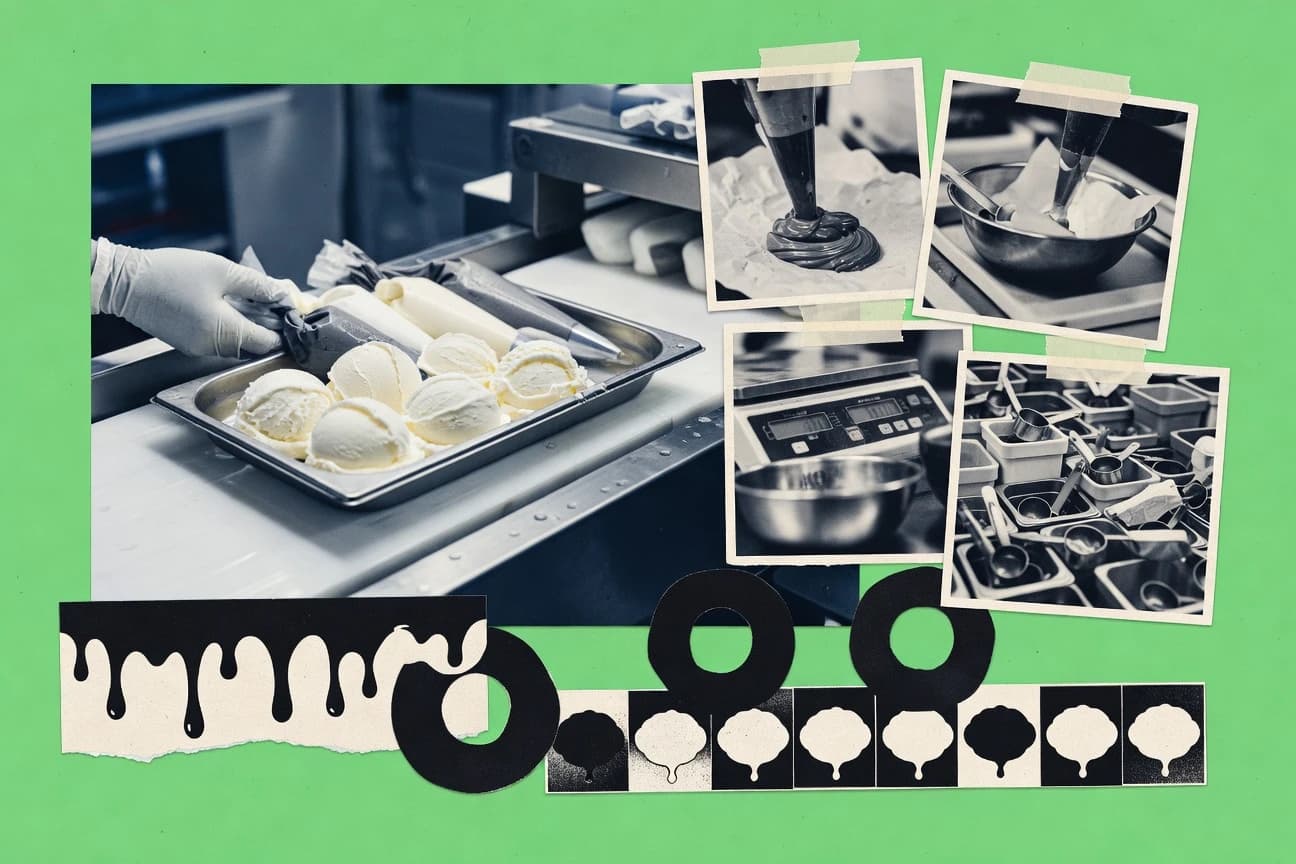
Icecream Statistics
Icecream’s latest ice cream statistics show bold shifts in what people actually buy and when they buy it, with 2026 figures revealing surprising new patterns instead of the usual seasonal guesswork. If you want to understand current tastes and spending behavior in plain, numbers first language, this page is the fastest way to get there.

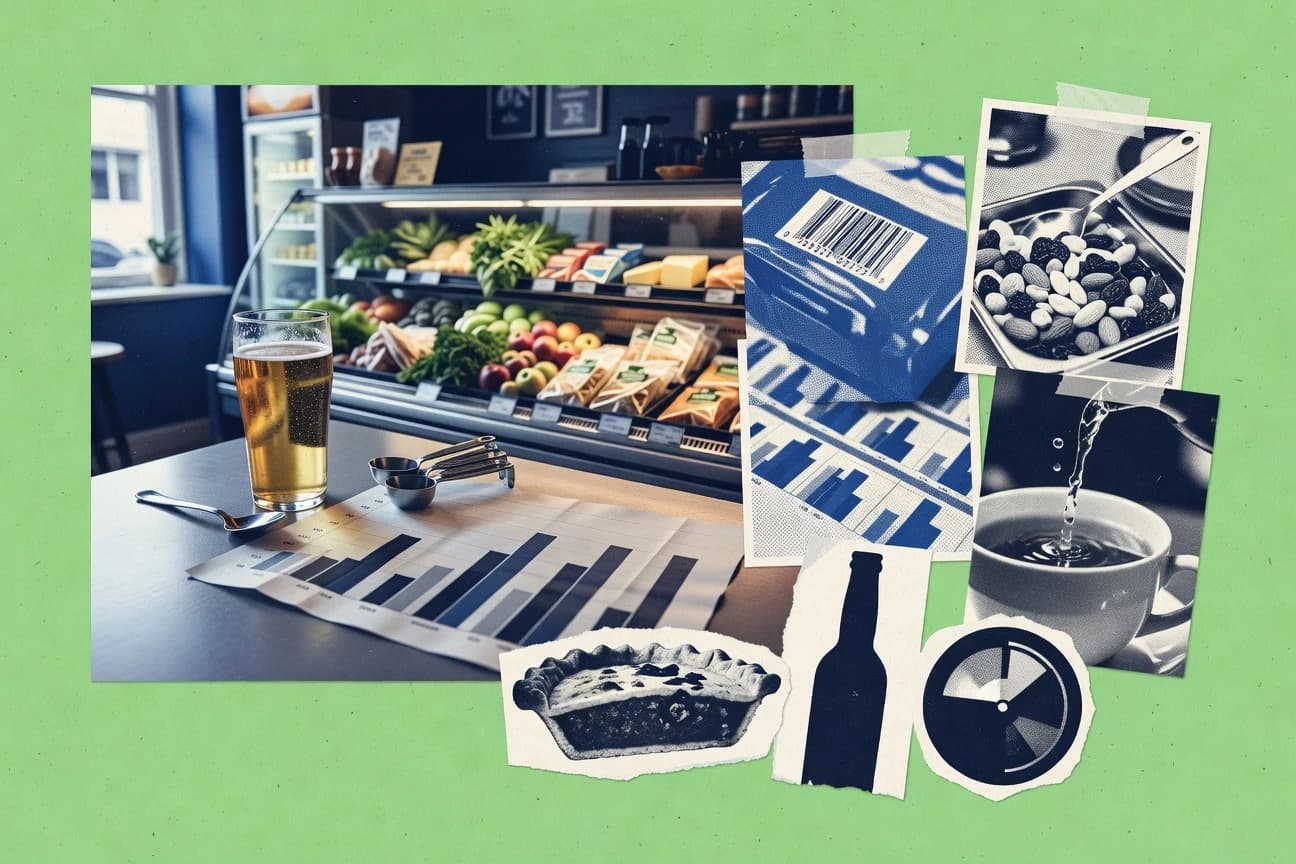
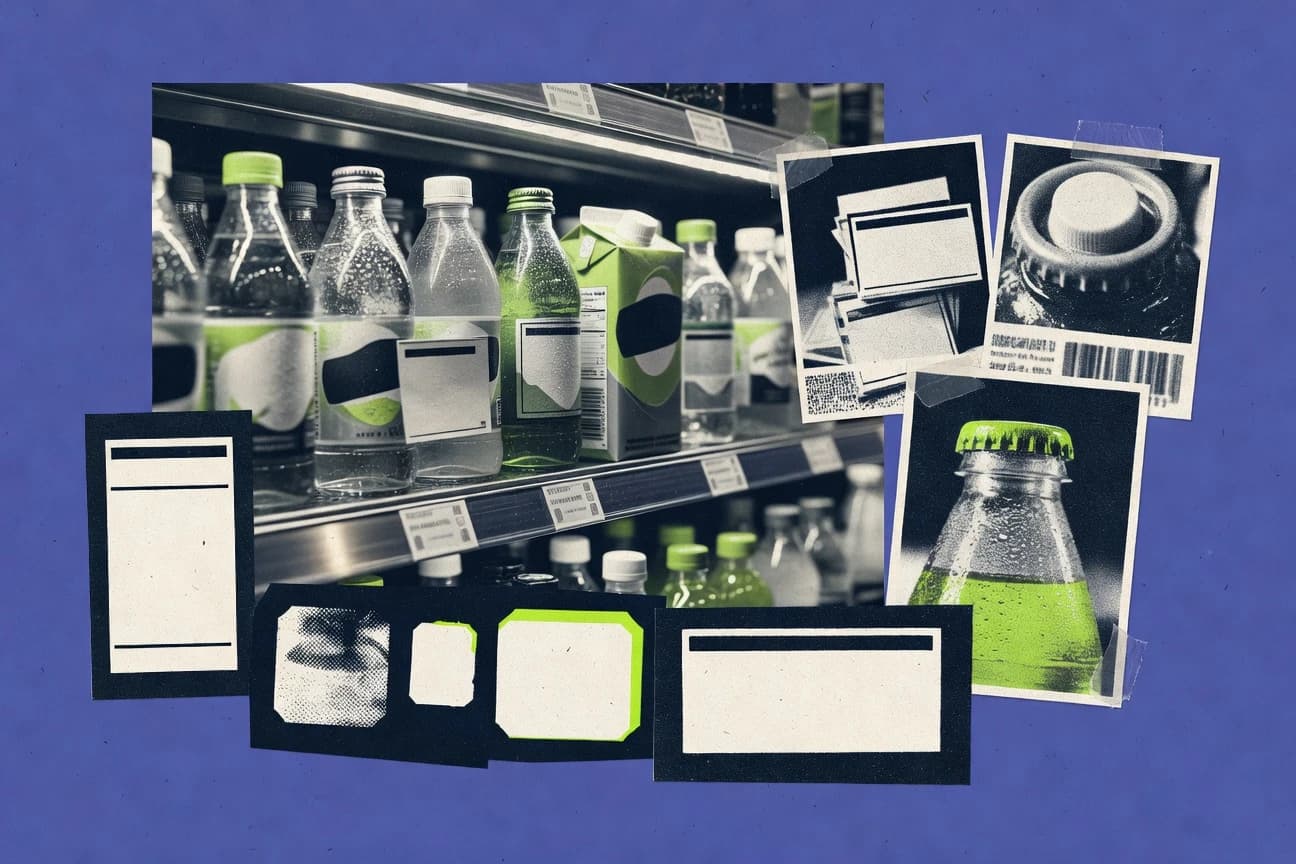
Beverage Statistics
Soft drinks lead with a USD 680.9 billion global market in 2023, but the real pressure point is how firms are funding growth while utilities, water use, and packaging volatility squeeze margins and margins react fast to input price spikes. See how a 2.3% beer CAGR for 2023 to 2028 and 25.6 billion of forecast beverage capacity investment in 2024 to 2027 sit alongside energy use cuts, better OEE, and 50% faster recalls enabled by traceability.
Organic Food Statistics
Organic food keeps pulling away from the “niche” label, with 2026 figures showing stronger growth than many shoppers expect. See how pricing, certified acreage, and demand signals are shifting together and what that means for your next grocery decision.
Latin America Food Industry Statistics
Latin America’s food industry is heading toward 2025 with demand expected to grow 5.4%, even as households feel pressure from 4.6% regional inflation and trade frictions that hit 25% of food exports with non tarrriff measures. From Brazil’s 6.5 million metric tons of soy output to the reality that 70% of hospitals say staff training on food safety is insufficient, this page connects production, nutrition, and regulation in a way that shows where momentum will help and where it could stall.
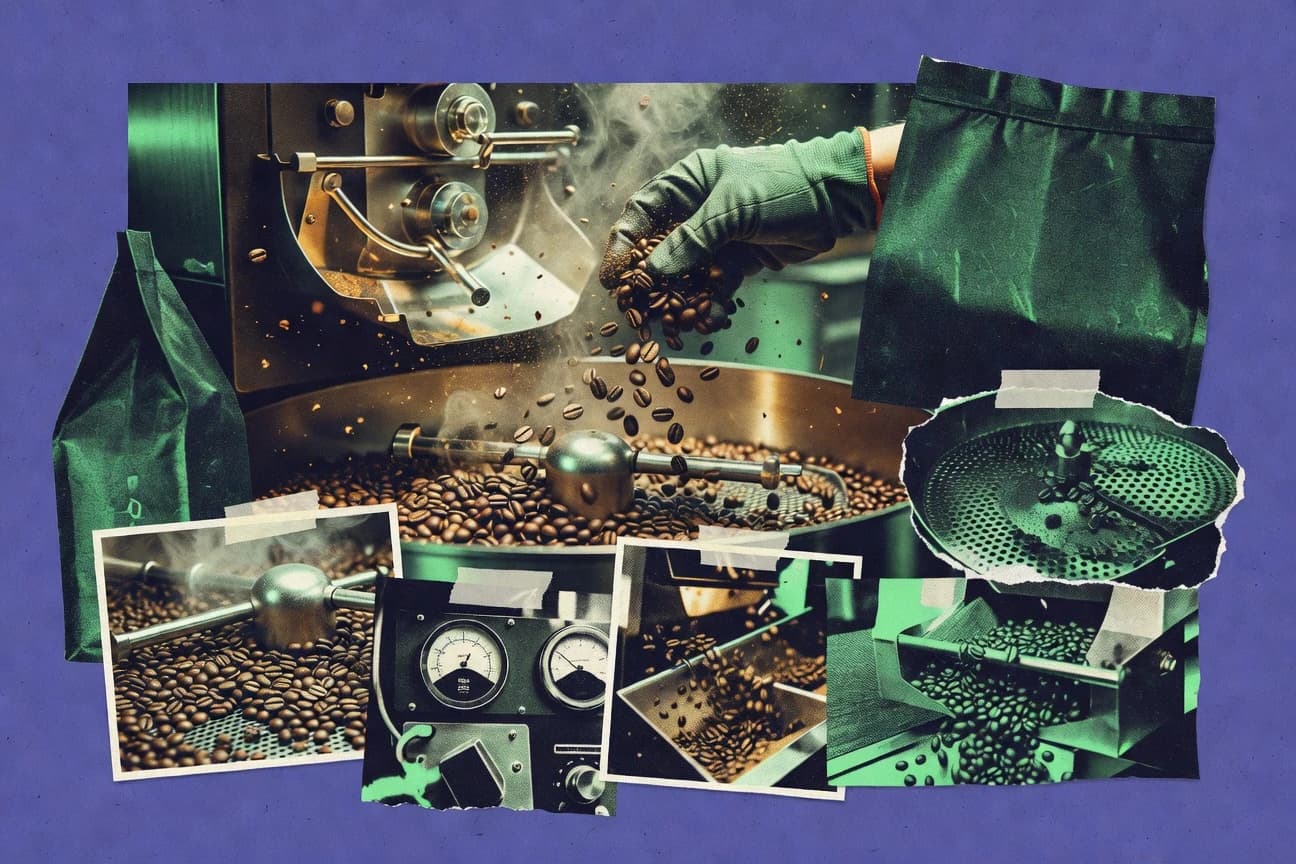
Coffee Roaster Industry Statistics
See how 2026 coffee roaster industry figures reshape expectations for demand, margins, and sourcing, with the newest shifts challenging what many producers assumed last cycle. If you care about where the next batch of growth will actually come from, these tight, updated stats make the tradeoffs impossible to ignore.
Food Beverage Manufacturing Industry Statistics
Food and beverage manufacturing outcomes are moving fast enough to make last year’s benchmarks feel outdated. Track the latest production, demand, and profitability signals for 2026, and see where operational momentum is strengthening or stalling.

Meal Prep Industry Statistics
See how meal prep demand keeps accelerating while margins and fulfillment costs tighten, with fresh 2025 figures that clarify what brands can sustainably scale. Get the benchmarks behind consumer preferences, delivery dynamics, and category growth so you can separate hype from operational reality.
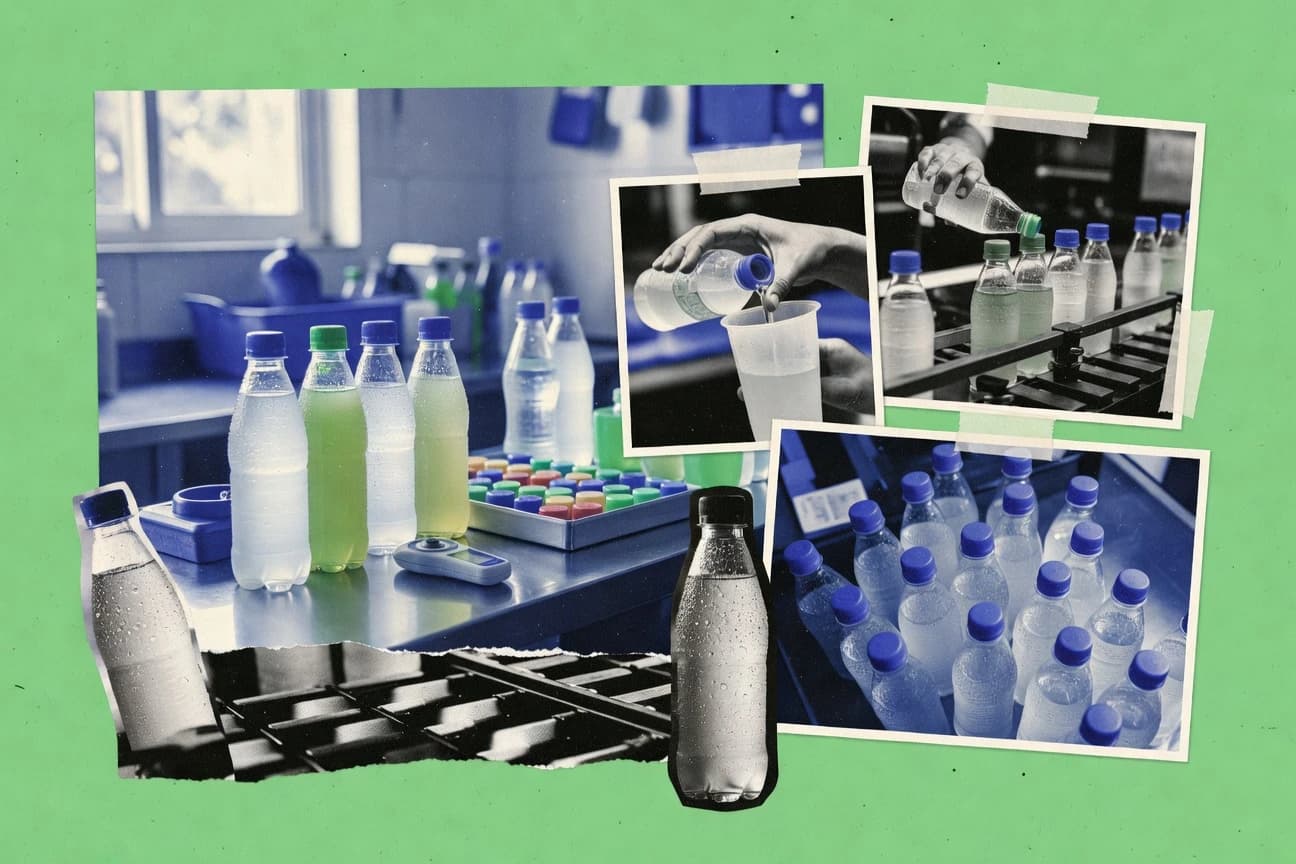
Water Bottling Industry Statistics
Projected global bottled water revenue is set to hit $488.9 billion by 2030 and regulators reported only 1.1% of bottled water samples failing microbiological standards on average from 2019 to 2021 even as consumer reasons keep shifting toward safety worries and convenience. See how investment, compliance activity, and cost and energy realities shape what happens on the plant floor and at the shelf, from 2,500 plus bottling plants worldwide to FDA import alerts and the practical impact of treatment and production benchmarks.

Condiment Industry Statistics
In 2026, global condiment production is forecast to keep climbing while the market leans harder toward bolder flavors, cleaner labels, and premium sauces, reshaping what retailers can reliably stock. Read the Condiment Industry statistics to see how fast growth is colliding with tightening consumer expectations, and what that shift means for brands trying to stay profitable.