GITNUX MARKETDATA
Browse Our Category
Food Nutrition
Latest update:


Soy Sauce Industry Statistics
See how soy sauce industry figures shift between 2025 and 2026 on production and market demand, and what that swing means for pricing and supply decisions. The page sets nearby data points against each other so you can spot whether growth is getting wider or narrowing fast.
Los Angeles Food Beverage Industry Statistics
From SB 657 responsible marketing rules and the next wave of single use packaging limits to $16.00 minimum wage floors, Los Angeles food and beverage businesses are operating under cost and compliance pressures that ripple from distributors to vending and restaurant service. This page stitches it together with hard local baselines, including 4.5 million LA County residents served by SNAP and 63% relying on public transit for commuting, alongside national signals like 85% of restaurants using digital ordering and food manufacturing PPI up 3.2% year over year.

Nutrition Supplement Industry Statistics
See how Nutrition Supplement Industry momentum shifted in 2025 with U.S. consumer demand scaling to 13.6% growth and a market reaching $196.6 billion, right as health and compliance pressures intensified. This page connects what people buy with what manufacturers must prove, so you can spot where margins and risk are moving next.

Russia Food Industry Statistics
How fast is Russia’s food sector reshaping itself, and what do the latest production and import shifts reveal about where demand is moving next. Get the most current 2025 and 2026 figures alongside the industry pressure points, from supply trends to pricing realities.

Ice Cream Sales Statistics
Ice cream sales keep changing shape, with 2026 trends pointing to exactly when demand spikes and which flavors and dayparts are driving the lift. Get the sharp statistics behind the shift from nostalgic staples to fast selling favorites so you can spot what is coming next before the rush.

Fast Food Health Statistics
Fast food touches more than your taste buds with 34% of kids ages 2 to 11 eating it at least once in 2015 to 2016, even as fast food delivers about 19% of U.S. sodium for children and teens and can pack 1,200 to 1,500 mg per meal. The page connects those nutrition tradeoffs to health risk and what could change right now, from menu labeling coverage across 21 states plus DC to the 38% of companies reporting they reformulate to cut sodium.
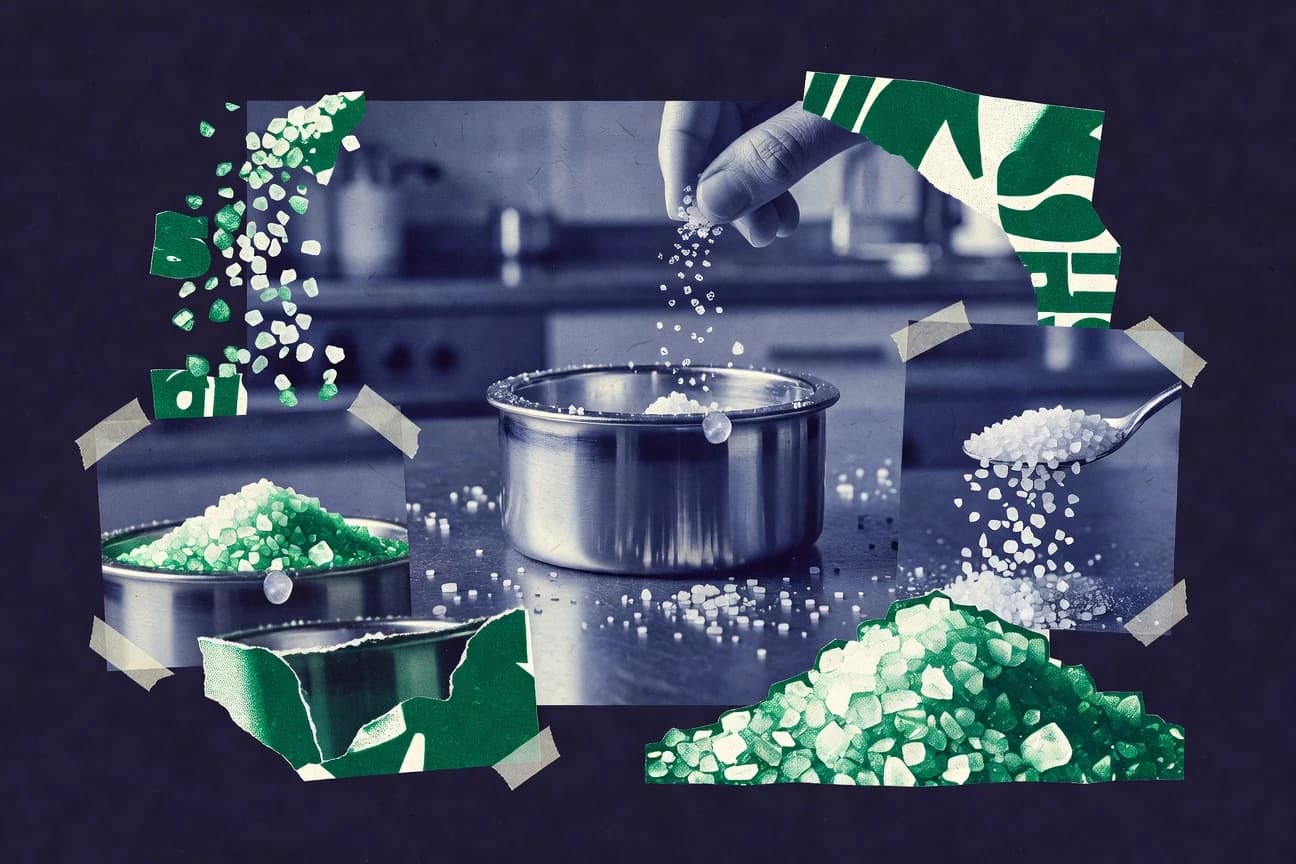
Salt Statistics
Salt data shows a sharp shift in 2025 toward faster, more precise salt handling, changing how teams measure performance week to week. See which Salt signals most strongly track improvements and where the numbers contradict what many teams assume.

Candy Statistics
Candy’s 2026 candy stats reveal how sharply tastes are shifting, with the newest spending and flavor trends moving faster than many shoppers expect. If you’ve been buying the same sweets for years, these fresh numbers will show what’s actually gaining momentum right now.

Mena Food Industry Statistics
See how Mena Food Industry’s most recent benchmarks reshape the region’s production priorities, with 2026 figures that capture where demand and capacity are headed next. The contrast between what brands are building and what the market is actually absorbing makes the trends hard to ignore.
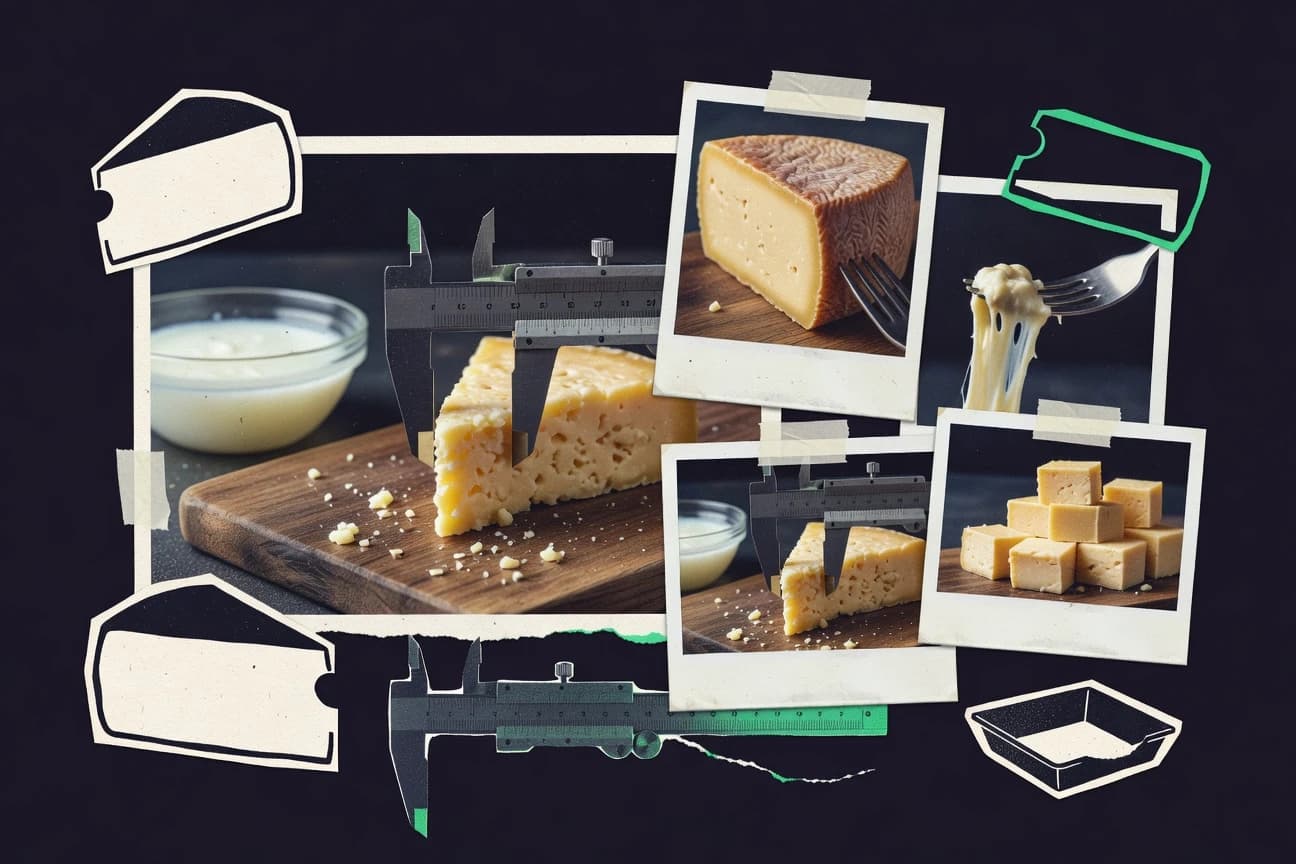
Cheese Statistics
Japanese cheese drinkers topped 13.3 kg per person in 2022 while global import and export values jumped to $15.6 billion and $18.9 billion, and a 2022 burden picture shows listeria risk is linked to at least 5% of foodborne cases in some surveillance summaries. You will also see how the market can be both huge and highly specific, with a projected global size of $126.6 billion by 2030 alongside details like typical hard cheese aging room temperatures and brine strengths that shape what ends up on shelves.
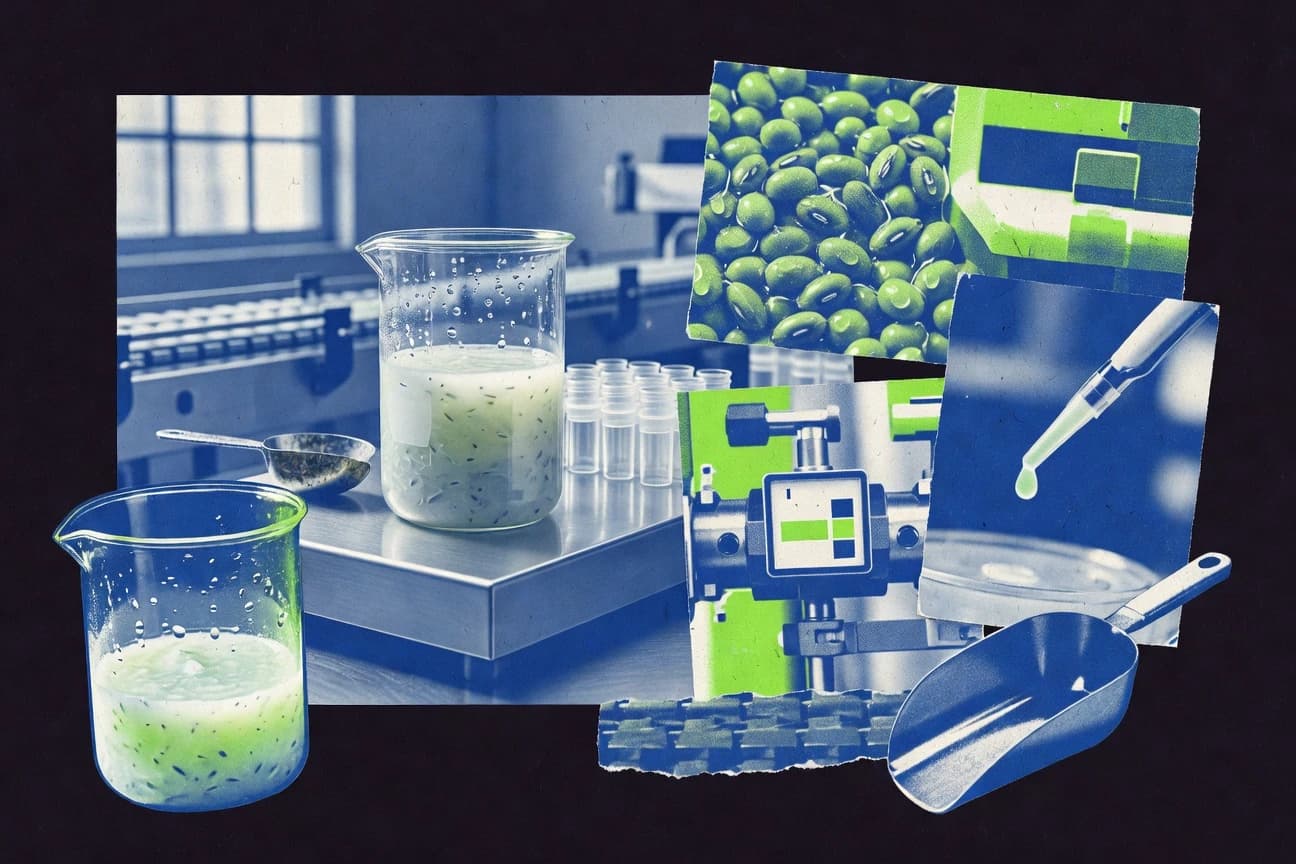
Plant-Based Protein Industry Statistics
See why plant based protein is moving from niche to mainstream, with plant based meat holding 19% global share in 2023 and a 20.3% projected CAGR for plant based protein ingredients through 2030. The page also pairs growth and regulation with formulation reality, from pea protein isolate strength and solubility to a 13% LDL drop in a randomized trial and about 70% lower emissions when red meat is replaced.
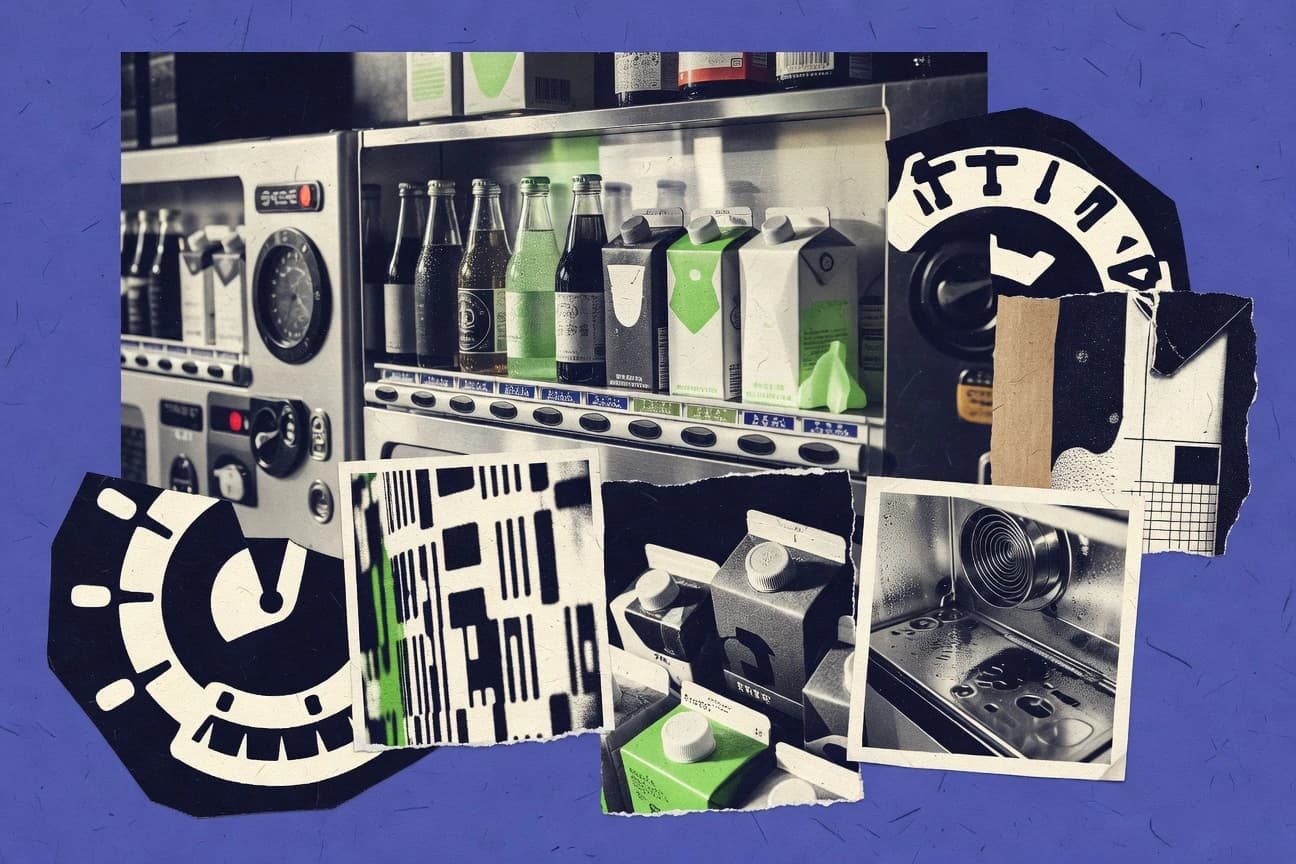
Japanese Beverage Industry Statistics
Japan’s Japanese Beverage Industry numbers are tightening in 2026 as key market indicators shift faster than many expect, putting pressure on brands that built strategies for a steadier demand curve. See how the latest figures for consumption, production, and pricing reshape the competitive balance and what that means for who wins next.

Ramen Industry Statistics
Ramen Industry’s latest figures reveal how quickly demand is changing, from what consumers buy most to where growth is actually concentrated. The contrast between steady supply chains and fast shifting preferences is stark enough that you will want the exact numbers behind it.
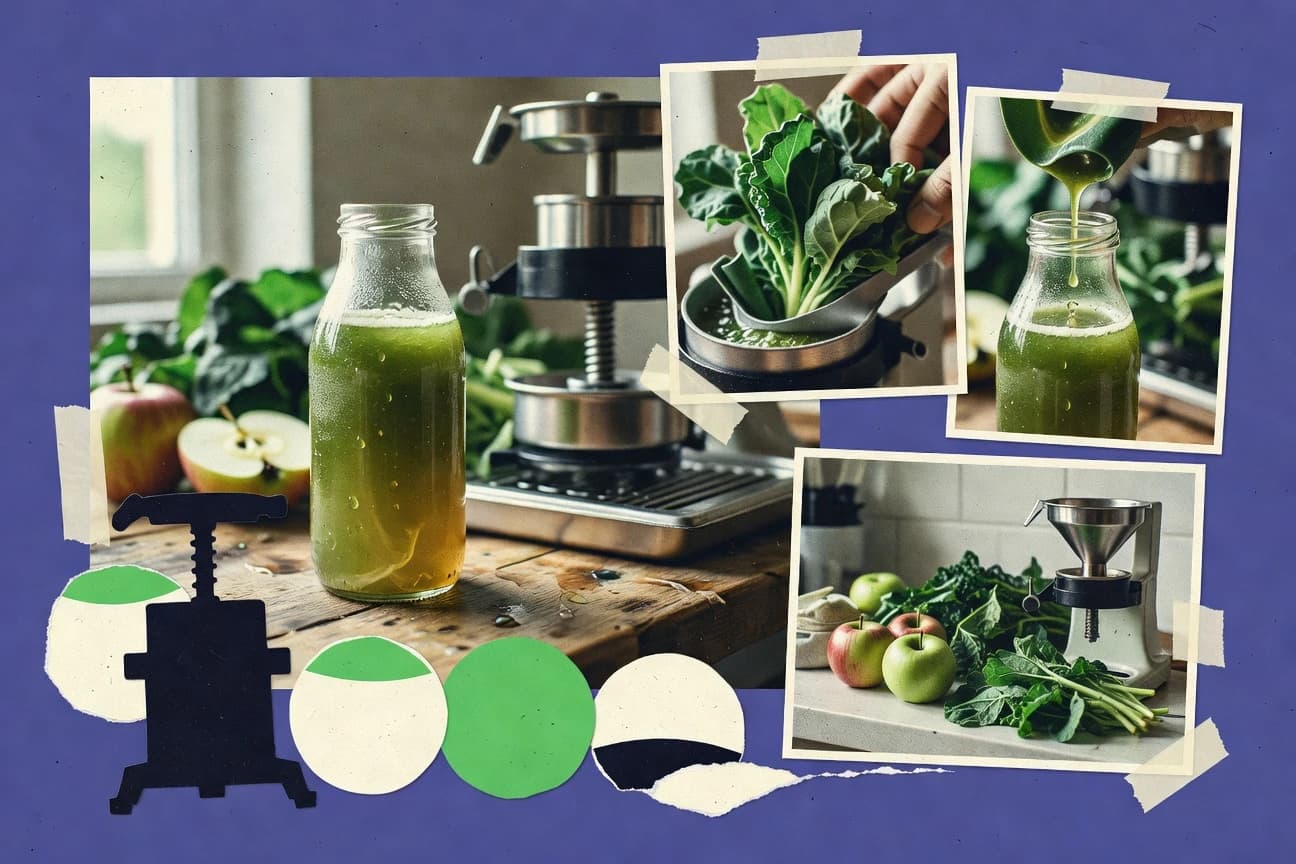
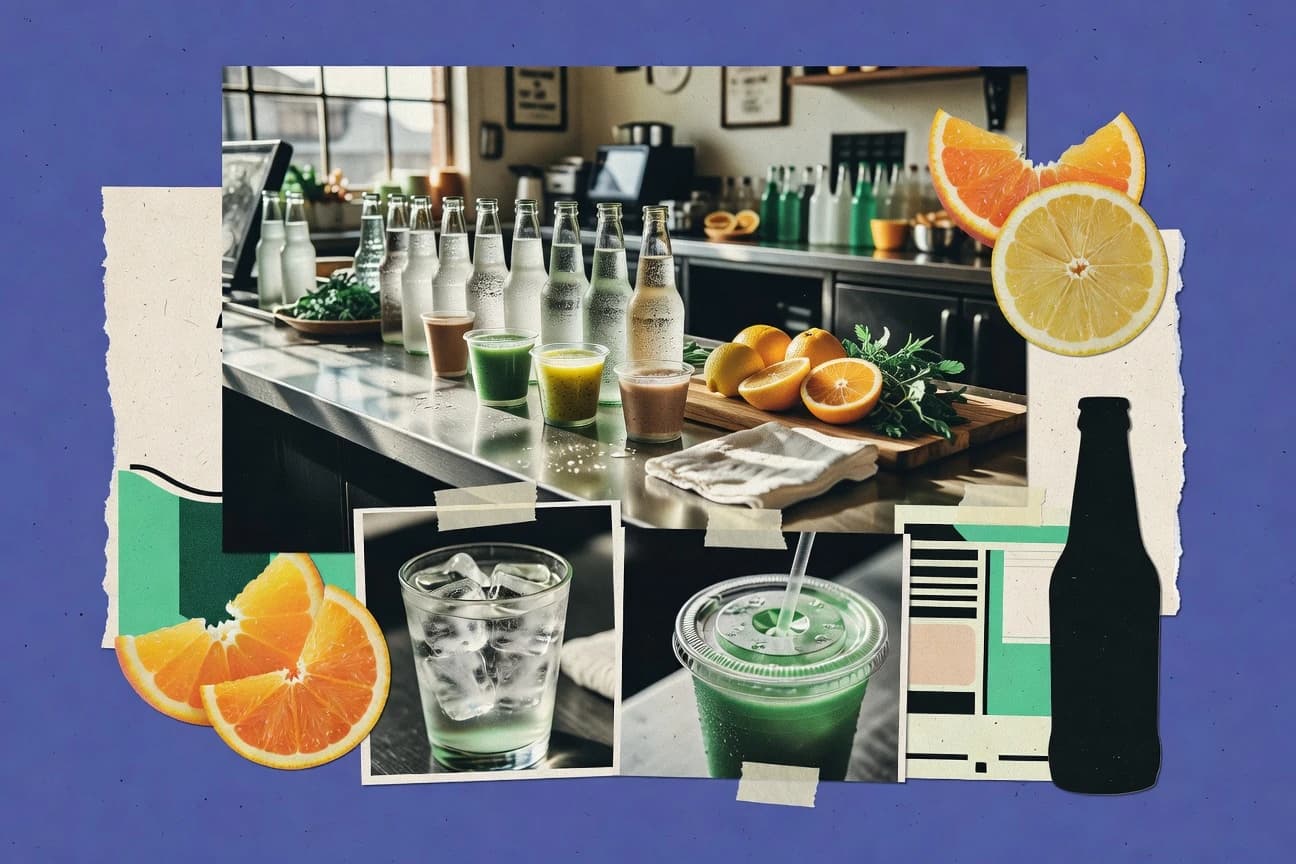
Organic Cold-Pressed Juice Industry Statistics
From US$117.5B in the global organic food market expected to reach 2032 to US$2.0B for organic juice by 2032, this page puts cold pressed reality against cold hard growth, including why organic accounts for 13% of global juice in 2023 and how HPP can hit 400 to 600 MPa to suppress microbes while better preserving vitamin C, phenolics, and antioxidant capacity than conventional thermal processing. You will also see the compliance and control pressure points processors face under FDA Juice HACCP in 21 CFR Part 120 and EU organic labeling rules that shape consumer trust.
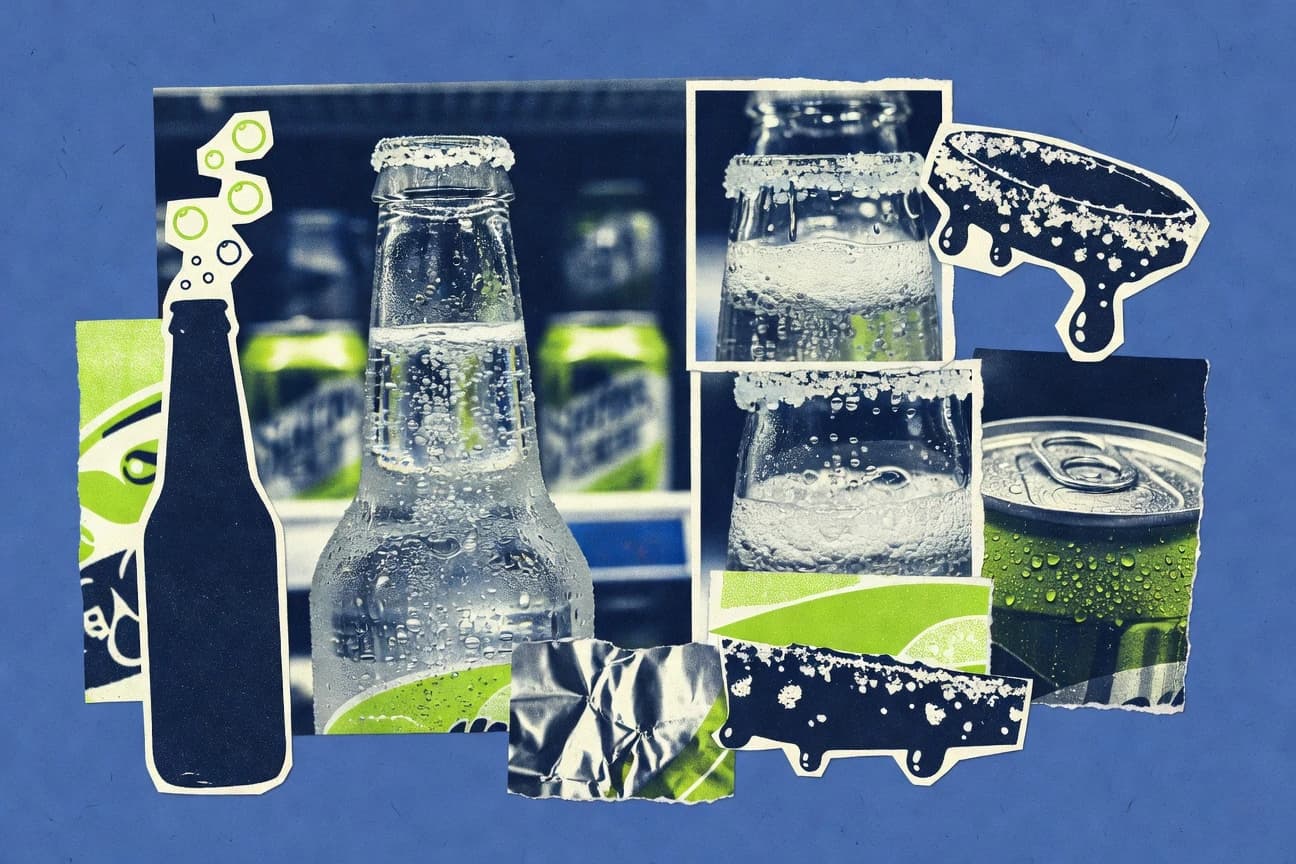
Seltzer Industry Statistics
Seltzer Industry statistics track how category demand and production scale are shifting, with fresh 2026 snapshots that highlight a clear gap between where growth is happening and where suppliers are still catching up. If you want to understand which forces are reshaping pricing, capacity, and demand fast enough to matter in 2026, this is the page to compare side by side.

Taiwan Coffee Industry Statistics
See how Taiwan’s coffee industry is shifting, with 2026 exports reaching a standout 3.3 million bags while the average farm gate price in 2025 climbs to NT$3,000 per kg. The contrast between rising value and the realities of supply is exactly what you need to understand what’s driving producers, roasters, and market demand right now.
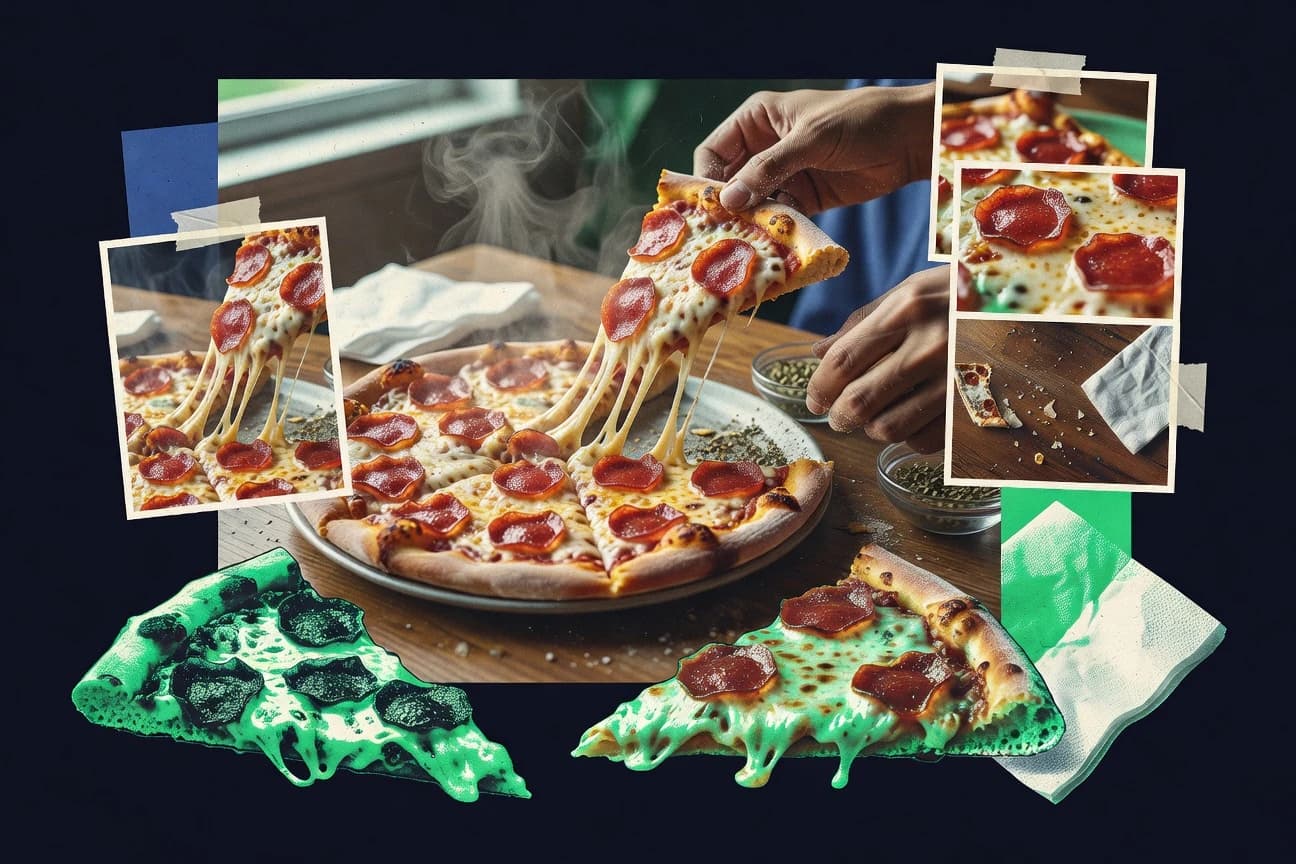
Pizza Consumption Statistics
US consumers bought 3.07 billion pizzas in 2023 and ordering has shifted even faster toward delivery, with 73% of pizza chain orders using contactless delivery in 2020 and online pizza ordering hitting $10.5 billion in 2023. From per capita consumption highs in places like Italy to how dinner drives 32.0% of pizza habits and frozen pizza can overshoot sodium targets, this page connects appetite, pricing, and health signals in one set of clearly sourced figures.

Gelato Industry Statistics
Ice cream and gelato demand is forecast to keep climbing with a 2.8% CAGR through 2032, reaching a $55.0 billion global market by 2030, while shoppers increasingly police what goes into the cup with 44% wanting transparent sourcing, 78% reading labels, and 84% saying they want less sugar. For operators planning production margins, staffing, and cold chain risk, the page maps how costs and quality controls collide with buying behavior, including the U.S. ice cream sales of $26.2 billion in 2023 and a 28.7% average gross margin for U.S. ice cream manufacturers.
Health Food Industry Statistics
Organic growth and functional food momentum are pulling the whole health channel forward, from a 14% 2019 to 2024 organic market CAGR to functional food projected to hit US$ 330.6 billion by 2032. You will also see how fast categories like probiotics, omega 3, plant based dairy, and protein powders are climbing alongside shifting consumer habits, plus the rules and technology shaping what can be sold and how it is tracked.

Saudi Coffee Industry Statistics
Saudi Arabia’s coffee picture is changing fast, and the latest 2025 figures show where the momentum is building, from how consumption is moving to what it means for farms, roasting, and retail. See the sharp contrasts behind the growth and the pressures shaping prices and demand across the Kingdom.