GITNUX MARKETDATA
Browse Our Category
Food Nutrition
Latest update:


Meal Kit Delivery Services Industry Statistics
US meal kit subscribers still total 27.1 million, yet average orders hit $49.86 in 2023 while shoppers increasingly treat meal kits as a spending lever, with substitution linked to 5–10% higher weekly grocery spend. From 14% buying for reducing food waste to recipe included at home for every meal, the page connects pricing and churn pressures with what drives adoption across the US, UK, Germany, and France.
Food Processing Industry Statistics
Food Processing Industry’s latest stats show a clear shift in how production, inputs, and costs are moving, with 2025 figures setting a more urgent baseline than the prior year. Get the numbers that explain what changed and why it matters for processors trying to stay competitive as margins tighten and supply pressures evolve.

Nutrition Statistics
Food and beverage markets are massive, yet nutrition outcomes remain deeply uneven, from 1 in 10 people worldwide suffering undernourishment to 650 million facing acute food insecurity. You can also connect the dots between compliance and clarity, since 41% of U.S. adults used a nutrition label to make choices in 2023 while 38% of global food is wasted each year, adding urgency to how we eat, label, and lose less.
Poland Food Industry Statistics
Poland Food Industry statistics for 2025 lay out where the sector is gaining momentum and where it is getting squeezed, with fresh production and trade figures that make the year feel unusually decisive. Use the page to spot the sharp contrasts behind demand, input costs, and market shifts so you can see what changed and what is likely to matter next.

Gulf Food Industry Statistics
Get the latest Gulf Food Industry snapshot on how production and demand are moving fast, including the sharp rise in 2025 food and beverage output alongside shifting trade dynamics. It is the kind of data you can’t spot from headlines alone and it explains where the industry is gaining momentum and where pressure is building.
Kazakhstan Food Industry Statistics
With food and non alcoholic beverage prices up 12.2% and overall inflation at 15.0% in the latest 2024 readings, Kazakhstan’s consumer pressure is clear even as the economy grows 3.3% and food processing exports rise 34.0% of share. Get a practical picture of how population and obesity trends, import costs for dairy, sugar and animal feed, and EAEU food safety rules collide with a $5.8 billion packaged food market.
Mineral Water Industry Statistics
See how mineral water brands are reshaping volume and value swings with the 2026 numbers, where growth and pricing pressures collide. You will get the specific industry metrics behind changing demand, consumption patterns, and the market’s momentum, so you can spot what is driving the next shift.

Caffeine Statistics
Get a sharp look at how Caffeine use and demand are shifting right now, with 2026 numbers that make the usual coffee narrative feel a bit outdated. You will see where the biggest jump is happening and what that means for anyone trying to set a smarter caffeine limit.

Healthy Snacks Industry Statistics
Healthy Snacks Industry numbers in 2025 and 2026 point to a clear shift from “better for you” claims to measurable demand, with consumers steering toward cleaner ingredients and smarter portion choices. Read the statistics page to see what categories are growing fastest and which labels are gaining trust as the market’s definition of healthy tightens.

South Korea Food And Beverage Industry Statistics
South Korea’s food and beverage industry is showing sharper swings than many expect, with 2026 figures putting the spotlight on where demand and production momentum are heading next. Use the page to compare the latest topline benchmarks with the year to year pressure points that matter to brands, retailers, and investors.

South Africa Sugar Industry Statistics
South Africa’s sugar industry is more than a harvest story, it is a people, jobs and trade picture shaped by risk and resilience. Read how employment totals 85,000 direct jobs in 2023, how HIV prevalence among workers fell to 12% in 2022, and how exports reached 1.05 million tons in 2023 even as the sector cut 4,500 jobs since 2020.
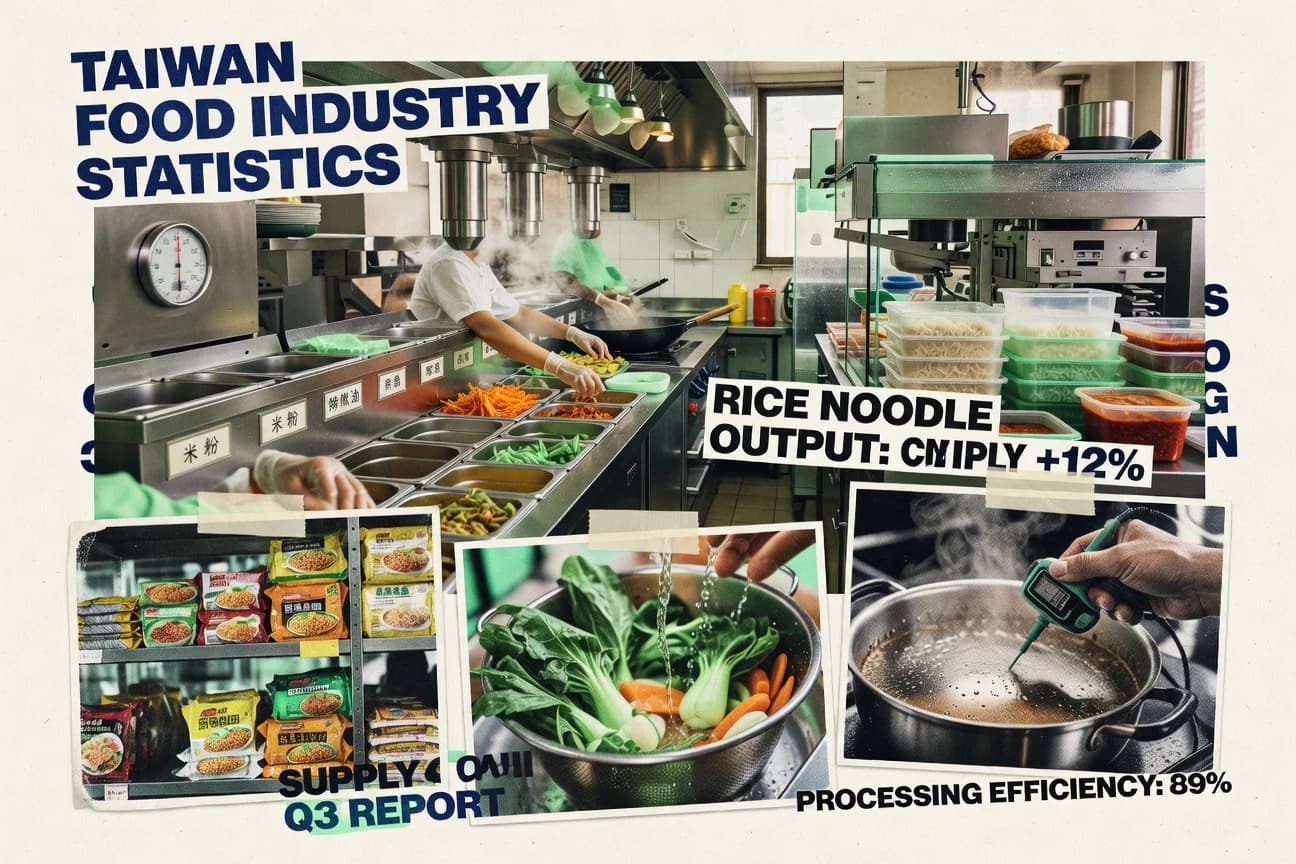
Taiwan Food Industry Statistics
Taiwan’s food industry statistics make one sharp point stand out: output growth isn’t keeping pace with the rising pressures inside the sector. See how 2025’s latest figures on key production and supply trends differ from the benchmarks businesses have been relying on, and what that gap suggests for the next moves.

Turkey Food Industry Statistics
Turkey’s food and beverage industry is showing sharp pressure points and big digital momentum at the same time with 2023 retail grocery sales of about USD 140 billion and food price inflation at 10.1% in May 2024. Food shortages and compliance realities sit alongside supply chain strain and scale, including 35.4% household food insecurity in 2022, 5,600 plus RASFF human notifications in 2023, and a 2023 trade deficit of USD 19.3 billion for food and beverages.
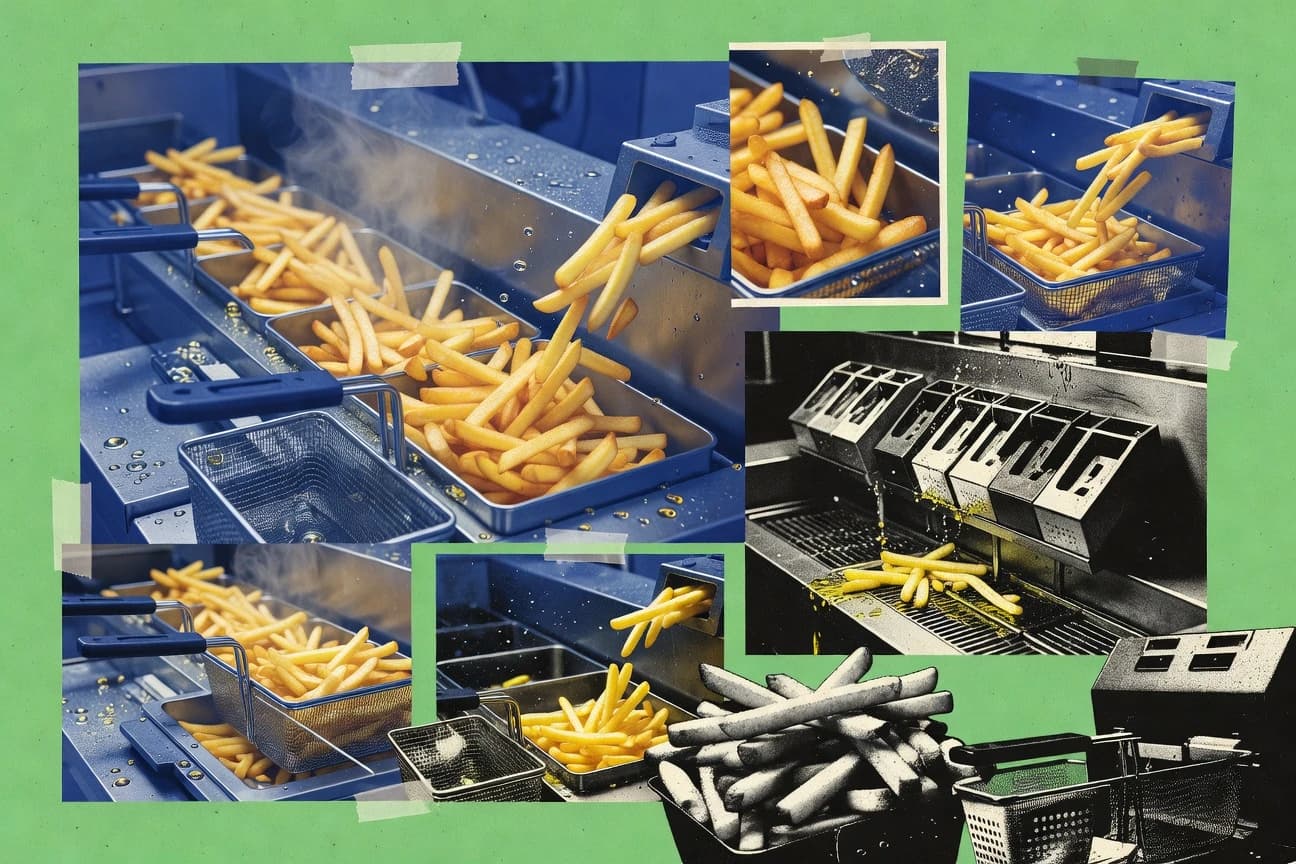
French Fries Industry Statistics
What happens when demand keeps rising while fry inputs, energy, and labor costs squeeze every margin? French Fries Industry statistics for 2025 surface the pressure points behind production and pricing so you can see where profitability is tightening and what that shift means for the next buying cycle.
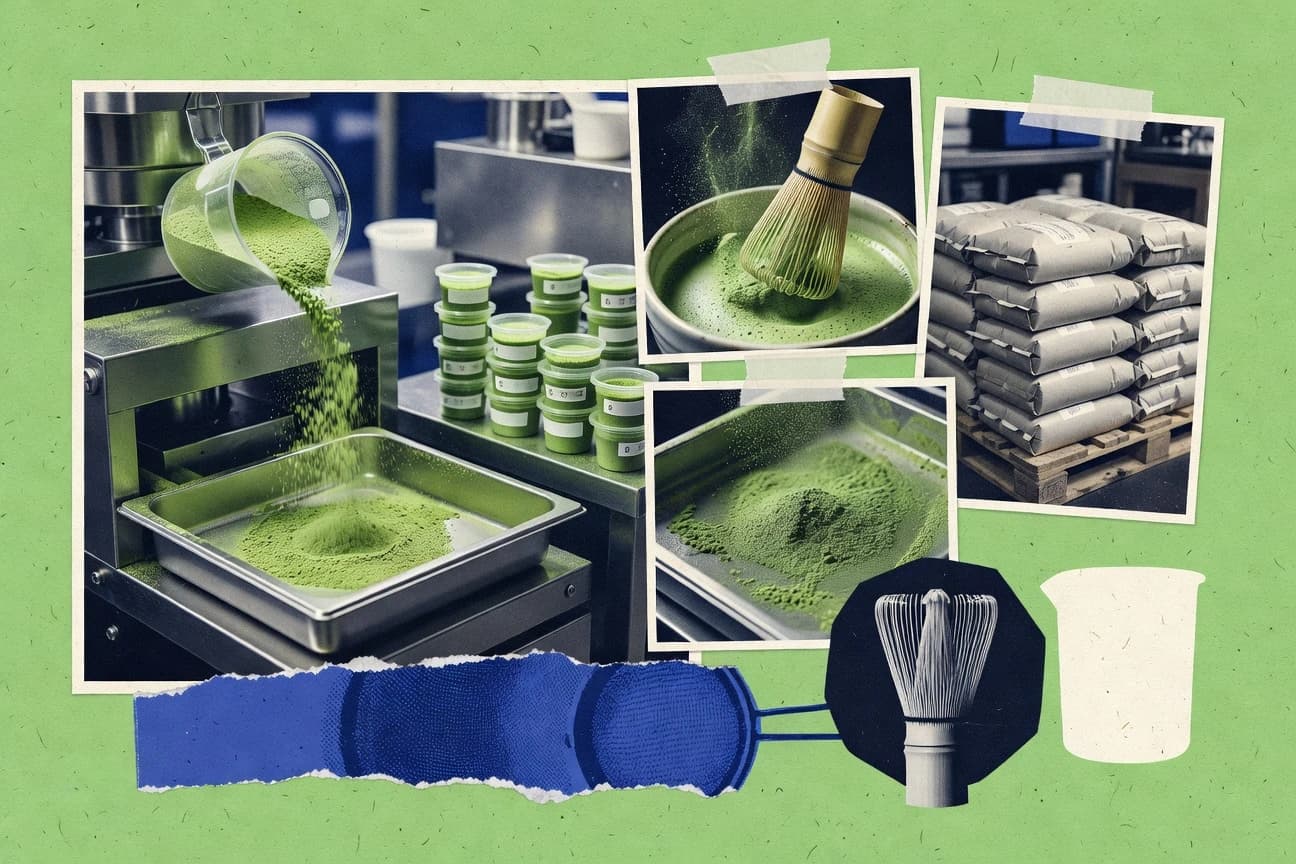
Matcha Tea Industry Statistics
Global matcha tea is already a $4.3 billion market, yet the real battleground is granular and regulatory, where Japan’s gyokuro ready for matcha inputs, EU caffeine and pesticide limits, and ISO 22000 style controls all shape what can be sold and how. Pair that with U.S. retail tea at about $15 billion and specialty tea at roughly 13 percent to see why matcha’s premium science claims, from EGCG to thermogenesis and antioxidant markers, have to clear both consumer expectations and tight production specifications.
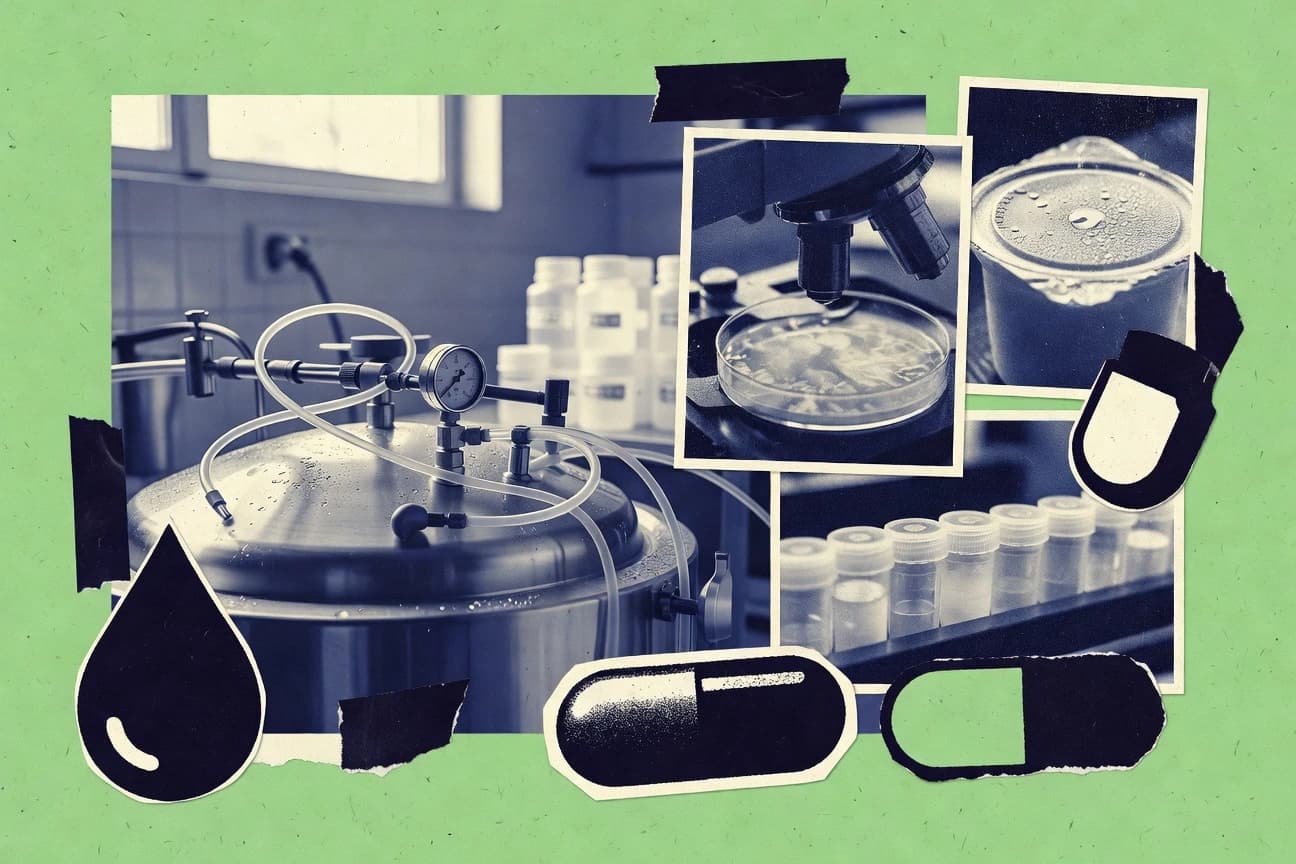
Probiotic Industry Statistics
Track how probiotic science turned into measurable industry momentum by 2026, including the size of the global market, its growth rate, and where demand is reshaping production. You will see which regions are pulling ahead and how the latest trends in strains and formulations are changing the balance between research and real-world shelf outcomes.
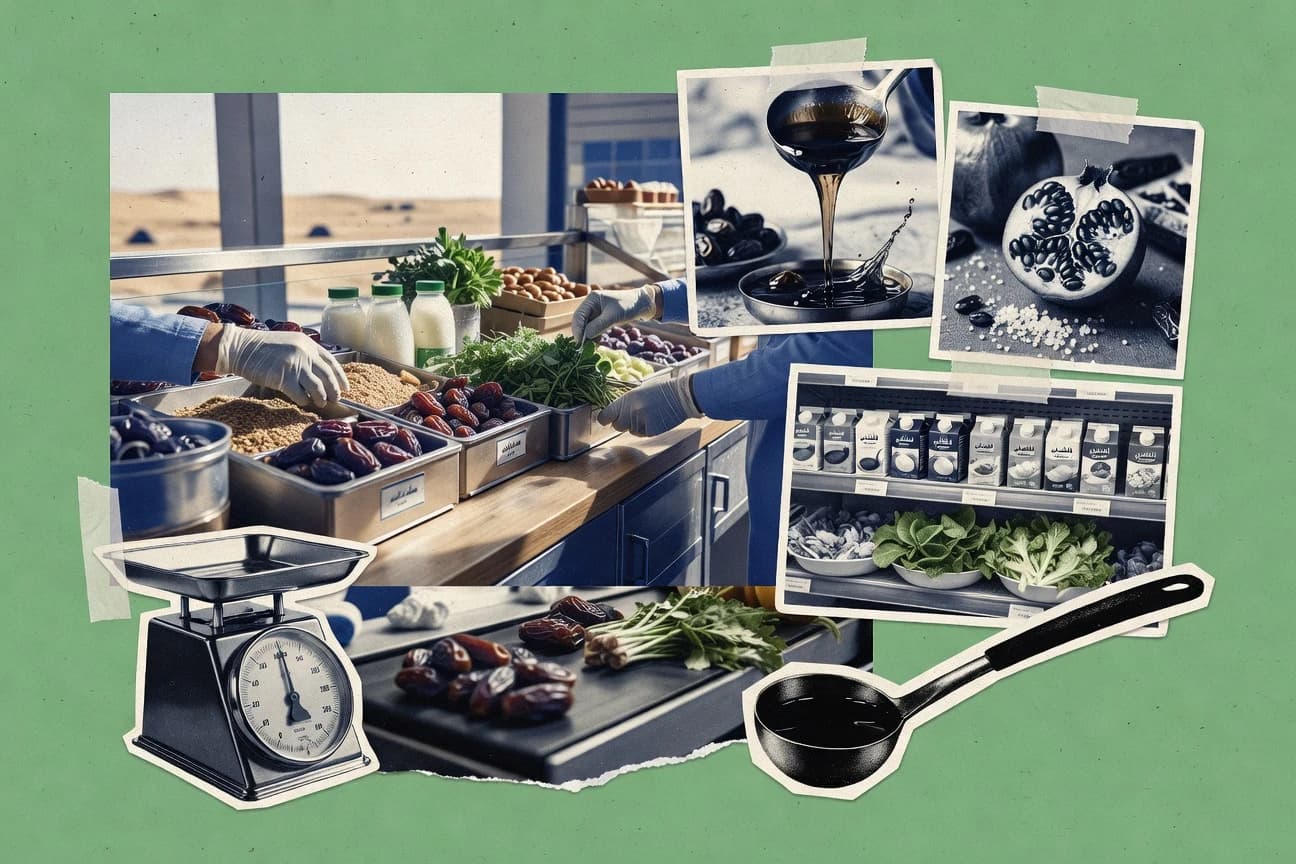
Saudi F&B Industry Statistics
Get the Saudi F&B picture beyond headlines, with the latest 2025 and 2026 indicators that reveal how quickly demand, investment, and consumer appetite are shifting. It’s a useful reality check for anyone tracking where growth is accelerating and where margins and momentum may be tightening.
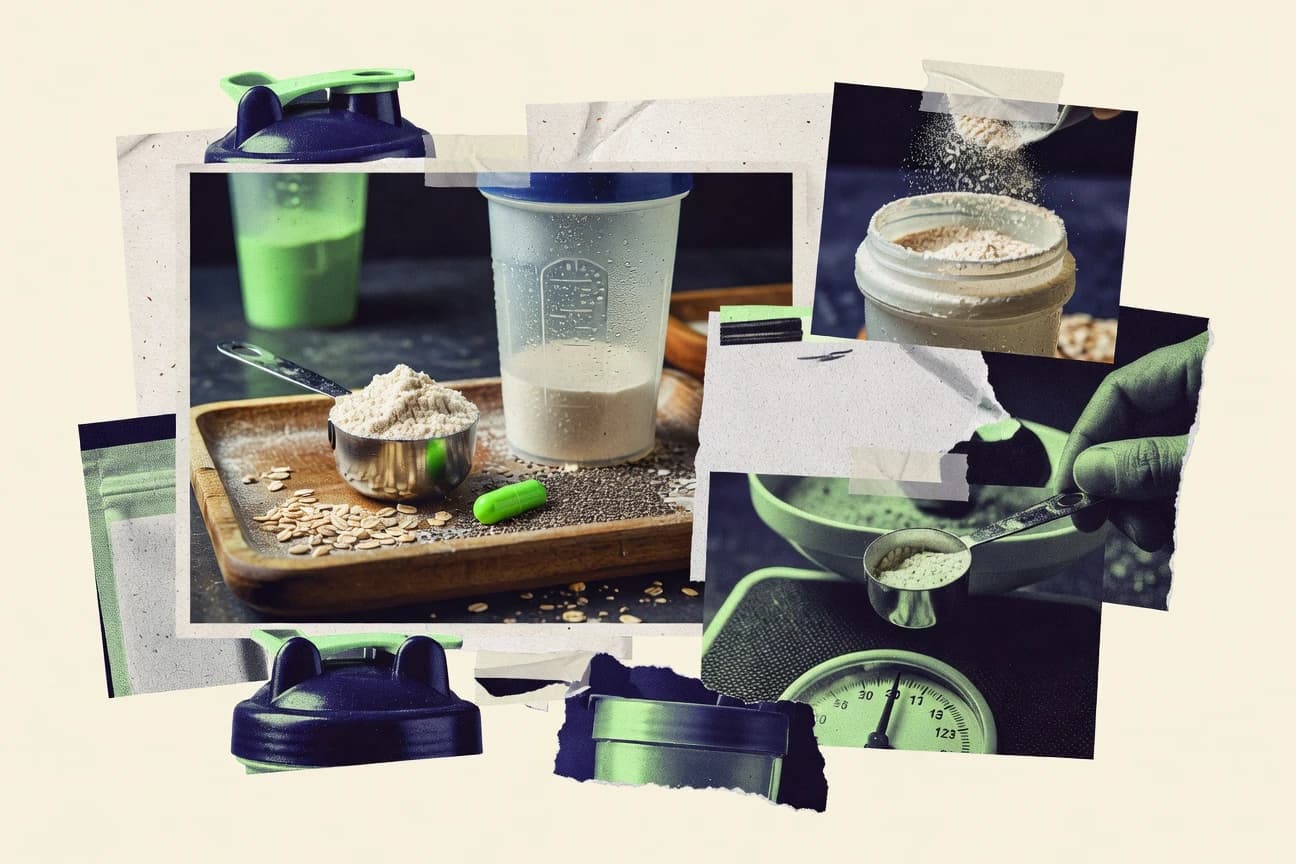
Sports Nutrition Industry Statistics
Sports Nutrition Industry statistics reveal a sharp shift in how performance athletes and everyday fitness consumers are choosing supplements, with 2026 figures showing demand moving faster than traditional marketing models expect. See which products are gaining ground and which are slipping, so you can spot where category momentum is headed next.
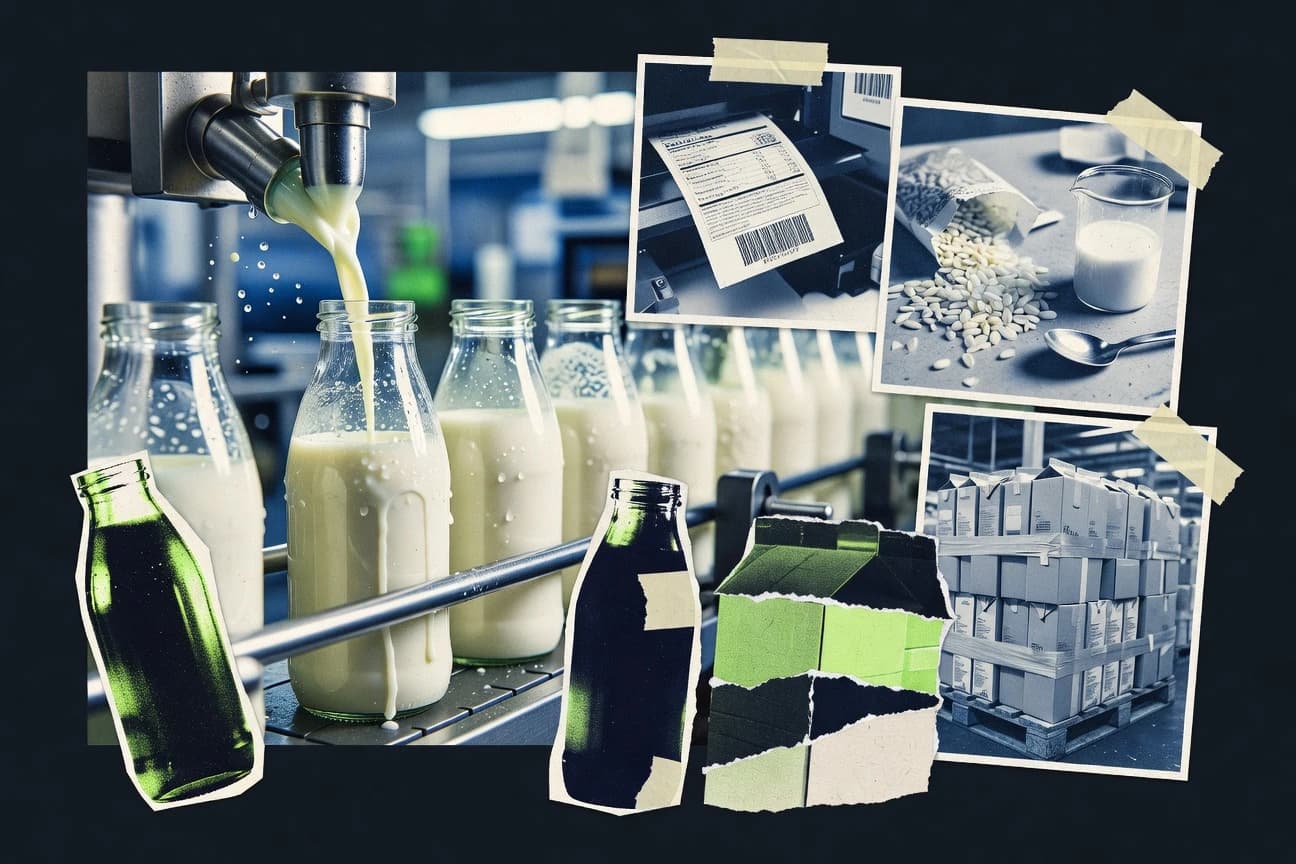
Oat Milk Industry Statistics
US oat milk retail sales reached $5.5 billion projected global market by 2028 and the US market is forecast to expand at a 29.2% CAGR from 2024 to 2030, even as shoppers use just 27 grams of oats for a 240 ml cup and sustainability studies often peg the footprint around 0.5 to 0.7 kg CO2e per liter. This page stitches together growth, penetration, and life cycle findings plus the rules that shape what can be fortified and claimed, so you can see why oat drinks keep gaining share while policy and environmental metrics set the terms.

Middle East Food Industry Statistics
See how Middle East food industry momentum is reshaping demand and investment, with 2026 figures highlighting what suppliers must plan for now. The contrast between fast changing consumption patterns and where production capacity is actually landing makes the data hard to ignore.