GITNUX MARKETDATA
Browse Our Category
Food Nutrition
Latest update:


Food Manufacturing Industry Statistics
Even as food manufacturing output keeps rising, margins are being squeezed by faster wage growth and tougher input costs, with 2025 figures signaling how profitability is shifting in real time. Get the clearest snapshot of capacity, labor, and production pressure that explains why 2026 priorities are already being written in the numbers.
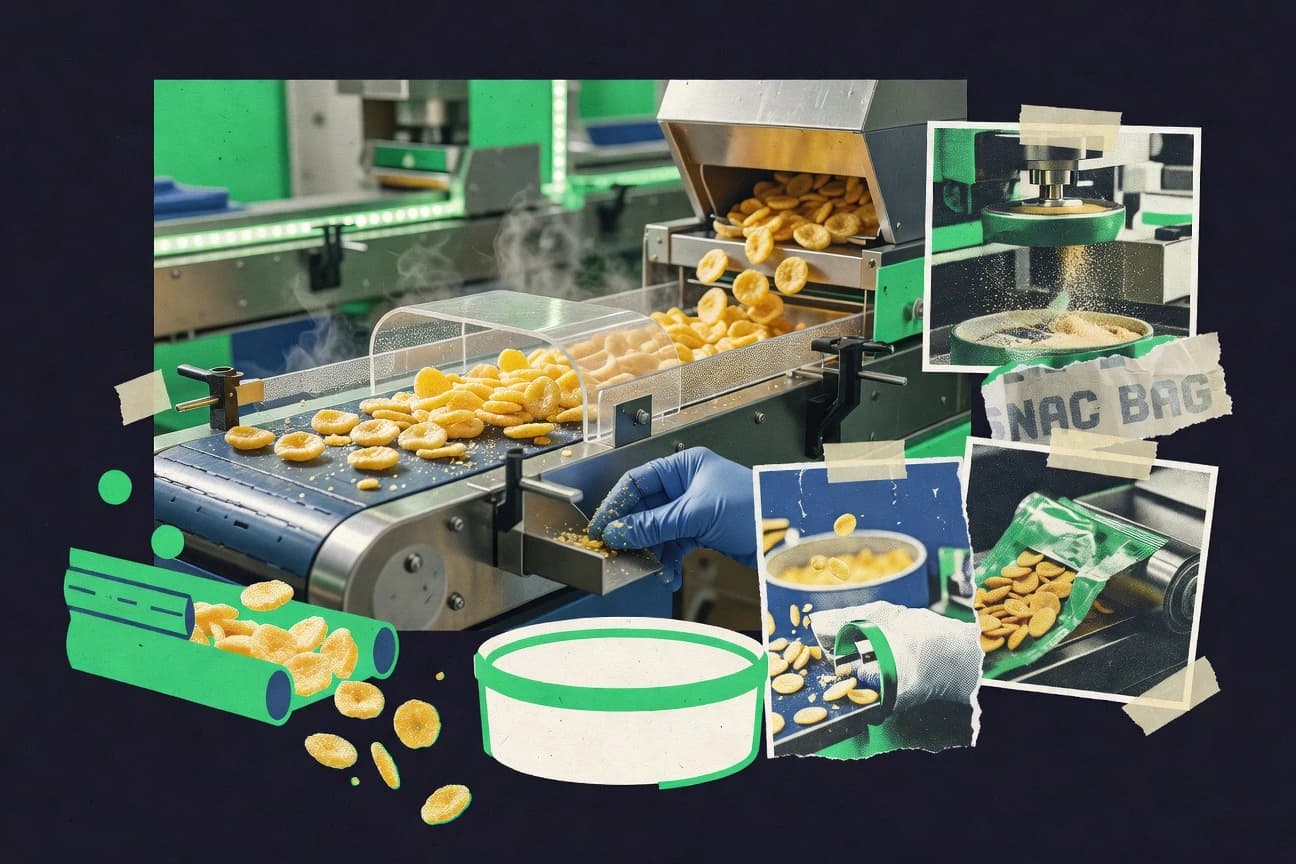
Snack Food Manufacturing Industry Statistics
With 3,000+ U.S. snack food manufacturing establishments spread across a highly fragmented base and sales up 2.8% year over year in 2024, the page pinpoints what is driving modest growth when ingredient and packaging costs keep swinging. It also connects demand signals like 61% of consumers reading ingredient lists to hard operational pressures including 2.6% higher producer prices, FDA inspections and warning letters, and the growing push for cybersecurity and better OEE, yield, and lower scrap.

Vegan Food Industry Statistics
In 2025, vegan food sales keep pulling ahead, while plant based categories shift fast enough to rewrite what “mainstream” means on shelves. Get the latest industry statistics that explain where demand is growing and what investors and brands are reacting to right now.
Food And Drink Industry Statistics
Better-for-you purchases and clean label claims are going mainstream with 41% of US consumers buying such products over the past year, but the bill for that shift comes from pressure on margins as wholesale food manufacturing inputs rose 8.1% year over year in 2022 and greenhouse gases remain closely tied to the food system at 6.8% of global emissions. This page maps how growth, regulation, energy, and traceability are reshaping food and drink retail, manufacturing, and packaging from RTD coffee revenue to EU safety and packaging targets.

Frozen Pizza Industry Statistics
The Frozen Pizza Industry is having a 2025 moment as volume and retail momentum reshape what buyers expect from quick dinners. See how category pricing, brand gains, and store demand moved in the same window to expose where growth is coming from and what is quietly losing appeal.

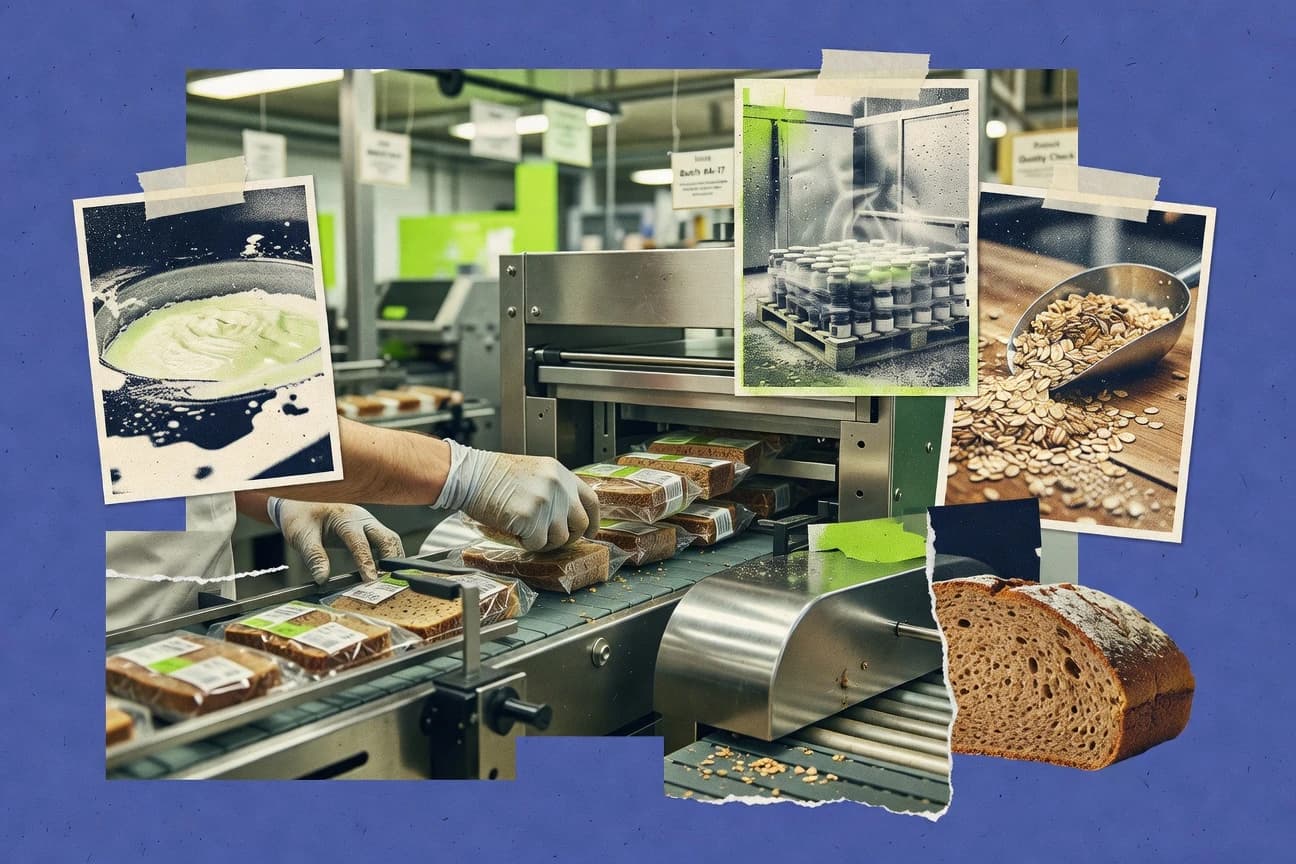
Pastry Industry Statistics
Frozen bakery products are projected to grow at a 4.2% CAGR from 2024 to 2032, but consumer expectations are moving faster than supply chains with 60% of global shoppers choosing bakery items based on freshness claims. Follow the page where premium formats hinge on a 31% jump in purchase likelihood for indulgent flavors and where cold chain targets of 2°C to 8°C can extend shelf-life up to 2x.

Cpg Snacks Industry Statistics
See how 2025 brings a sharper squeeze between rising consumer demand for convenient, flavorful snack choices and the cost pressure reshaping CPG snacks operations. The latest industry stats quantify what’s changing and where gains are actually showing up, not just where marketers hope they will.

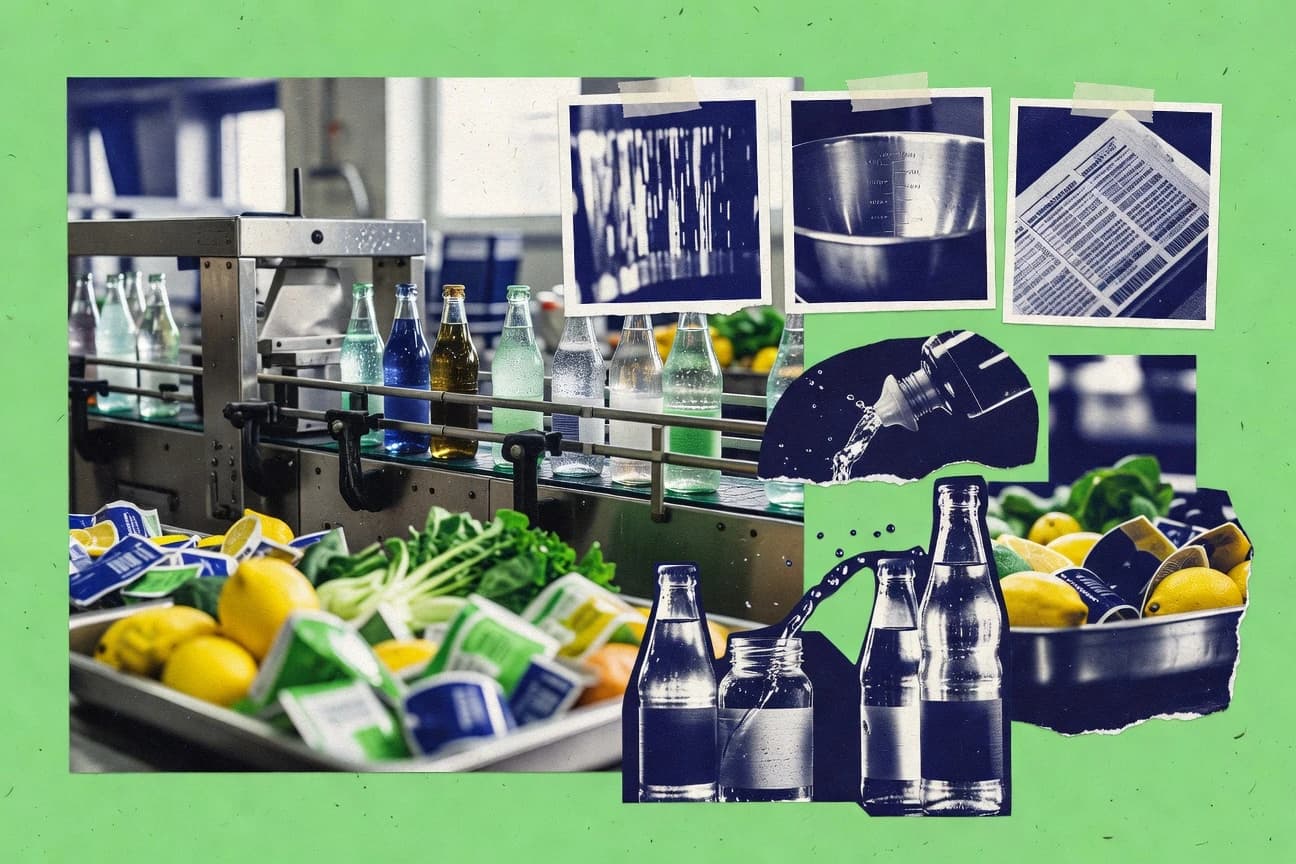
Fmcg Beverage Industry Statistics
FMCG beverage markets are set to keep climbing, from $3,146.1 billion projected global FMCG value by 2030 to faster optimization pressures like a 62% share of beverage manufacturers reporting forecasting trouble and higher cybersecurity stakes with a $27 billion global ransomware damage estimate for 2023. The page pairs category momentum such as 6.7% bottled water CAGR into 2030 with cost and sustainability friction like 23% of global greenhouse gas emissions tied to food systems and consumers who expect brands to cut environmental impact, so you can see where growth meets real-world constraints.
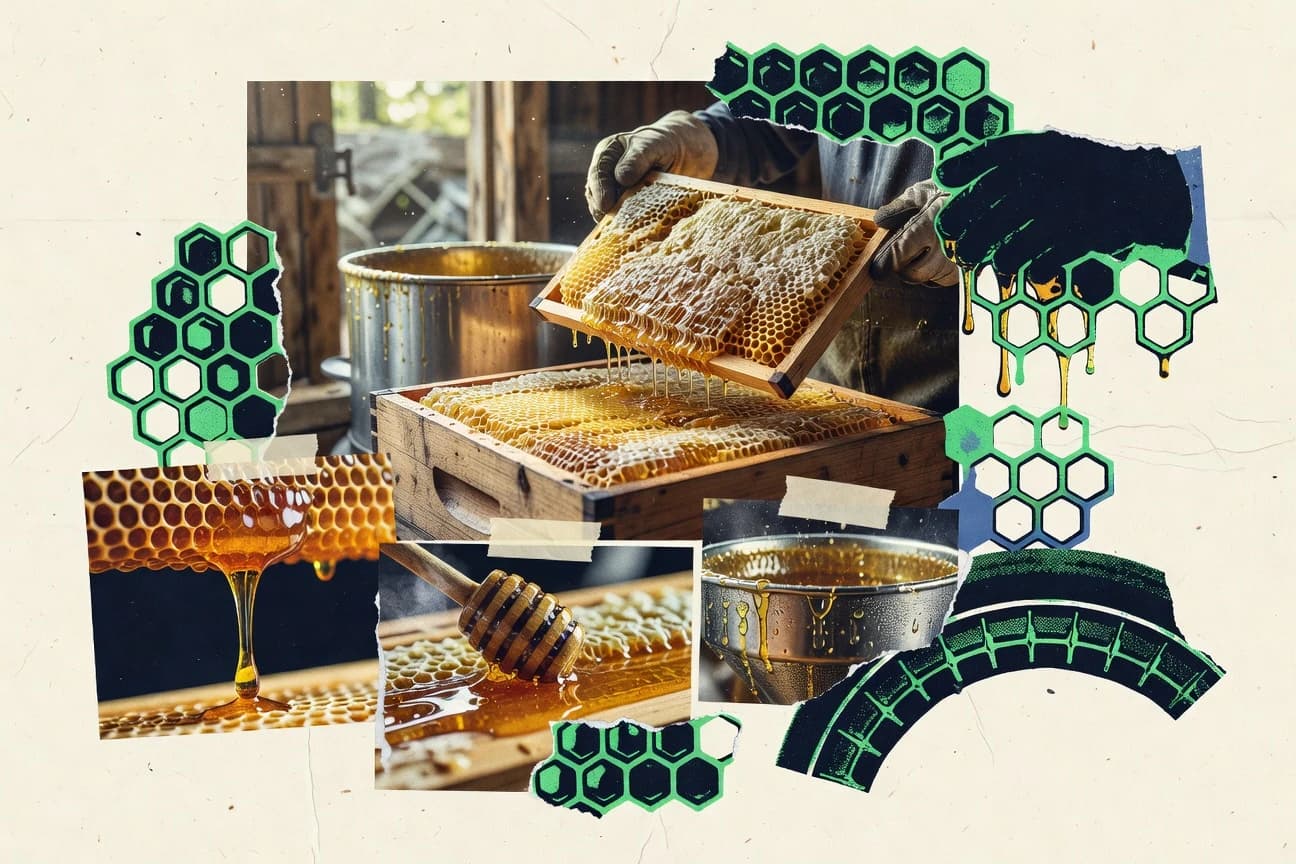
Honey Industry Statistics
Honey supply and quality are being reshaped by risk as EU worker losses tied to Varroa keep climbing alongside price swings and residue rules, while global trade and authenticity alarms sharpen at the same time. Expect fast takeaways like a €0.9 to €1.0 billion EU honey import slice, 10.4% honey market CAGR through 2030, and systematic review results showing 50% of tested honey products can carry sugar adulteration.

Non-Alcoholic Beverage Industry Statistics
Non-Alcoholic Beverage Industry statistics reveal how fast mainstream demand is shifting, with 2026 pointing to an even larger market footprint than the late 2025 baseline. The contrast is the point, because while beverage brands chase growth, the data shows where spending, flavors, and retail momentum are moving next.

Saudi Arabia Food Industry Statistics
Saudi Arabia’s food industry numbers for 2025 expose a market where supply and demand are moving in different directions, reshaping how companies plan capacity and sourcing. Get the latest signals on production, trade, and consumption so you can spot the opportunities behind the most current shift.

Sri Lanka Tea Industry Statistics
Sri Lanka tea is often sold for tradition and consistency, yet the latest trade and production figures for 2025 reveal where demand and output are actually shifting. Read these Sri Lanka Tea Industry statistics to see the tension between reputation and the numbers that are moving the market right now.

Greece Food Industry Statistics
Greek food is growing even as pressure mounts on costs, with food and non-alcoholic beverages inflation rising 10.4% in 2023 and energy intensity for food and drink manufacturers dropping 27% from 2019 to 2022. You will also see how Greece’s modern grocery reality is shifting, from private label at 4.8% share and e grocery at 6.2% to AI taking hold in just 3.5% of firms for demand forecasting.
Sweden Food Industry Statistics
With 26% of Swedish food sales turning organic in 2023 alongside high willingness to pay for sustainable products, Sweden Food Industry looks beyond labels to what people actually afford, including 6.5% unemployment and 6.5% of households reporting they go without meals. The same page tracks how modern the supply chain is, from 49% of enterprises using cloud services to 40% using EDI, while also weighing pressure and footprints like import dependence and shifting output, so you can see where progress meets cost.

Nutraceuticals Industry Statistics
With 2026 projections and recent survey results side by side, this Nutraceuticals Industry statistics page shows how fast consumer demand, regulatory pressure, and category performance are diverging rather than moving together. If you want to understand where growth is actually tightening and where it is accelerating, these year to year contrasts are the fastest way to get oriented.
Korean Food Industry Statistics
Korea’s food industry is still accelerating with a 9.0% CAGR forecast through 2030, while 85% coverage of food traceability facilities in 2023 and 65% of restaurants using QR ordering reveal how fast trust and convenience are being built at the same time. You will see where demand is growing and where pressure is rising, from KRW 17.3 trillion in exports and 49% health functional purchases to KRW 34.2 trillion in imported inputs and food inflation averaging 3.6%.

South Africa Food Industry Statistics
South Africa’s food industry is moving faster than the headline numbers suggest, with 2026 market momentum sitting alongside shifting production, trade, and consumer demand signals. Read the key statistics side by side to see where growth is strengthening and where pressure is quietly building.

Ukraine Food Industry Statistics
Ukraine Food Industry statistics reveal how the sector’s energy, employment, and production pressures are reshaping the balance of what gets made and where, with 2026 figures pointing to new momentum rather than a steady retreat. If you want to understand why some segments are holding up while others are being forced to pivot, this snapshot of the latest indicators is where the tension becomes clear.

Espresso Industry Statistics
Espresso Industry’s statistics track how quickly key forces are shifting and why that matters for makers, roasters, and retailers in 2025. Expect standout contrasts between supply, pricing pressure, and demand signals that explain what changed and what it means next.

Probiotics Industry Statistics
See how 2026’s shift in probiotic demand and market momentum reframes what matters most to manufacturers, from strain performance to regulatory pressure. The page puts the latest figures side by side with the economic and clinical signals that are quietly reshaping category growth.