GITNUX MARKETDATA
Browse Our Category
Food Nutrition
Latest update:


Pineapple On Pizza Statistics
While 80% of Swedes accept pineapple on pizza as a cultural mainstay, 59% of people worldwide still hate it, turning a simple topping into a global argument. This page maps how Hawaiian pizza went from Sam Panopoulos’s 1962 canned pineapple experiment to today’s market impact, with country by country shares and the loudest pro and anti camps.

Seasoning Industry Statistics
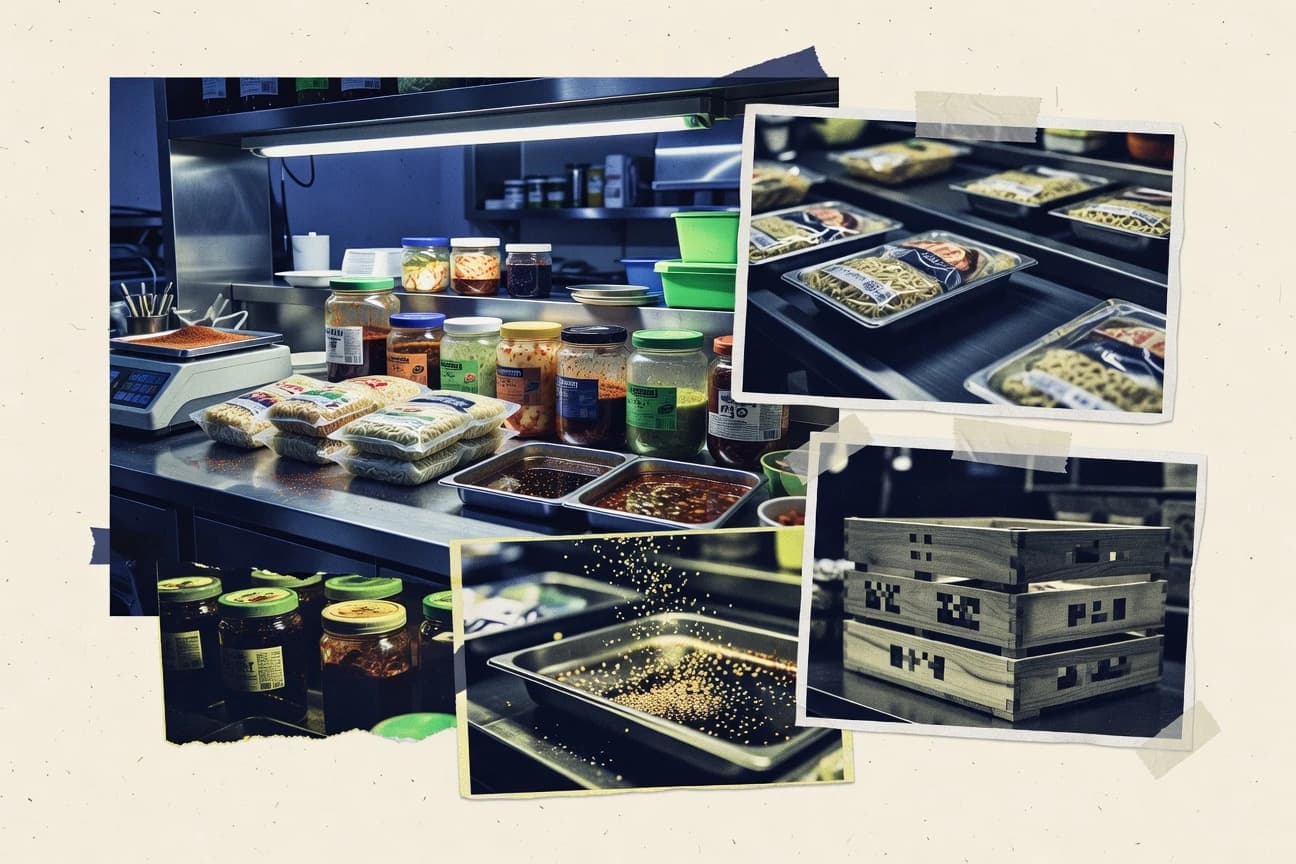
Global seasoning ingredients are forecast to grow at a 2.3% CAGR through 2030, but the real story is the tightening squeeze on processors as lower-sodium demand jumps to 48% of U.S. consumers and EU energy and packaging costs rise alongside strict safety and traceability rules. From the $36.5 billion flavor and fragrance ingredients market to the 1,000 plus FDA pathogen related recalls in 2022, the page connects ingredient demand, process efficiency targets, and compliance realities that shape what gets ground, blended, and bottled.

Ingredients Industry Statistics
Ingredient demand is getting pulled by cleaner, lower sugar and label-ready choices, from 45% of consumers favoring natural ingredients to 68% now seeking low sugar beverage options, all while clean label transparent ingredients surged 25% sales in 2023. Global market momentum matches the recipe shifts too, with the food ingredients market reaching USD 218.5 billion in 2023 and the clean label and functional health signals behind probiotics, low carb, and plant based growth.

Ice Industry Statistics
U.S. per capita ice use reached 38 pounds in 2023 while global average is just 8.2 kg, highlighting how hot climates and foodservice demand pull consumption in very different directions. From China retail ice growth to 5.2 million tons in 2023 and Japan’s CO2 refrigeration cutting emissions by 22% to pressure points like 1.2 million tons of CO2 equivalent from U.S. ice plants and 450,000 tons of packaging plastic waste worldwide, this page ties what people buy to how the industry powers, cools, and pollutes.

Espresso Coffee Industry Statistics
Finland leads global per capita espresso consumption with 4.5 kg a year while U.S. demand jumped 10% to 50 billion espresso based drinks in 2023, turning the market into a telltale competition between cafés and at home routines. From 65% of Europeans choosing espresso over drip to smart espresso makers shipping 12 million units and carbon neutral initiatives drawing $500 million, this page tracks the forces behind how people drink espresso and why they switch.

Taiwan Food And Beverage Industry Statistics
See how Taiwan’s food and beverage demand is being reshaped as 37.5% of the population sits in the 25 to 44 prime purchase band, while online channels keep pushing growth with e commerce reaching TWD 6.4 trillion in 2023 and internet penetration hitting 86% in 2024. From rising CPI pressure on food and beverages to a food self sufficiency index of 32% and export demand of USD 2.3 billion in prepared beverages, this page connects the consumer, pricing, and supply chain forces behind what Taiwanese shoppers buy and order.

Uk Supplements Industry Statistics
Online supplement shopping is pulling at the edges of everyday UK routines, with 35% of adults aged 25 to 44 buying online in 2023 and protein powders holding 42% of sales by product type in 2023. From London’s 22% share of sales volume to regulatory pressure including 47 FSA warnings in 2023 and the market’s £618 million value, this page stitches together what people take and what is changing behind the shelves.

Philippines Coffee Industry Statistics
Retail instant still takes 65% of market share, yet ready to drink coffee has surged to 20 million liters and coffee shop outlets now reach 5,000 nationwide in 2023. Follow how 1.8 kg per capita consumption and a 40% jump in e commerce spending sit alongside Robusta dominance and smallholder realities, including 1.5 million farmers directly employed by the sector.

Japan Tea Industry Statistics
Japan’s tea runs on scale and precision at once, with green tea productivity averaging about 540 kg per hectare and 45,000 hectares under cultivation, yet the farm base stays highly fragmented with over 300,000 tea-farming households and 0.0% tea products in the national food self sufficiency rate. Get the practical supply chain and product reality too, from a 6.1% rise in the retail tea price index to 8.6% of chilled tea sales now coming from cold brew, plus what this means for pricing, processing standards, and quality control.

Functional Beverage Industry Statistics
Functional beverages are projected to grow at a 7.8% CAGR from 2024 to 2032 even as consumers buy them monthly, with 26% using them at least once a month in 2023 and 40% turning to functional formats for energy or alertness. Expect the strongest pull to come from specific subcategories and proof points, from functional water at $1.88 billion in 2023 to clinical evidence that probiotics can improve stool frequency, alongside tightening EU claim rules that make substantiation non negotiable.

Cpg Food And Beverage Industry Statistics
The global packaged food and beverage market is forecast to grow at a 3.9% CAGR from 2024 to 2030, even as labor costs remain a top constraint for 65% of executives and shipping inputs swing with a 3.9% year over year rise in transportation services PPI in 2024. This page connects the pressure points behind everyday CPG decisions, from functional beverages and automation adoption to food safety recalls and food loss, so you can spot what is likely to drive performance next.

Energy Drinks Statistics
Energy drink use is rising fast, with Asia Pacific forecast to be the fastest growing region from 2024 to 2030, while health signals are getting louder too, including a meta analysis linking consumption to higher cardiovascular related adverse event risk. You can also see the policy and cost pressures shaping what ends up on shelves, from EU caffeine labeling thresholds capped at 32 mg per 100 ml to US poison center calls at 10,xxx per year and the regulatory enforcement tensions behind how these drinks are marketed and priced.

Czech Food Industry Statistics
Czech food and agricultural exports reached CZK 2.9 billion in 2023 while the sector delivered CZK 1.7 trillion in value added, yet profit and stability are still under pressure as 39% of manufacturers cite supply uncertainty. From a 22% cut in energy intensity and 12.7% renewables share to 48% of firms issuing sustainability reporting and ISO 22000 certification at just 2.1%, the page shows how fast operational priorities and compliance are changing across Czech food production.

Coffee Statistics
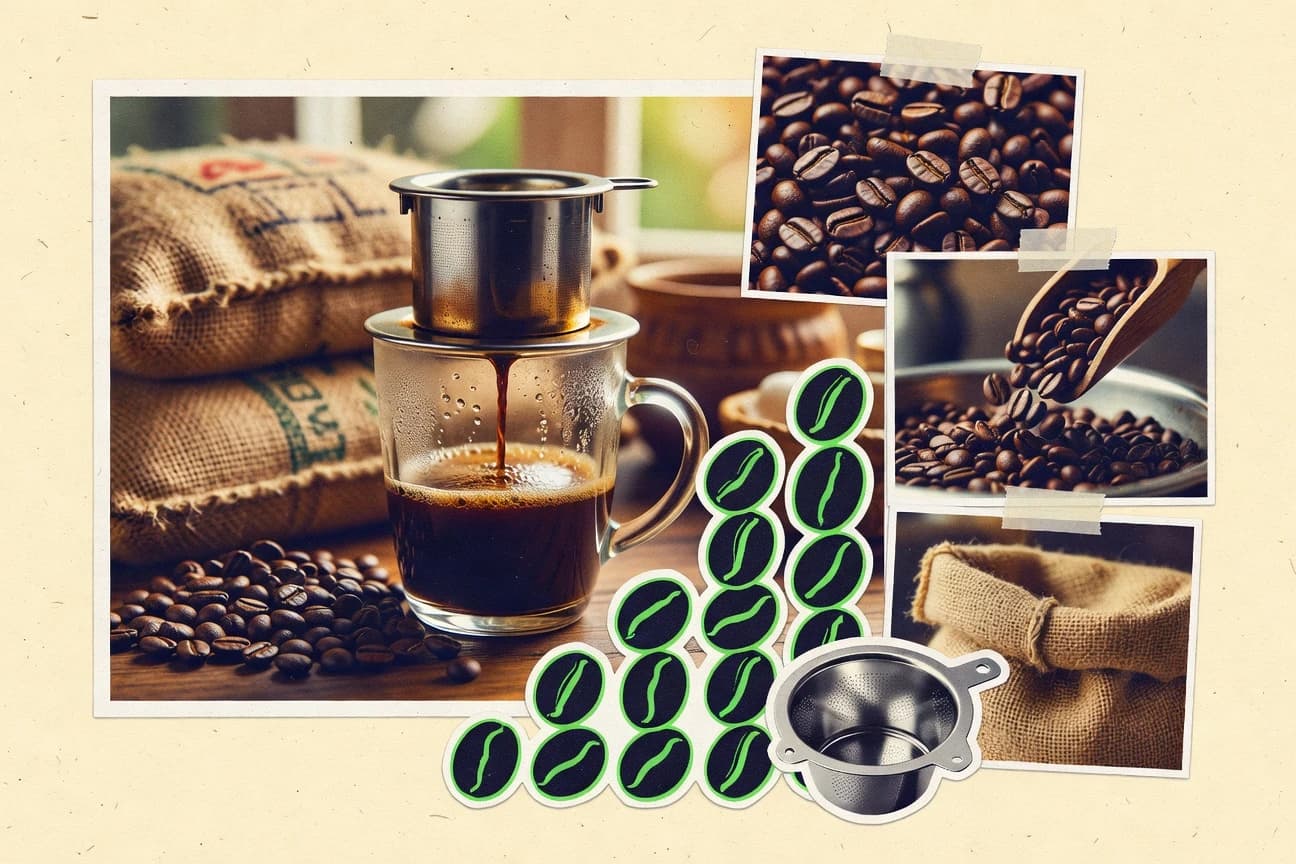
Finland sets the pace at 12.54 kg of coffee per person yearly while the US sits at 4.2 kg, and the gap becomes even sharper when you see Europe at 52.5 million 60 kg bags versus instant coffee taking 25% of global consumption. Follow the trail from coffee shop life, with over 30,000 Starbucks stores serving 4 billion customers yearly, to global supply and prices, including 10.5 million tons traded in 2022 and an ICO composite price averaging 160.95 US cents per lb.

Baking Industry Statistics
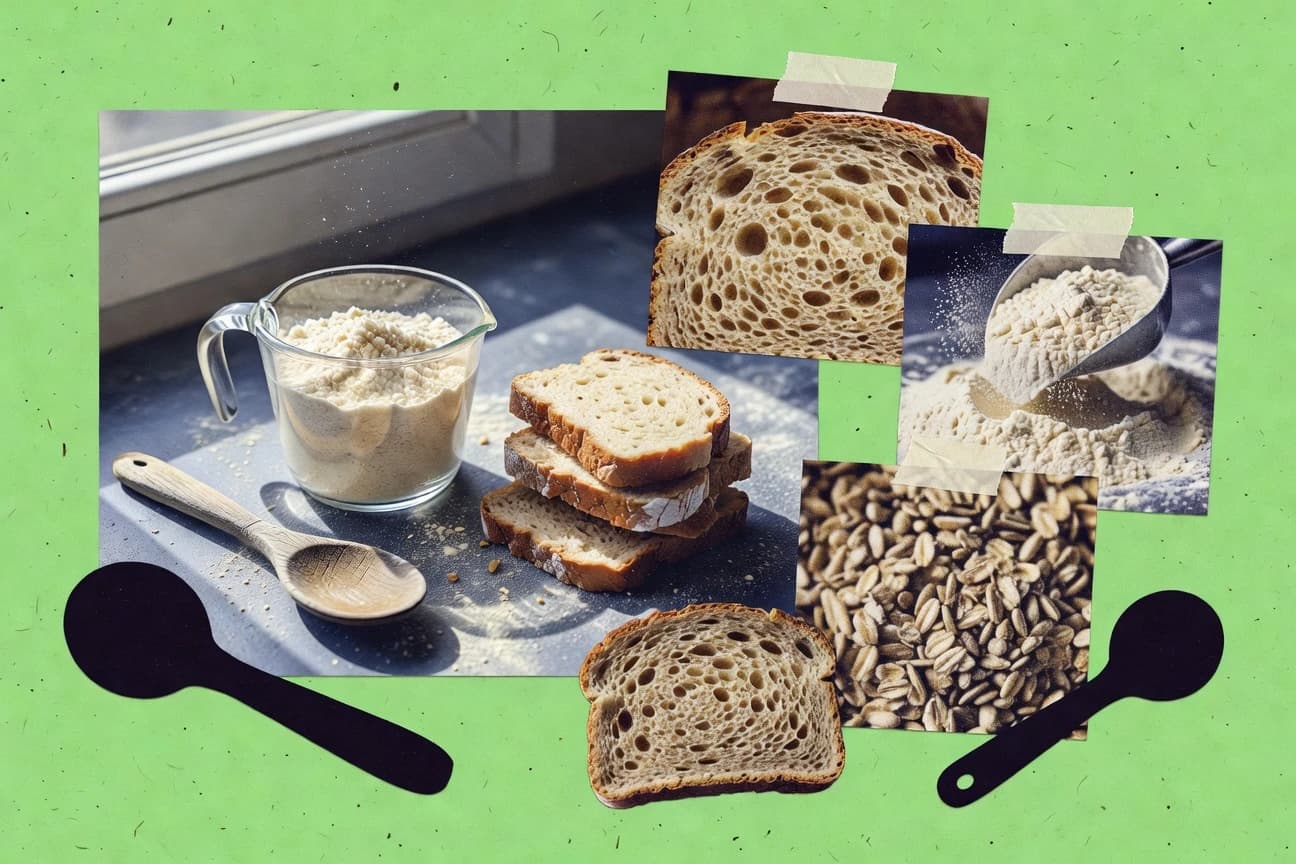
Bakery demand, costs, and climate pressure are moving at the same time, with global bakery products forecast to grow at a 5.5% CAGR from 2024 to 2030 while wheat and energy remain stubbornly central to the economics of every loaf. From EU bread waste at 3.0 million tonnes in 2020 to 12% HVAC energy efficiency upgrades and 34% of EU food producers using renewable electricity in 2022, these figures connect supply chain emissions, gluten-free demand, and production realities in a way that matters to operators.

Flour Milling Industry Statistics
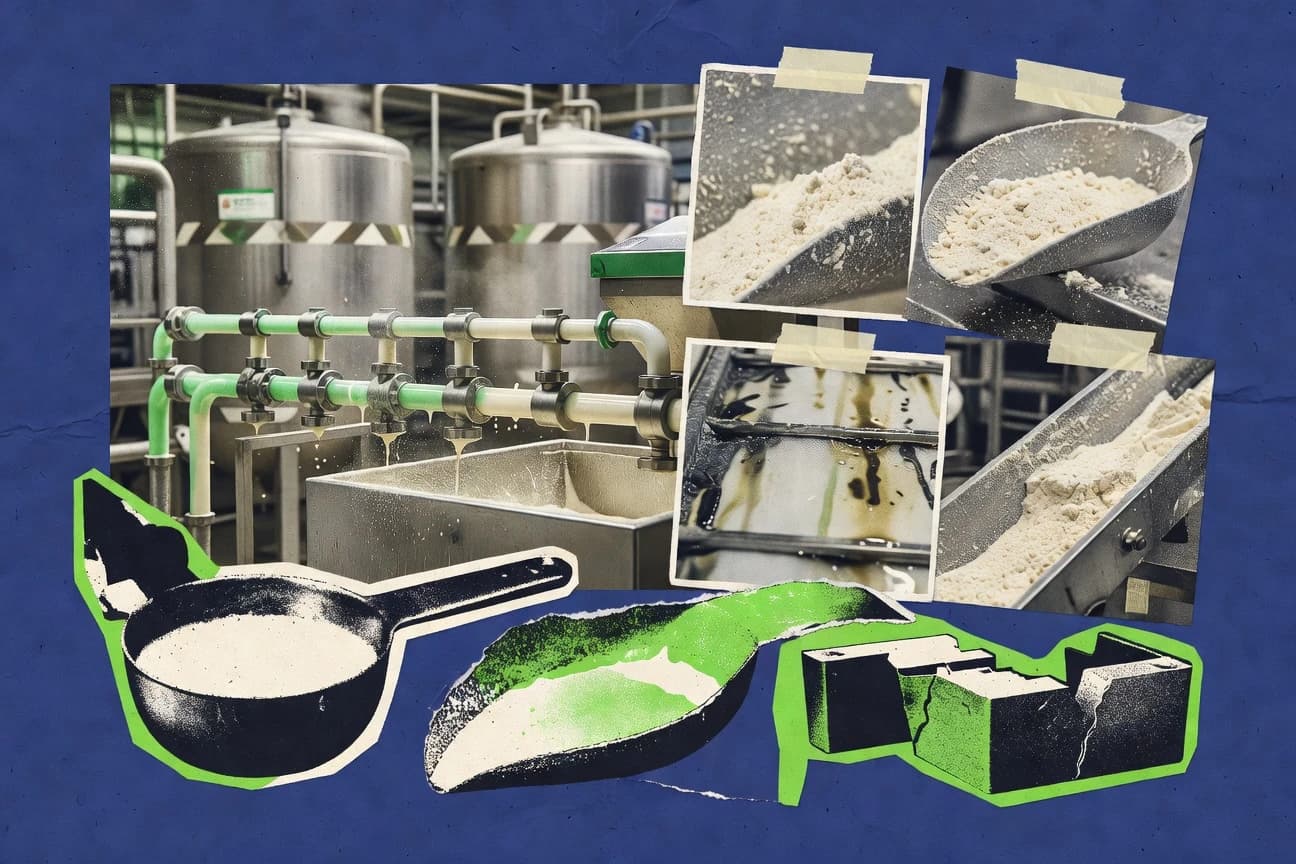
Automation is reshaping labor and output, with US flour milling employment falling to 16,500 workers in 2023 while EU mills still rely on an aging skilled workforce and rising energy costs squeeze margins. You will also see how global scale compares, from 2.5 million direct jobs worldwide and an export push that lifted market size to $200.5 billion in 2023, to region by region workplace risks, wages, emissions cuts, and capacity gains.

Consumer Goods Food Industry Statistics
Convenience is still winning, with 45% of global consumers prioritizing convenience foods and pushing 2023 market growth to 5.5% while shoppers simultaneously demand plant based, sustainable packaging, and clean labels. This page puts the tension side by side, from 62% of U.S. millennials going plant based weekly to 78% of Europeans insisting on sustainable packaging, plus the operational ripple in retail and foodservice from e commerce growth to blockbuster functional and snack demand.

Olive Oil Industry Statistics
Olive oil is expanding fast at a 3.5% global CAGR through 2032, yet drought and heat can cut yields by 20% to 50% when water runs scarce, reshaping everything from export volumes to price signals. This page puts fresh trade, pricing, regulation, and health research together, including Spain’s 2.0 million tonnes of 2022 exports and EU and US labeling rules that determine what counts as extra virgin.

Italian Food Industry Statistics
Italy’s food export momentum stays strikingly strong, reaching €7.2 billion in 2023 alongside record-value wins like €2.8 billion in pasta and €1.6 billion in mozzarella and cheeses, while consumer pressure is reshaping demand as 53% switch to private label when prices rise and 18% cut portion sizes to cope with inflation. The page also tracks the production and compliance mechanics behind the brands, from 1.7 million tonnes of tomatoes and €1.3 billion of olive oil to a tech gap where only 13.7% use big data analytics and 45.0% still rely on basic e invoicing.

Ingredient Industry Statistics
From a $278.1 billion global food ingredients market to a 27% slice of the supply chain exposed to foodborne pathogens each year, this page connects ingredient economics, safety, and regulation in one place. It also spotlights fast-moving drivers like 8.6% forecast CAGR for plant protein ingredients during 2024 to 2032, 2.5 times higher plant protein demand since 2013 to 2022, and why traceability and allergen control are now treated as core manufacturing capabilities, not paperwork.