Market data
Environmental & Ecological
Explore environmental & ecological statistics and market research reports with sourced data and trend analysis.
Latest update:
 Claire Beaumont

Statistics · 2026
Litter Statistics
Plastic litter can take up to 450 years to decompose—see how it burdens communities, ecosystems, and budgets.
Statistics · 2026
Plastic Water Bottle Statistics
PET bottles can leach antimony up to 10x above WHO limits after 30 days at 22°C—then persist as microplastics.
Statistics · 2026
Endangered Animals Statistics
Yangtze giant softshell turtles are down to only 4 known individuals worldwide—3 in captivity and 1 wild. Explore what threatens them now.
Statistics · 2026
Plastic Bag Pollution Statistics
Plastic bags kill 100,000 marine mammals every year through ingestion or entanglement—find the key stats on the damage.

Statistics · 2026
Ocean Acidification Statistics
Oceans are about 0.1 pH units more acidic since pre-industrial times—down from 8.2 to 8.1. Here’s what that means for marine life.

Statistics · 2026
Bee Decline Statistics
Urbanization cut wild bee diversity by 50% in the U.S. Midwest—see how shrinking habitats and added stressors drive bee decline and what to do next.
Statistics · 2026
Shark Finning Statistics
See how Hong Kong cut shark fin consumption by 50% since 2014 while CITES protections expanded in 2023 to cover three more shark species and WWF helped establish 50 shark sanctuaries across 20 million sq km by 2023. Then contrast these policy wins with the persistent reality of finning, including illegal trade worth $1 to $2 billion annually and annual killing on the scale of tens of millions of sharks for their fins.

Statistics · 2026
Packaging Waste Statistics
Packaging waste policy is getting sharper just as public pressure grows, with EU landfill diversion now set to fall to 10% by 2035 and EU consumers reporting 55% concern about plastic waste in the 2019 Eurobarometer. But the gap between recycling promises and plastic reality is stark, since only 1 in 5 plastic bottles is recycled in Europe and EU packaging waste generated stands at 173.5 kg per person, making the page a practical snapshot of what is changing and what still is not.
Statistics · 2026
Overfishing Statistics
FAO’s most recent assessment says 33% of global fish stocks are overfished, a scale of overcapacity and overfishing pressure that is keeping many fisheries from rebuilding. The page connects how “fishing down the food web” lowers trophic levels, shows where declines are already severe, and quantifies what policy changes like cutting harmful subsidies and tightening enforcement could return for stocks, seafood supply, and profits.
Statistics · 2026
Environmental Awareness Statistics
Climate concern is no longer a niche topic with 61% of US consumers naming climate change a top priority and 42% of people in the US taking practical steps like using reusable bags most of the time. Yet the gap between awareness and action still shows up, from 32% of US household recycling to 48% of EU respondents changing purchases recently, making this page a useful reality check on where engagement is strengthening and where it stalls.
Statistics · 2026
Land Pollution Statistics
From 1.9 billion tons of US manure driving nutrient runoff across 40% of cropland to China’s 16% contaminated soil reducing yields by 10%, land pollution is not an abstract threat it is measured on fields and food chains. See how burning 1.3 billion tons of crop residues worldwide and heavy metals spanning 16 million km² collide with Superfund and remediation budgets over $1 trillion a year, with municipal waste already pushing landfilled emissions to 5% of the global total.

Statistics · 2026
Poaching In Africa Statistics
Elephants are still being killed at an average pace of 31,000+ per year in the late 2010s, yet the page pinpoints what makes poaching worse and what actually shrinks it, from where enforcement gaps open and cost protected areas $150–$250 million annually to why more patrol days and better ranger support can cut losses by measurable margins. You also get hard logistics and forensics, including how 1 in 5 major seizures looks linked to poached wildlife, what it costs to intercept shipments on a key corridor, and how DNA, drones, and community patrols change the odds for traffickers.
Statistics · 2026
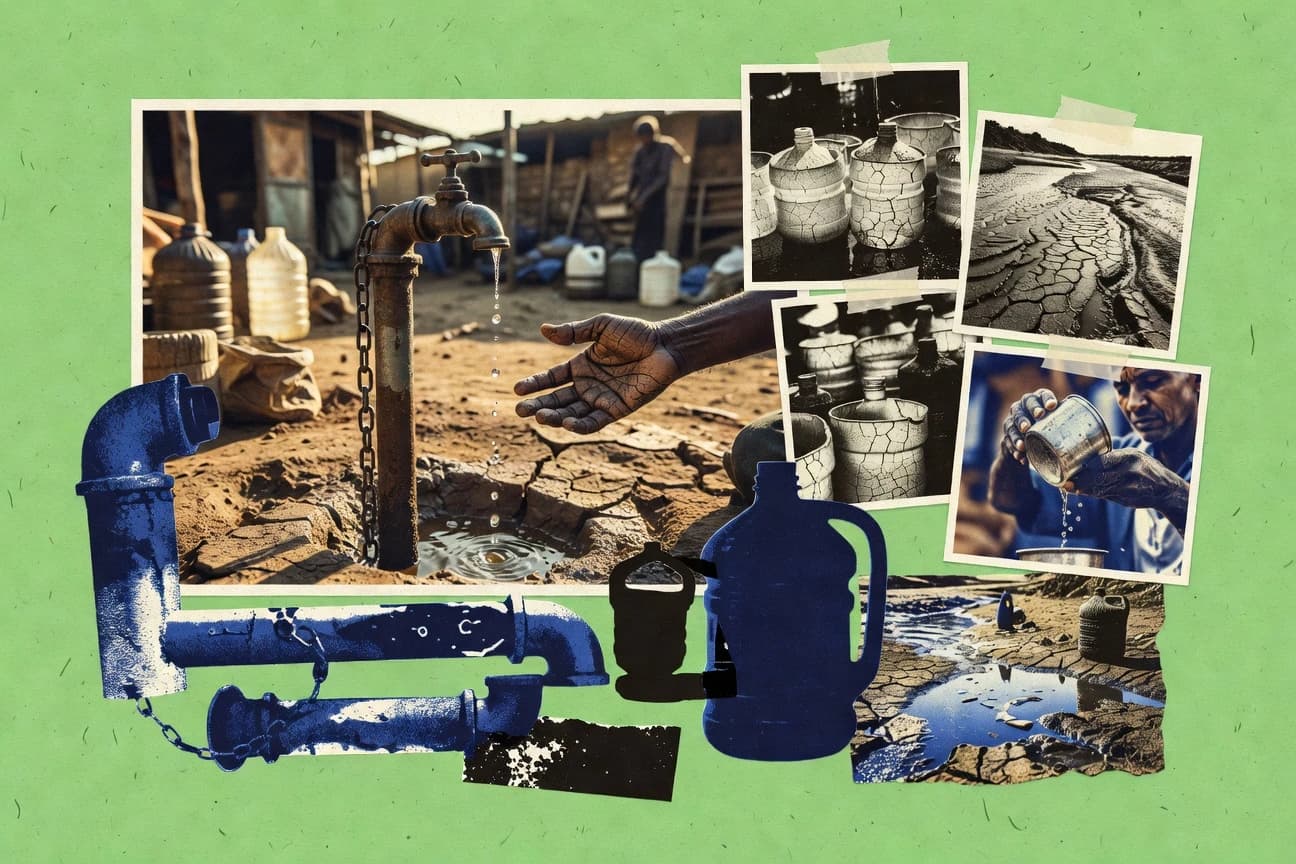
Global Water Crisis Statistics
Even when the world has clean water on paper, millions are still shut out of basic safety. This page pairs 2020 figures like 785 million people lacking basic drinking water and 23% living in water stressed countries with the cost side of the crisis so you can see how shortages, flooding risk, and untreated wastewater translate into health, schools, and economies.

Statistics · 2026
Gas Emissions Statistics
Methane cuts can reach a 70% reduction for coal mine VAM when oxidation systems perform as quantified by the IPCC, yet the emissions race still shows a projected 2.9 GtCO₂e gap in the pathways needed for 2°C. Follow how CO₂ still dominates at 54% of 2019 greenhouse gas emissions, while agriculture accounts for 29% of methane, and see what MRV, monitoring, and targeted investments are buying in real abatement.
Statistics · 2026
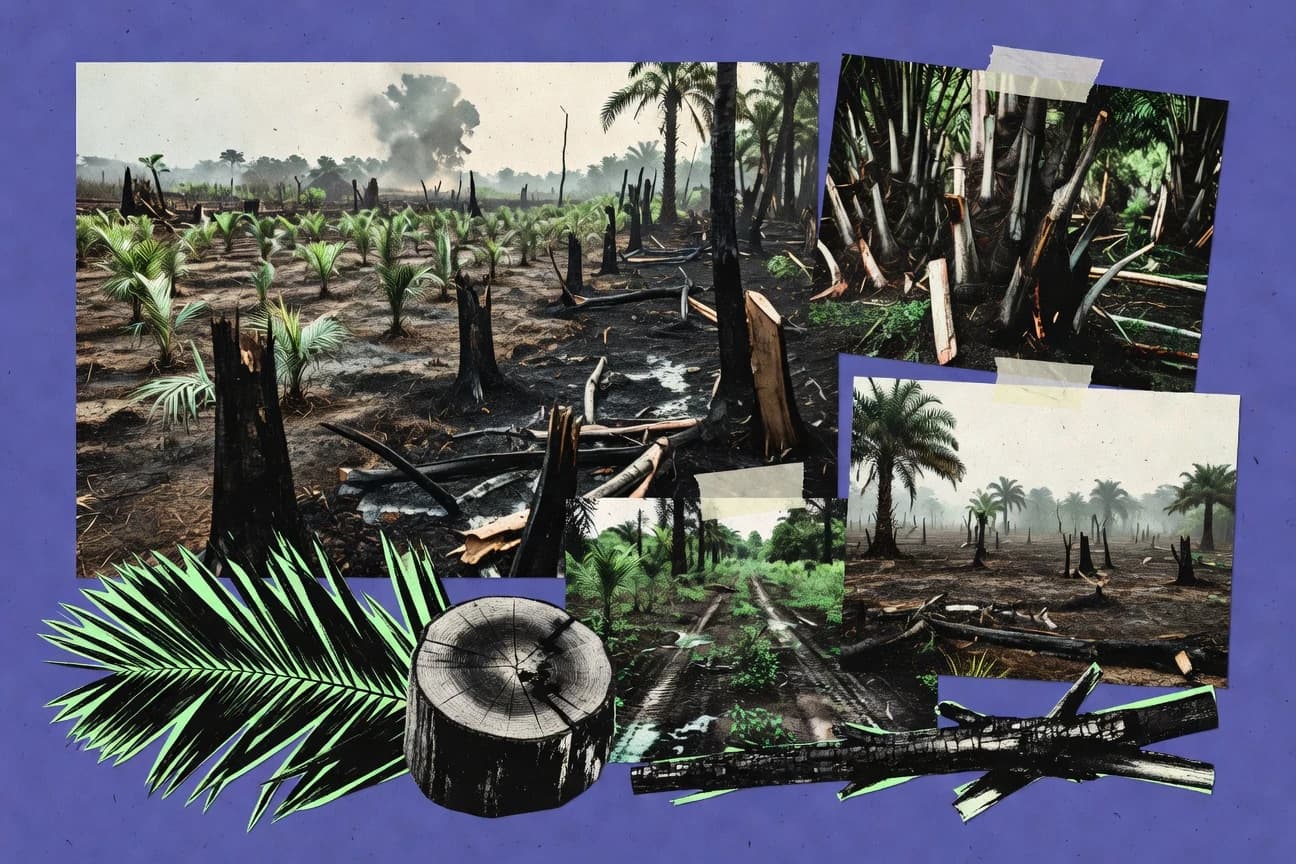
Palm Oil Deforestation Statistics
Oil palm growth keeps reshaping forests and peat, with 2019 showing 86% of new Brazilian Amazon expansion concentrated in deforestation hotspots and 31% of impacts driven by indirect land use change. Track how commitments, certification, and rising biodiesel demand collide with measurable habitat and carbon pressure, from Malaysia and Indonesia’s 8,000 km² forest conversion to peat disturbance across Indonesia’s millions of hectares.
Statistics · 2026
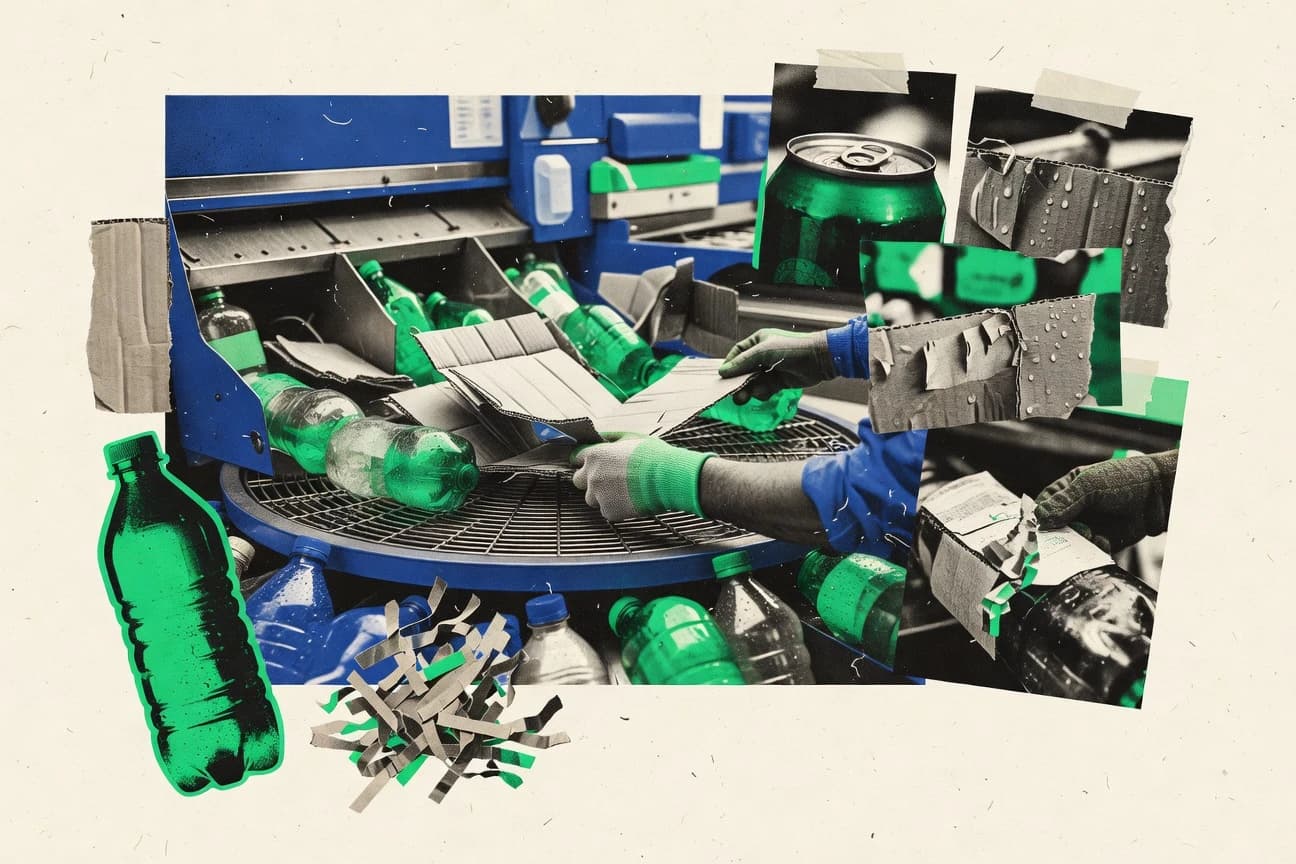
Recycling Statistics
Even with packaging directives pushing higher targets, only 5.6% of U.S. plastics waste was recovered in 2019, while the EU reached a 46.6% municipal waste recycling rate in 2022 and some packaging streams hit 89% in 2022. This page tracks what gets recycled across plastics, paper, glass, and steel and ties it to climate impact, funding, and market growth so you can see why recovery rates matter far beyond the bin.

Statistics · 2026
Lotus Statistics
See why 57% of organizations reported a critical spreadsheet error in the last 12 months while spreadsheet and collaboration spend keeps accelerating toward cloud and governance driven automation, including a forecast USD 15.3 billion global spend in 2026 and 45% of enterprise software shifting to cloud delivery by 2025. The page ties spreadsheet risk, data breach costs up to USD 4.71 million on average, and governance behaviors like 58% adopting data governance into clear takeaways for anyone trying to protect shared work without slowing teams.

Statistics · 2026
Cats Killing Birds Statistics
From 1.3 to 4.0 billion birds killed each year by free ranging domestic cats in the US, including feral cats that make up 69% of the 2.4 billion annual total, the page lays out how everyday pet behavior can collide with population declines and local extinctions. You will see country by country figures including Australia’s over 365 million per year and the UK’s roughly 27 million annually, and how species such as house sparrows and kiwi chicks pay the price.

Statistics · 2026
China Air Pollution Statistics
What explains China’s shift from worsening fine particle pollution toward stronger control is laid out with up to date signal points, from about 86.0% good air days and roughly 36,000 ground monitoring stations to an estimated 27% of global PM2.5 related premature deaths tied to East Asia including China. You get the policy and industry levers behind the change, including power sector near universal ultra low emission upgrades and fast VOC and smog response mechanisms that reshape exposure in measurable ways.

Statistics · 2026
Water Pollution Statistics
Water pollution kills millions each year and drives treatment and energy burdens that rarely get counted, from 5.5 million deaths tied to unsafe water, sanitation, and hygiene to an estimated 2,000 to 3,000 TWh per year needed to keep water and wastewater services running. This page connects nutrient dumps, toxic industrial effluent, and hypoxic dead zones to what modern treatment can realistically achieve, from membrane bioreactors and reverse osmosis to advanced oxidation and nutrient removal systems.