Market data
Environmental Ecological
Explore environmental ecological statistics and market research reports with sourced data and trend analysis.
Latest update:
 Claire Beaumont

Statistics · 2026
Ecological Statistics
Over 1 million species are threatened with extinction—many within decades—according to IPBES 2019; see which ecosystems are most at risk.

Statistics · 2026
Water Wastewater Industry Statistics
Untreated wastewater pollutes 80% of rivers worldwide and contributes to 1.8 million annual deaths—see the latest Water Wastewater Industry stats on solutions and trends.
Statistics · 2026
Elephant Poaching Statistics
Poaching kills about 20,000 African elephants for ivory each year—can stronger patrols and tougher enforcement change the outlook? Explore the latest data.
Statistics · 2026
Drought Statistics
El Niño can raise drought risk by 50% in tropical regions—see how this amplifies water stress and what mitigation looks like.
Statistics · 2026
Deforestation Statistics
Tropical deforestation raises extinction risk for 18–30% of species—see how clearing turns habitat loss into population collapse.

Statistics · 2026
Poaching Statistics
Poaching causes 30% of megafauna extinctions since 1500—while 35,000 wild animals are poached daily. Explore the evidence.

Statistics · 2026
Light Pollution Statistics
Bright European skies can be 10,000 times brighter than natural darkness—see why light pollution is so hard to escape and what it impacts.
Statistics · 2026
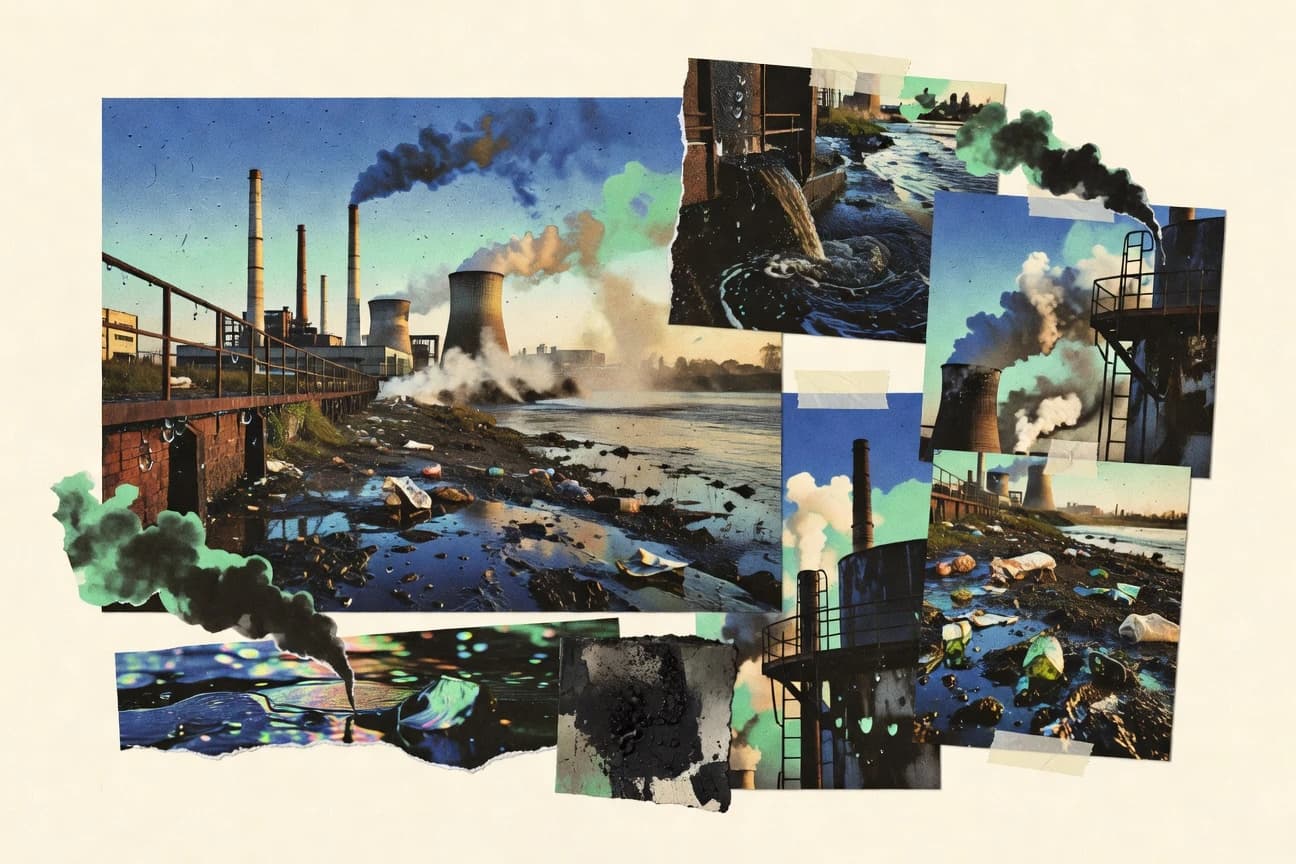
Factory Pollution Statistics
8.7 million premature deaths a year are linked to factory air pollution—find the biggest sources, impacts, and costs.
Statistics · 2026
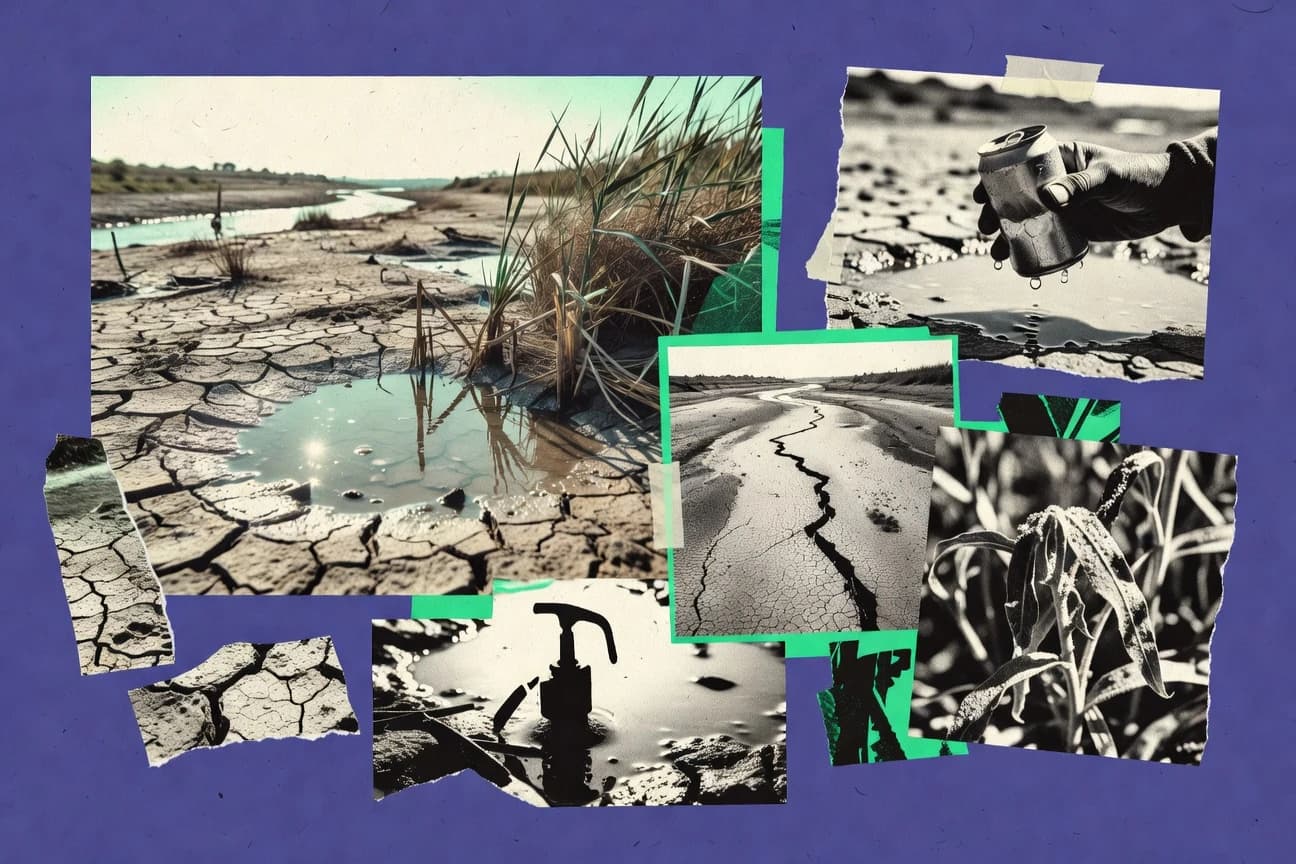
Global Water Scarcity Statistics
Agriculture accounts for 70% of global freshwater withdrawals—see how scarcity tightens in irrigated areas and what it means next.
Statistics · 2026
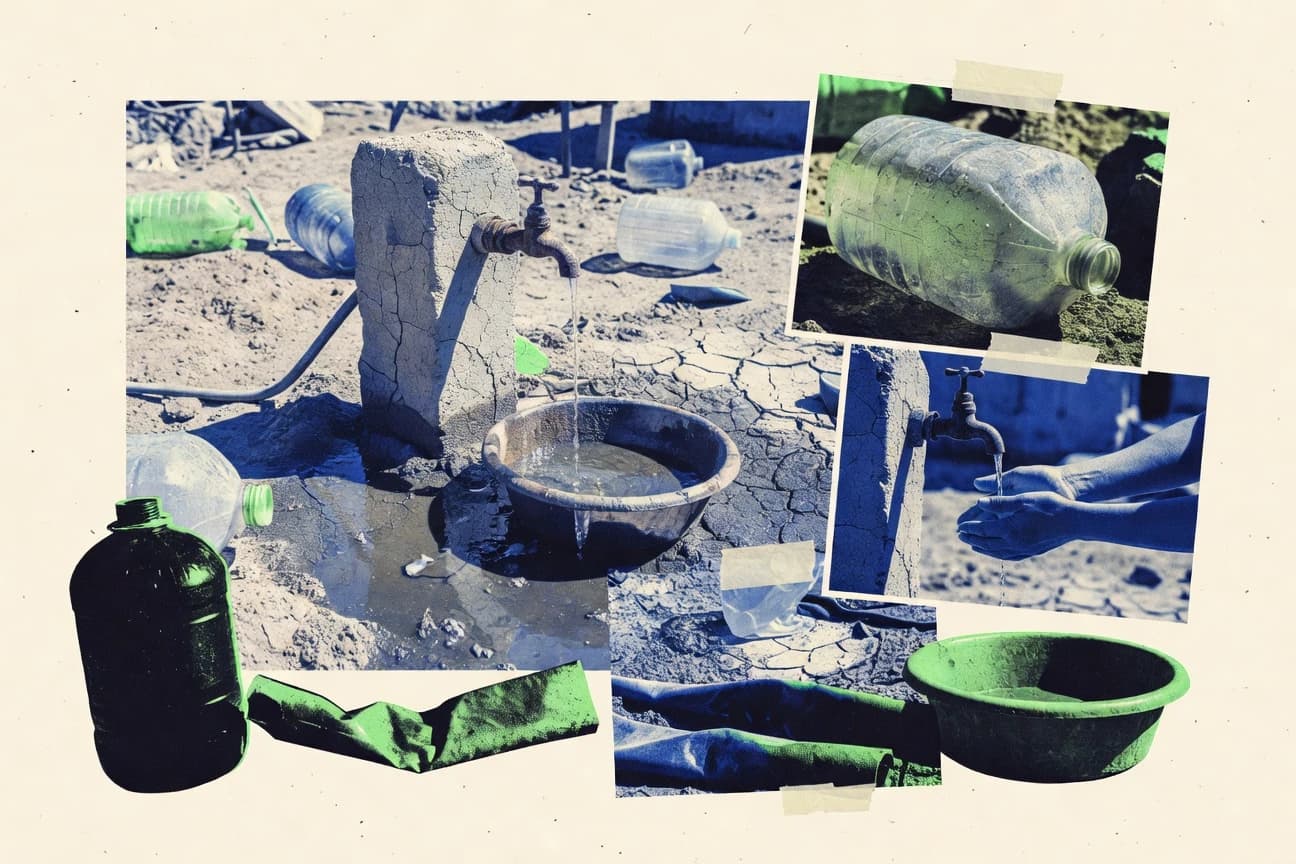
Water Crisis Statistics
Over 1 in 4 people lack safe water—2.2 billion worldwide still miss safely managed drinking services; see where the crisis hits hardest and why.
Statistics · 2026
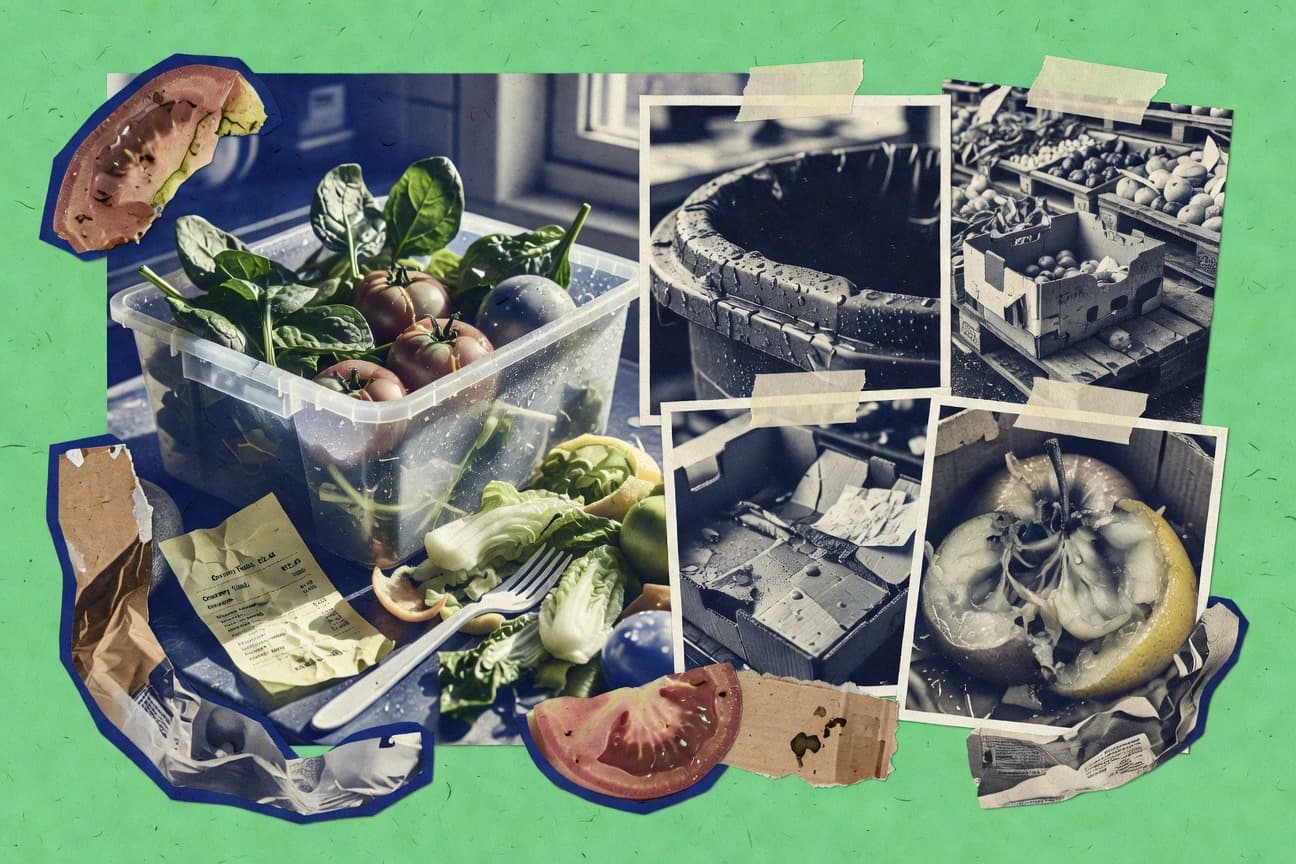
Global Food Waste Statistics
Food waste creates 8–10% of global GHG emissions—about 3.3 billion tonnes CO2e each year. Here’s where it happens and why it matters.

Statistics · 2026
Office Paper Consumption Statistics

Statistics · 2026
Microplastic Statistics

Statistics · 2026
Cell Phone Recycling Statistics

Statistics · 2026
Soil Pollution Statistics
Statistics · 2026
Grocery Store Food Waste Statistics
Overstocking accounts for 39% of supermarket food waste—yet smarter inventory can prevent it. Explore the causes and fixes.

Statistics · 2026
Water Technology Industry Statistics
Venture capital poured USD 2.8B into water tech startups in 2023—up 15% from 2022. Here’s what that momentum signals for the industry.
Statistics · 2026
Co2 Emissions Statistics
Global CO2 from fossil fuels and cement hit a record 37.4 GtCO2 in 2023—see what’s driving the rise and where it’s headed.

Statistics · 2026
Litter Statistics
Plastic litter can take up to 450 years to decompose—see how it burdens communities, ecosystems, and budgets.
Statistics · 2026
Plastic Water Bottle Statistics
PET bottles can leach antimony up to 10x above WHO limits after 30 days at 22°C—then persist as microplastics.