GITNUX MARKETDATA
Browse Our Category
Environment Energy
Latest update:


Drinking Water Statistics
Safe drinking water is still out of reach for hundreds of millions, including 785 million people using drinking water that is not safely managed, even as progress has lifted safely managed coverage to 60% by the latest JMP estimates. This page connects the health stakes behind that gap, like WHO linking unsafe water to 160,000 under 5 diarrhoea deaths each year, to the practical safety math of treatment barriers and monitoring, plus what it costs to deliver it.

Carbon Capture Industry Statistics
2026 figures in Carbon Capture Industry reveal how deployment is moving faster than expected while costs and policy momentum struggle to keep pace. Get the hard numbers behind the latest capture capacity, investment shifts, and emissions impact so you can see where the gap between ambition and reality is widening or closing.

Nuclear Industry Statistics
Nuclear investment is widening in both directions fast, with IEA clean energy power funding needs of US$1.6 trillion through 2030 alongside US$60 billion earmarked for advanced reactor demonstrations, while uranium mining and services are valued at US$8.7 billion in 2024. For operators and builders, the page links capacity and safety performance to costs and timelines, from 10-year average build periods to grid connection and US$6.8 billion spent fuel management services, helping you see where momentum, risk, and spend actually converge.
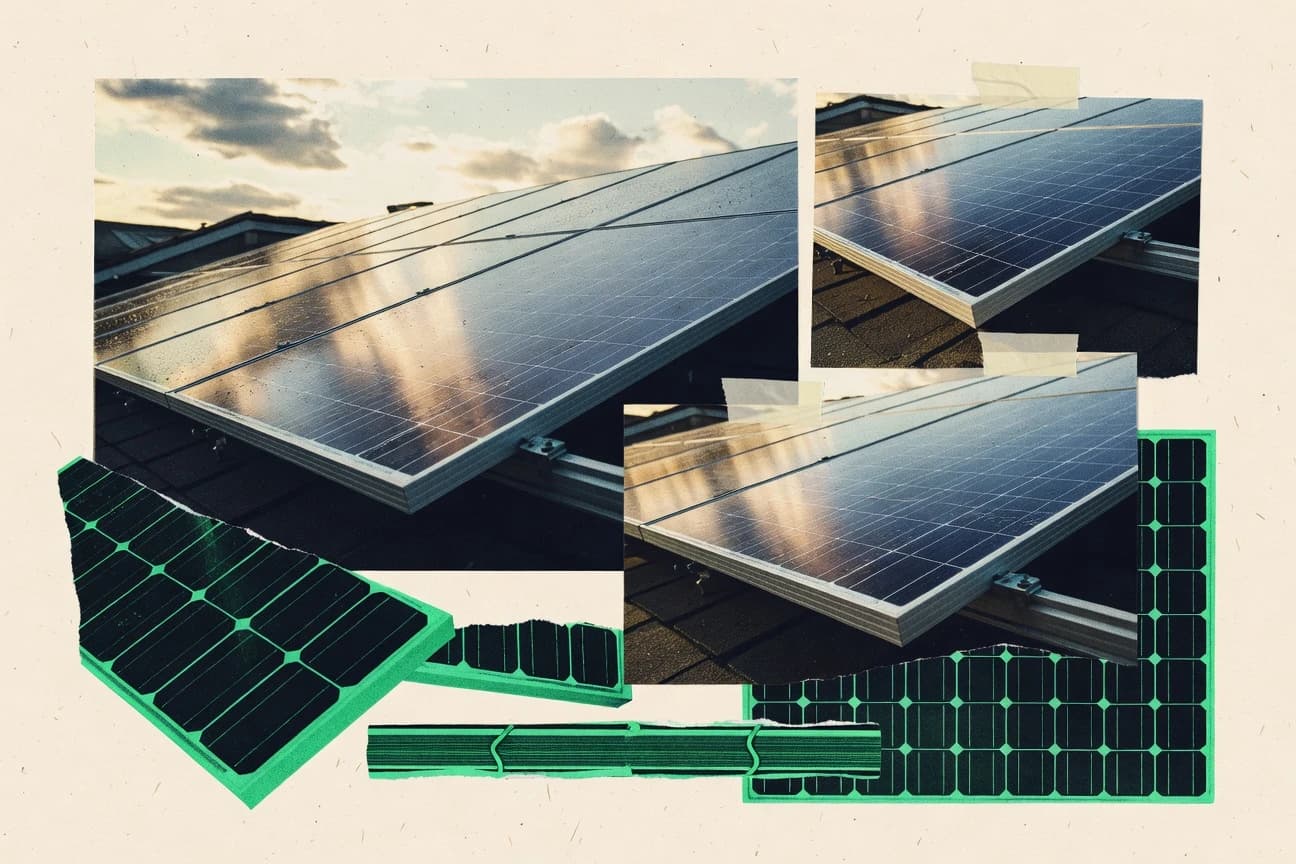
Solar Industry Statistics
Solar is already reshaping power and supply chains, from U.S. residential installations making up just 0.3% of generation to solar PV expected to grow 2.3 times by 2030 in the IEA’s stated policies scenario. You will also see how policy incentives like the 30% ITC through 2032 and storage co development have shifted new capacity patterns, alongside the climate impact of 2.3 million metric tons of CO2e emissions avoided by solar thermal and PV generation.
European Solar Industry Statistics
Europe’s solar industry is scaling fast enough to make last year’s momentum look small, with 2026 demand projections and the latest installed capacity figures pointing to a step change rather than a steady climb. Read how manufacturing output and market growth are moving at different speeds across countries, and what that mismatch could mean for jobs, investment, and grid planning across Europe.
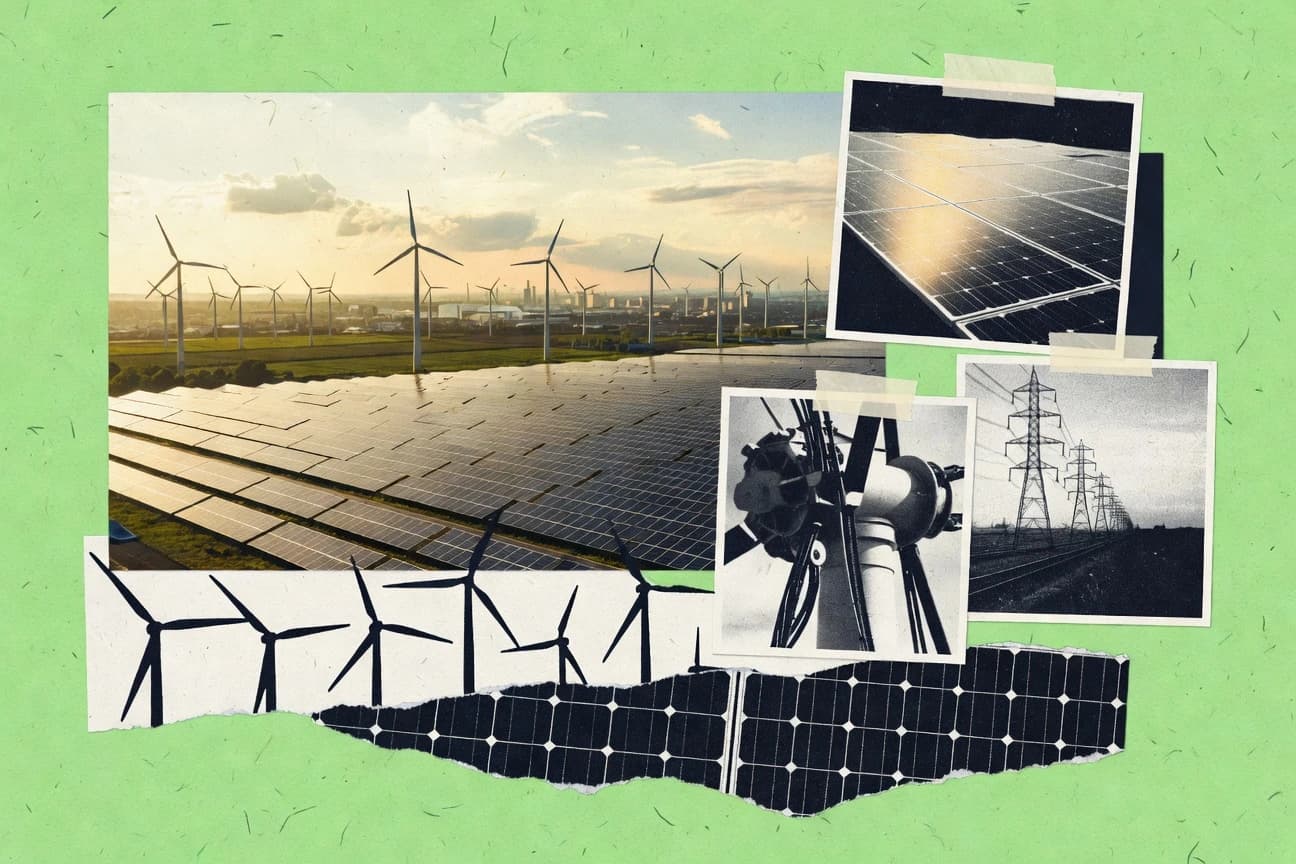
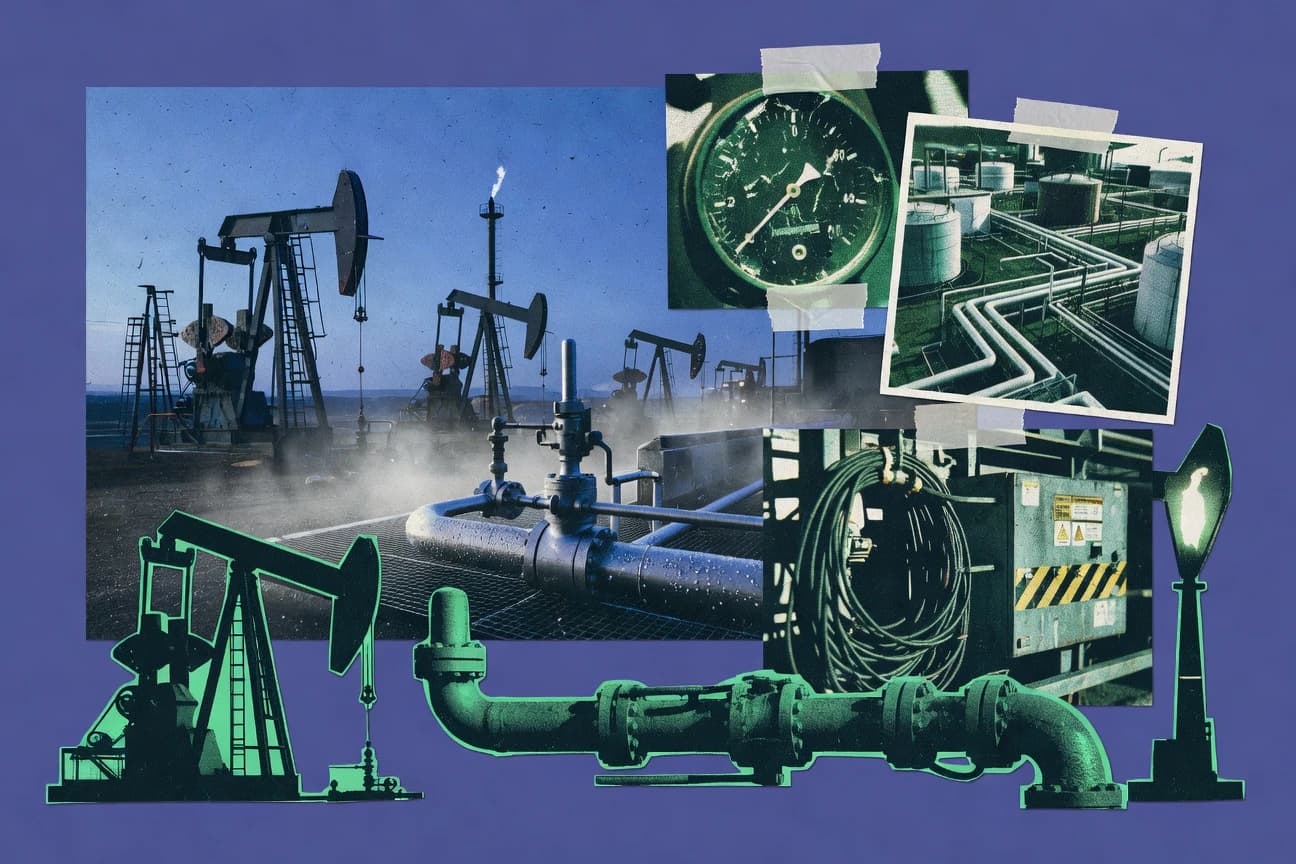
Energy Industry Statistics
Fossil fuel investment still pulls $1.1 trillion a year, yet renewables are driving 66% of global electricity growth, while wind and solar keep getting cheaper and scaling fast. See how $400 billion in grid spending by 2030, rising flexibility from hydropower, and clean energy jobs reshaping demand sit alongside 46% of emissions tied to energy and fast-growing oil and gas use.
Oil Market Statistics
Get the latest snapshot of the oil market, where 2026 figures flip the usual expectations on demand and pricing, and OPEC and US production signals start to look less synchronized. Use these key statistics to quickly spot what is tightening supply, what is easing pressure, and where the next move is most likely to show up.
Eu Solar Industry Statistics
See how 2026 data on EU solar industry momentum and grid capacity is reshaping the pace of deployment, and why the gap between policy ambition and real world expansion has never looked so measurable. The page brings together the latest production, investment, and market signals so you can spot which constraints are easing and which ones are tightening.
Global Energy Statistics
At 66% fossil share of electricity generation in 2023, global power still runs heavy on fuels even as clean investment hits $1.3 trillion and grid batteries add 42 GW in the same year. Track the pressure points from energy driven CO2 growth to 4.62 mm per year sea level rise and compare policy risks against the 2.0°C threshold using health and climate co benefits that reach 6.9 million premature deaths avoided annually by 2050.
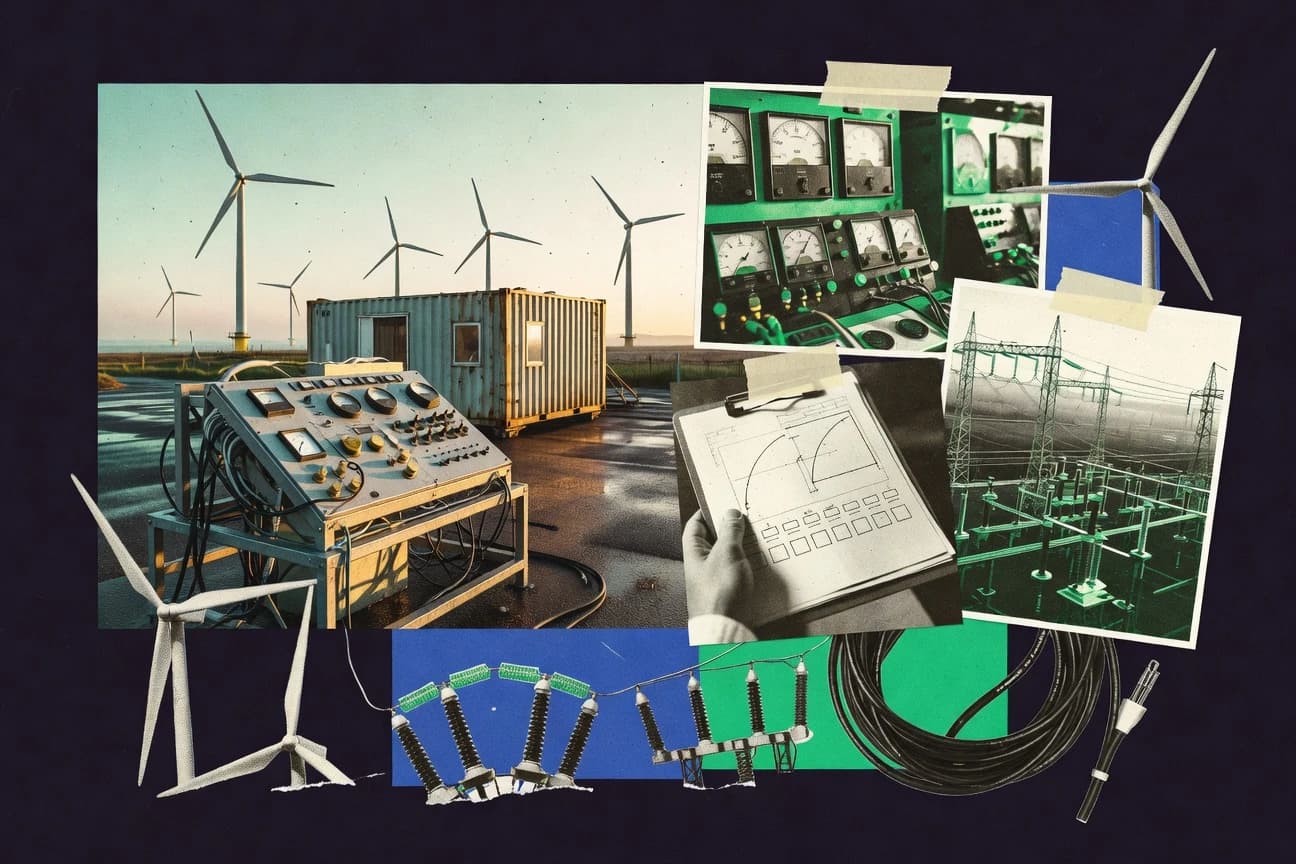
Wind Turbine Industry Statistics
See how wind turbine deployment is reshaping the industry fast, with 2026 capacity and generation figures that signal a noticeable shift from recent years. The page pairs that momentum with project timelines and market costs so you can spot where growth is accelerating and where headwinds are tightening.

Electricity Prices Germany Industry Statistics
Germany’s industry electricity prices show how quickly costs can swing, with the latest 2026 figures putting real pressure on factory planning. This page pins down the most important moves in what businesses pay and where the price action is coming from, so you can spot the shift before the next procurement cycle.
Pv Industry Statistics
Pv Industry statistics reveal how fast the market is shifting in 2026, with production and deployment trends moving in ways that catch even seasoned players off guard. Get the key figures that explain what changed, where the growth is concentrating, and what that means for pricing and planning right now.
Global Renewable Energy Statistics
With 2026 and 2025 snapshots of global clean power growth, this page shows where renewables are surging and where the transition is still slipping, turning headline ambition into measurable reality. You will see the key shifts behind the statistics, so you can spot whether the world is accelerating toward climate goals or simply reshuffling generation.

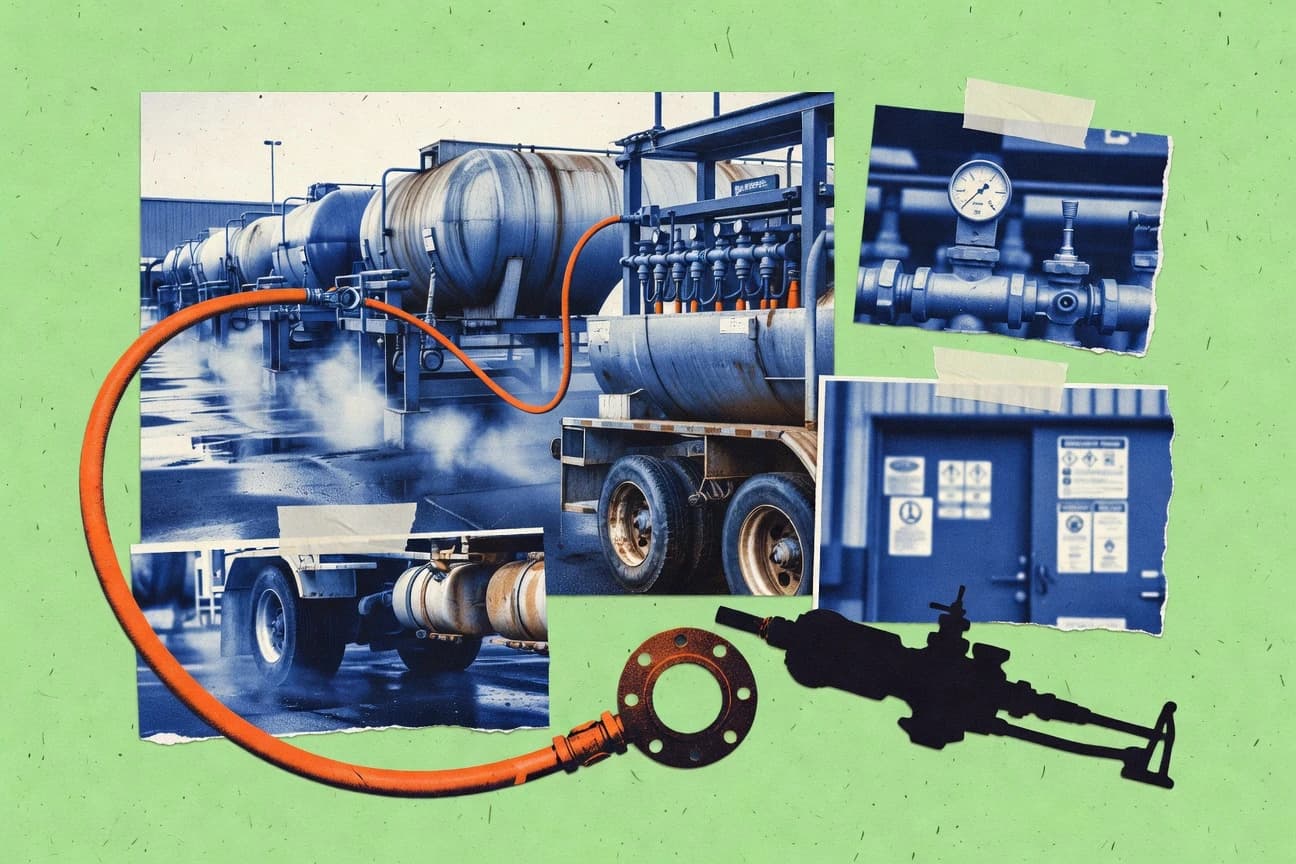
Propane Distribution Industry Statistics
Even as U.S. propane spot signals soften and inventory swings widen, the industry moves real volume, from 58.7 million metric tons of LPG processed in 2022 to 1,717 propane service establishments that keep bulk distribution humming. Get the cost and supply contrasts behind that motion, including average 2023 retail propane of $3.23 per gallon and winter inventory drawdowns, alongside the safety and regulatory checkpoints that shape how propane gets stored, transported, and delivered.
Solar Panel Statistics
Solar kept widening its lead in 2023 with 447 GW of new capacity and 1,540 TWh of generation, reaching 5.8% of global electricity while the EU hit 8.5% with 263 GW. But the page goes beyond deployment and output to compare costs, reliability, and policy signals across regions so you can see where solar is scaling fastest and what still limits it.
Petroleum Distribution Industry Statistics
Retail gasoline margins and diesel margins stayed close to the high teens in 2023, while U.S. rack prices and Gulf Coast spot values swung enough to reshape what refiners, distributors, and stations actually earned per gallon. This page ties price spreads to real supply flows and infrastructure scale, from millions of barrels of stocks and product supplied to the distribution footprint of roughly 150,000 stations and industry risk and compliance signals.
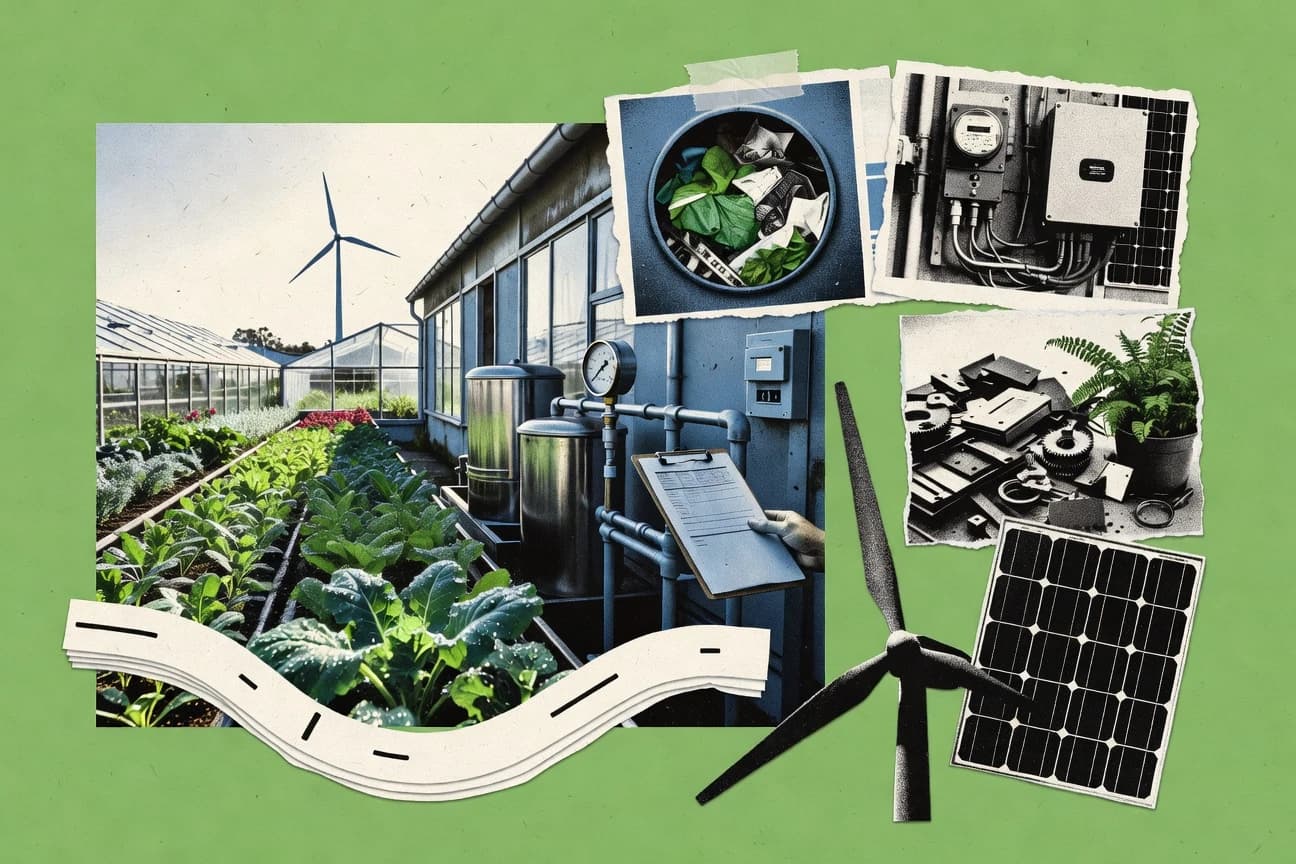
Green Industry Statistics
Clean energy is scaling while buildings and infrastructure are quietly becoming the biggest growth engine. From $495 billion of clean energy investment in 2023 to green building materials projected to jump from $427.6 billion in 2023 to $1,016.4 billion by 2032, plus major momentum in heat pumps, solar, and circular economy markets, this page connects the sector wide rise in $ and jobs to the climate pressures pulling it all forward.
Oil Production Statistics
Global oil production added 1.8 million barrels per day of upstream capacity in 2023 while crude output still grew only 1.1 percent year over year, a gap that makes supply and capacity decisions worth scrutinizing. From Permian volumes of 12.9 million barrels per day to OPEC call on OPEC buffer capacity of 14.7 million barrels per day, the page connects where barrels come from with what it costs and what emissions intensities look like.
Uk Energy Industry Statistics
With UK energy industry figures updated through 2025, this page puts sharp focus on how fast the mix is changing, from generation and renewables to demand and prices. The standout tension is how near term stability can mask rapid shifts elsewhere, so you can spot what’s really driving the next turn in the market.

Uk Water Industry Statistics
PR24 sets England’s water and wastewater regulated revenue at £10.7 billion for 2023/24 while companies planned average investment of £10.4 billion a year for 2024 to 2025, alongside £86 billion of total investment allowances across 2025 to 2030. The page also weighs performance against incentives and outcomes, from a 3.8% PR24 WACC and a £1.55 per customer service incentive to storm overflows under pressure and drinking water compliance at 99.5% of samples in England for 2022/23.