GITNUX MARKETDATA
Browse Our Category
Environment Energy
Latest update:

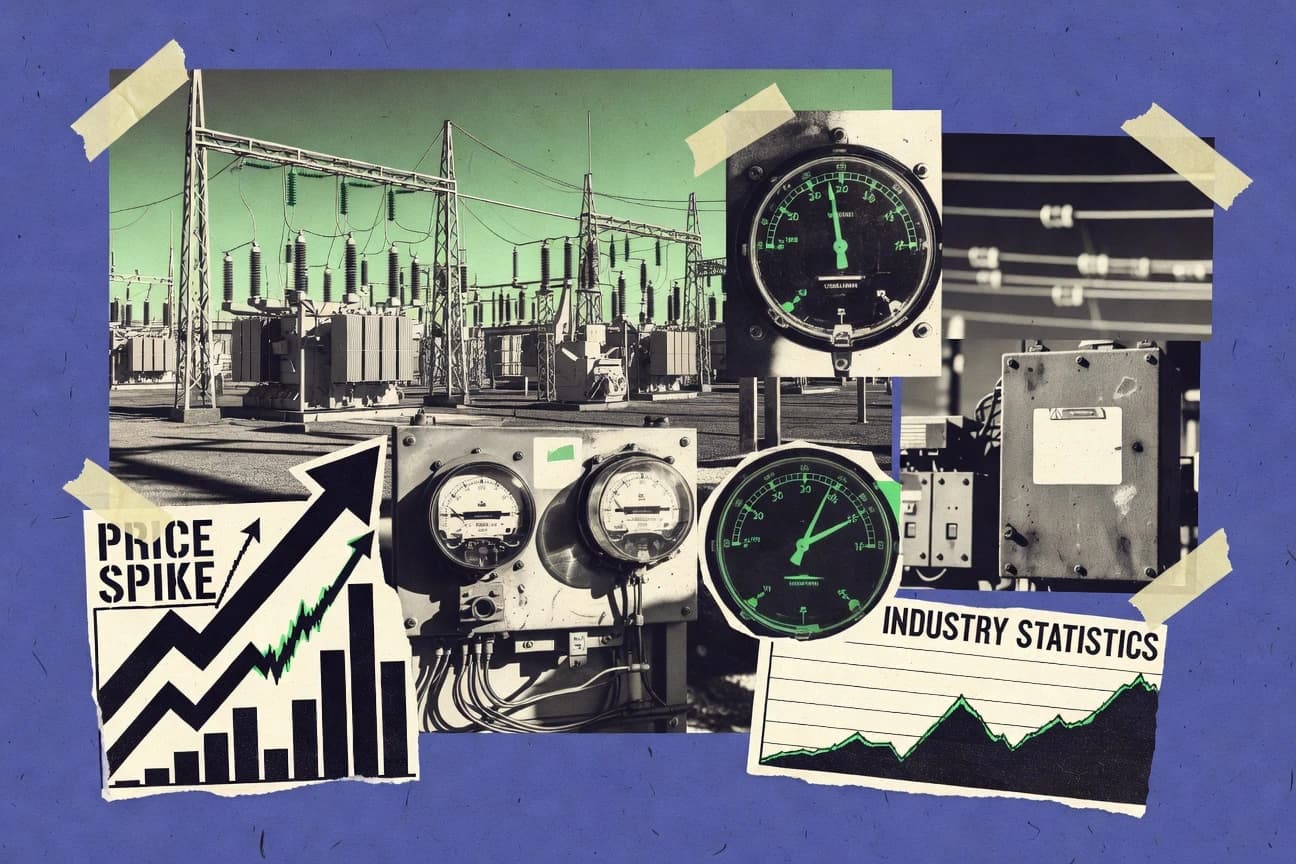
Energy Prices Industry Statistics
Electricity and gas price levels across the EU and US are being reshaped by volatility that shows up immediately in sector costs, from €0.26 per kWh household electricity and €0.112 per kWh household gas in the EU to 14.71 cents per kWh US electricity retail in 2021 and Henry Hub averaging $2.52 per MMBtu in 2023. The page also pinpoints what matters next for 2025 and beyond, with EU electricity prices rising 2.1% year on year in July 2024 and UK household energy bills still climbing 6.5% for electricity and 5.1% for gas from 2022 to 2023, plus the policy bill size behind it all reaching €200 billion
Us Energy Industry Statistics
U.S. electricity output reached 1,179 TWh in 2024, while utilities grappled with storm losses that averaged $1.2 billion a year from 2019 to 2022 and the grid spent $18.8 billion on resilience to keep up. With 58.9% of coal used for power generation alongside 150.7 GW of wind and rising smart meter and grid software deployments, this page ties generation choices, emissions from electricity, and transmission and distribution investment into one current snapshot.

Lithium-Ion Battery Industry Statistics
Global lithium-ion prices keep sliding, with median pack costs around $118 per kWh in 2023, while supply and policy are tightening the real cost picture through nickel volatility and higher EU recycling requirements. See how China leads manufacturing with 31% of cell capacity and nearly half of EV sales, how fast-charging and energy density targets are rising, and why used-battery volumes are set to scale sharply toward 2030.
Backup Generator Industry Statistics
Backup generator demand is rebounding fast, with U.S. market revenue projected to reach $6.3 billion in 2026 even as growth stays uneven by application. You will see which installation drivers are accelerating and which segments are falling behind, so it is easier to spot where backup power is headed next.
Energy Prices Germany Industry Statistics
Energy Prices Germany Industry lays out how power and gas costs are reshaping factory margins, with the latest 2026 snapshots making clear that today’s shock is not just higher bills but a different cost rhythm across sectors. See which industries are absorbing the shift and which are still exposed as prices move faster than long term planning.

Perovskite Industry Statistics
See how perovskite industry momentum shifts when you compare 2025 capacity plans and investment activity to the latest device performance signals, where progress is tightening the gap between lab promise and factory reality. The page puts the newest 2025 figures side by side so you can spot what is accelerating and what is still lagging before the market’s next moves harden into benchmarks.
Electricity Industry Statistics
In 2025, electricity industry output and grid performance are shifting in measurable ways, with key indicators tracking how supply is keeping up as demand changes. If you want to understand where reliability is improving and where stress is building, this is the fastest way to see the contrast across the latest statistics.
Germany Solar Industry Statistics
Germany’s solar industry is showing fresh momentum, with 2025 and 2026 figures that reveal how quickly new capacity, grid buildout, and policy momentum are reshaping the market. Get the numbers that explain whether growth is accelerating or merely catching up, and what that shift means for investors, installers, and households.
Solar Energy Industry Statistics
Track how solar keeps pulling demand forward, with 2026 projections showing the market is accelerating even as installation growth and capacity additions keep reshaping costs and deployment timelines. This page puts the latest Solar Energy Industry statistics side by side so you can see where momentum is building and where supply, demand, and policy pressures are most likely to flip next.
Refining Industry Statistics
Refining Industry’s 2026 snapshot puts real pressure on assumptions, with demand and utilization signals moving differently across regions than in prior years. Get the latest figures on throughput, capacity, refining margins, and trade flows so you can see where the next bottleneck is forming before it shows up on the balance sheet.

Great Lakes Statistics
With 2026 data showing sharp shifts in Great Lakes water quality and access, the numbers reveal how quickly pressures are changing across shoreline communities. Don’t just skim the headlines because the most consequential contrasts are right there in the trends, from year to year and lake to lake.
Solar Pv Industry Statistics
Global solar PV deployment is set to keep accelerating, with 2025 demand trends and market growth numbers showing far more momentum than many forecasts expected a year ago. Read the Solar Pv Industry statistics page to see where those gains concentrate across regions and what the newest capacity, investment, and pricing shifts suggest for 2026.
Europe Battery Industry Statistics
Get a clear picture of where Europe’s battery industry is accelerating right now, with 2025 and 2026 figures that highlight how quickly capacity and investment are shifting compared with what the market was banking on. See which segments are pulling the growth forward and where the bottlenecks are forming, before the next procurement cycle locks in demand.
World Oil Industry Statistics
Global oil demand is projected to hit 105.2 mb/d in 2026, and the page tracks how fast growth is shifting where it comes from while exports, refining, and upstream spending are moving in different directions. If you want to understand why 2025 and beyond looks unlike the last cycle, these statistics put the pressure points in plain numbers.

Japan Recycling Industry Statistics
Japan’s recycling industry is showing a sharper edge in 2026 as key performance indicators point to faster movement in how waste is recovered and recycled, not just counted. If you only think of recycling as a municipal duty, these statistics will challenge that assumption by contrasting rising recovery momentum with the stubborn gaps that still separate targets from outcomes.

North Sea Oil Industry Statistics
See how North Sea operators are reshaping output and spending as recent production and investment figures diverge, including 2026 North Sea oil production of 1.85 million bpd. The contrast between where the barrels are headed and how quickly budgets are moving makes the trends impossible to ignore.
Oil & Gas Industry Statistics
With 2026 figures reshaping expectations across exploration, production, and pricing, this page captures how quickly momentum can swing in Oil & Gas Industry performance. You will see the sharp contrast between what the sector plans for and what the latest indicators are actually signaling.

Lithium Battery Industry Statistics
Track how EV adoption and battery manufacturing are colliding with recycling economics, from lithium ion battery capacity expected to reach 1,000 GWh globally in 2025 to the $40 billion lithium ion battery recycling market projected by 2032. You will see why battery pack prices have plunged to $137 per kWh by 2022, while policy levers like the EU Battery Regulation and the EU IPCEI funding push the supply chain toward recovery instead of disposal.
Eu Green Industry Statistics
See how EU Green Industry output and clean production are shifting in 2025, with the latest figures that highlight where investment, capacity, and employment are moving fastest. The page also weighs the scale of renewables buildout against grid and policy pressures to explain why the next gains may be harder but more focused.
Renewable Energy Growth Statistics
With renewables supply rising in Denmark to 59% of electricity generation and offshore wind electricity costs estimated at about 6 to 11 US cents per kWh in 2023, the page links price drops to real grid progress. It also puts $496 billion in 2023 global renewables investment and a projected $4.8 trillion grid buildout by 2030 side by side, showing why permitting, storage, and transmission are becoming the bottleneck, not the ambition.